How to monitor Microsoft SQL Server performance with Grafana Cloud
A database is one of the most critical components for almost every application. Making sure it is running with the expected read and write latencies is paramount. This can be the difference between a smooth, pleasing user experience and a slow, error-filled one that makes your customers turn their back on a product — and never come back.
Microsoft SQL Server is a widely used and time-tested database that is deployed to monitor applications and prevent performance issues, and we are pleased to announce that Grafana Cloud now has a dedicated Microsoft SQL Server integration.
I will guide you through the details of how to start using this integration to make monitoring your Microsoft SQL Server database easy-peasy.
How to configure Microsoft SQL Server with Grafana Cloud
The Microsoft SQL Server integration utilizes metrics generated by the open source sql_exporter project. We embedded it into the Grafana Agent, so it’s easier for you to run it in your environment and start collecting both metrics and logs from your server with a single agent and configuration. You can start monitoring your Microsoft SQL Server deployment with Grafana Cloud by following these simple steps:
- A Grafana Cloud account is required to use the Microsoft SQL Server integration. If you don’t have a Grafana Cloud account, you can sign up for a free account today.
- Install the Microsoft SQL Server integration and configure the Grafana Agent to collect logs and metrics from it. Please refer to how to install and manage integrations documentation for more information. For details around configuring Grafana Agent for this integration, refer to our Microsoft SQL Server integration documentation.
Start monitoring your Microsoft SQL Server instance with Grafana
After the integration is installed, you will see two prebuilt dashboards for Microsoft SQL Server and a set of related alerts automatically installed into your Grafana Cloud account.
Microsoft SQL Server overview dashboard
This dashboard gives a general overview of the Microsoft SQL Server instance based on all the metrics exposed by the embedded Prometheus exporter.


The key metrics monitored are the following:
- Connections count
- Deadlocks counts
- Severe Errors count
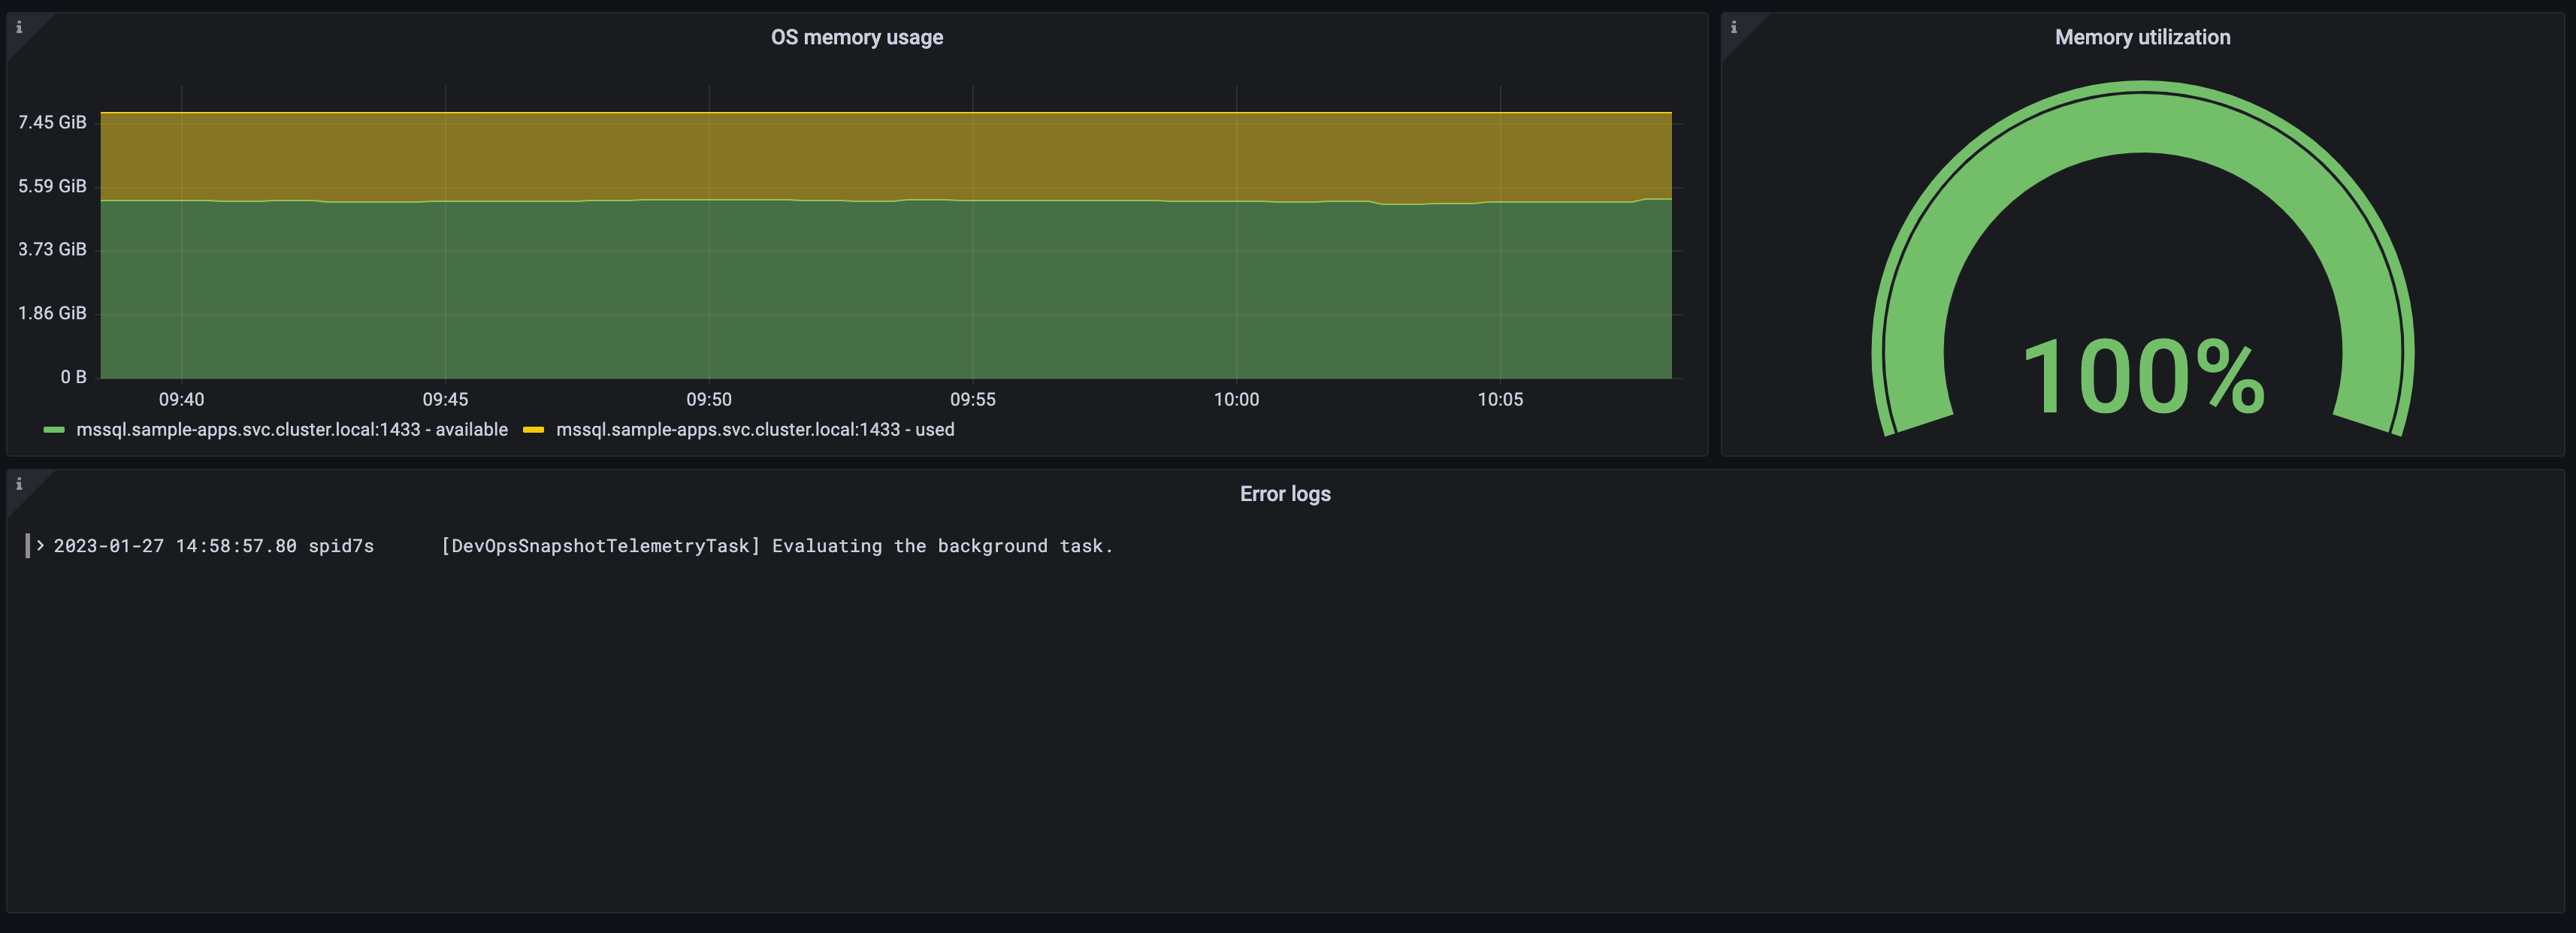
- Memory usage
The Microsoft SQL Server overview dashboard also contains a log panel so you can correlate logs and metrics for troubleshooting.
Microsoft SQL Server pages dashboard
This Grafana dashboard provides a deep dive into the pagefile behavior of your SQL Server instance. This is key since the pagefile behavior might indicate a lack of memory resources for your database. Generally a big pagefile means that the resource allocation for your workload is not well balanced.

Microsoft SQL Server alerts
The integration also comes packaged with a number of handy alerts. Note: All of the alert thresholds below are set as defaults and can be configured to meet the needs of your environment.

MSSQLHighNumberOfDeadlocks
This alert monitors the mssql_deadlocks_total metric and alerts if there are more than 10 deadlocks in the last 5 minutes. Deadlocks are a common cause of issues in databases, and a growing number of them will probably cause decreased performance and even data inconsistency.
MSSQLModerateReadStallTime
This alert monitors the mssql_io_stall_seconds_total metric and alerts with a Warning severity level if the read stall has been higher than 200ms over the last 5 minutes. A high read stall will result in a poor query performance, so it is important that this number remains low.
MSSQLHighReadStallTime
This alert monitors the same condition as the previous one, but with a higher threshold of 400ms and a Critical severity level.
MSSQLModerateWriteStallTime
Similar to the previous alerts, this monitors the same metric mssql_io_stall_seconds_total filtering for write ops and alerts with a Warning severity level if the read stall has been higher than 200 ms over the last 5 minutes. A high number means write operations are taking too long to perform, which will result in poor database performance.
MSSQLHighWriteStallTime
This alert monitors the same condition as the previous one, but with a higher threshold of 400 ms and a Critical severity level.
Learn more about the Microsoft SQL Server integration in Grafana Cloud
The prebuilt Grafana dashboards and alerts in our latest Grafana Cloud integration can help you get your Microsoft SQL Server monitoring up and running quickly.
Give our Microsoft SQL Server integration a try, and let us know what you think! You can reach out to us in our Grafana Labs Community Slack in the #Integrations channel.
Grafana Cloud is the easiest way to get started with metrics, logs, traces, and dashboards. We have a generous forever-free tier and plans for every use case. Sign up for free now!


