A year in Mimir: Massive scale, new metrics formats, increased adoption
When we introduced Grafana Mimir into the open source ecosystem, we weren’t shy about our ambitions. Once we got past answering some of the easier questions (For the record, the name Mimir comes from Norse mythology, and it’s pronounced /mɪ’mir/.), we quickly got to work making good on our promise to deliver the most scalable, most performant open source time series database (TSDB) in the world.
Since launching Mimir a year ago, we have focused our efforts on enhancing Mimir’s core capabilities to provide significant scale — 1 billion active series and beyond — with easy deployment, multi-tenancy, durable storage, high availability, and super fast query performance. We’ve also expanded Mimir’s interoperability: We open sourced write proxies to natively ingest different metrics formats (no more changing your code!) and introduced out-of-order sample ingestion.
There’s supposed to be a video here, but for some reason there isn’t. Either we entered the id wrong (oops!), or Vimeo is down. If it’s the latter, we’d expect they’ll be back up and running soon. In the meantime, check out our blog!
To manage all those metrics, Grafana Mimir — as well as Grafana Cloud Metrics and Grafana Enterprise Metrics, which are powered by Mimir — offers feature sets that deliver massive scale and flexibility. In addition, we also want to instill confidence in our TSDB within the open source community, so we have been dogfooding all Mimir features internally at Grafana Labs from the very beginning.
“The cool thing is that the features we have released in Mimir have been running in [Grafana Cloud] for months at Grafana Labs, from small clusters to very big clusters,” Grafana Labs Software Engineer Marco Pracucci said on “Grafana’s Big Tent podcast.” “That’s why we have confidence in the stability of this system.”
Or, as Grafana Labs Principal Software Engineer Cyril Tovena put it on the same podcast: “It’s battle-tested.”
Now, with roughly 3,000 stars on GitHub and climbing, we are excited to continue building a next-generation TSDB that will increase efficiency and decrease spend. Here’s a look at where Mimir is today — and where we are heading in the future.
Scale to 1 billion active series? Done.
Across the industry, there has been a relentless demand to collect metrics at a massive scale that was unimaginable just a couple years ago. At Grafana Labs, we’ve seen an increasing number of customers who need to scrape hundreds of millions of active time series from a host of different data sources. In the recent Grafana Labs Observability Survey, 68% of active Grafana users say they have at least 4 data sources configured in Grafana, with 28% of those pulling data from 10 or more data sources.
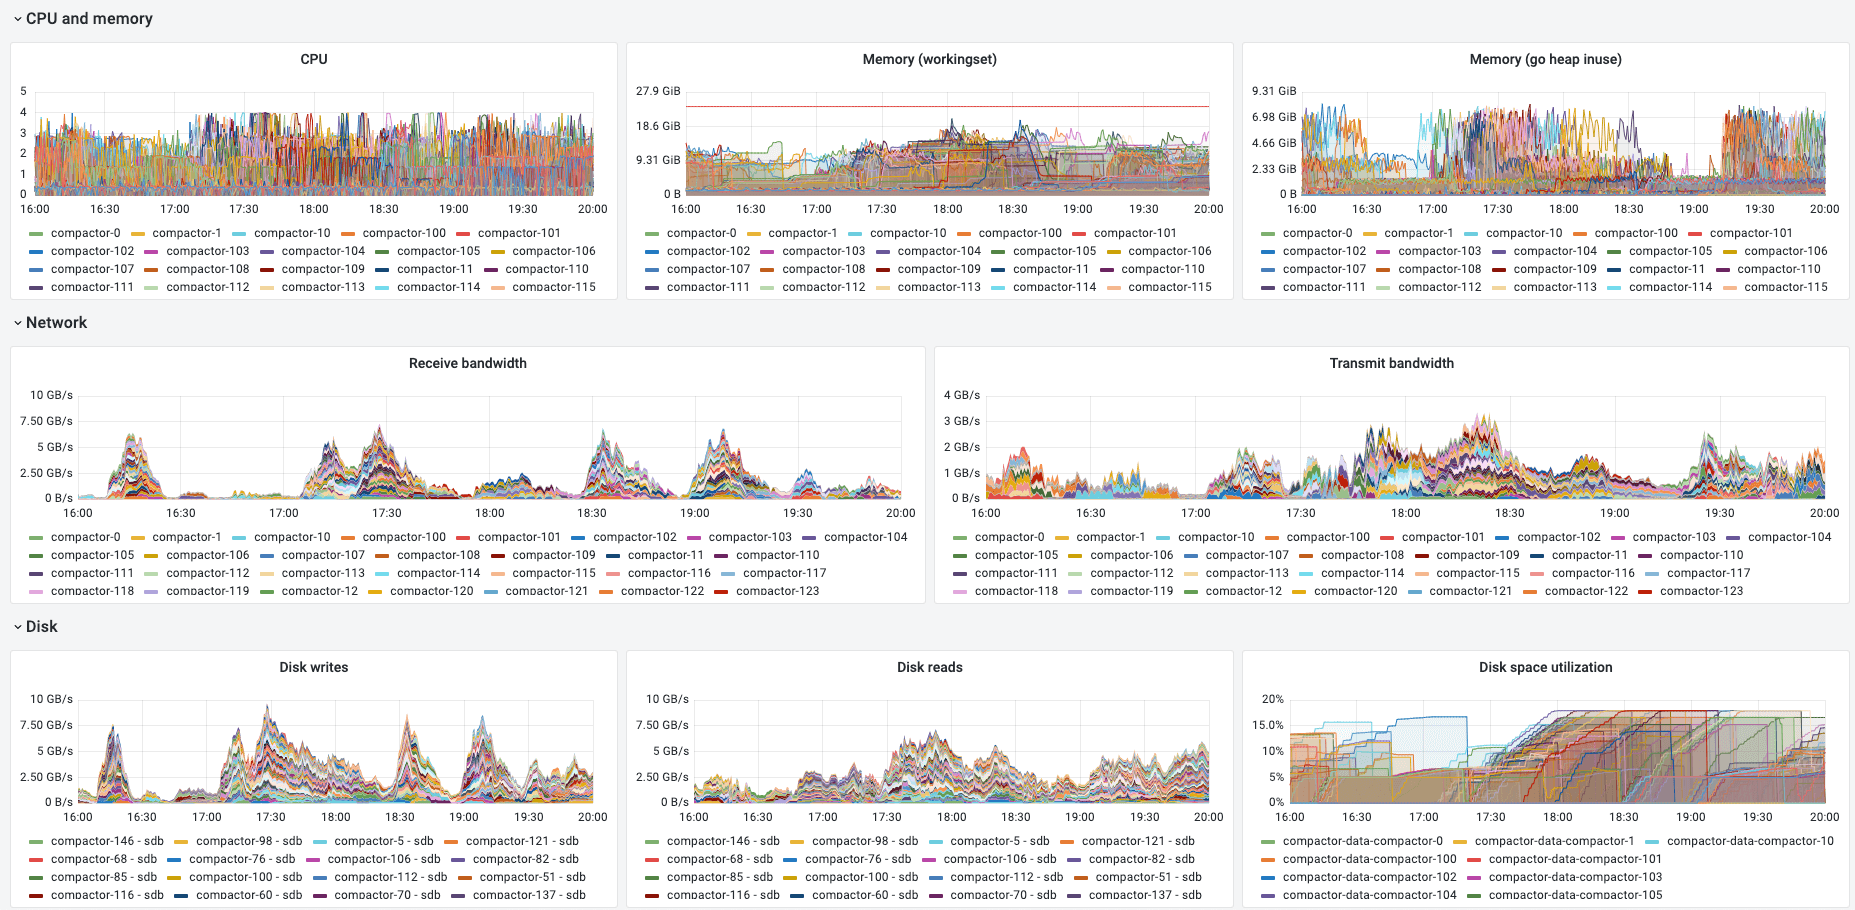
We wanted to make sure that Grafana Cloud, which runs on Mimir, could comfortably support this scale before introducing the tool to our users. So in 2021, we used the open source performance testing tool Grafana k6 to perform extensive load testing on Mimir with a single tenant that had 1 billion (yup, “b” as in billion) active series. In the course of this testing, we found and fixed several issues, which led to substantial improvements to Mimir’s performance:
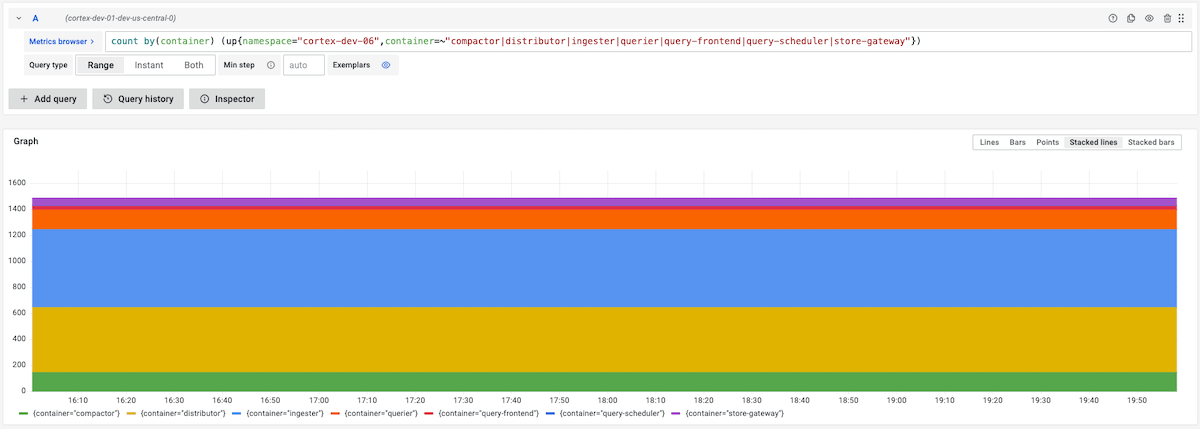
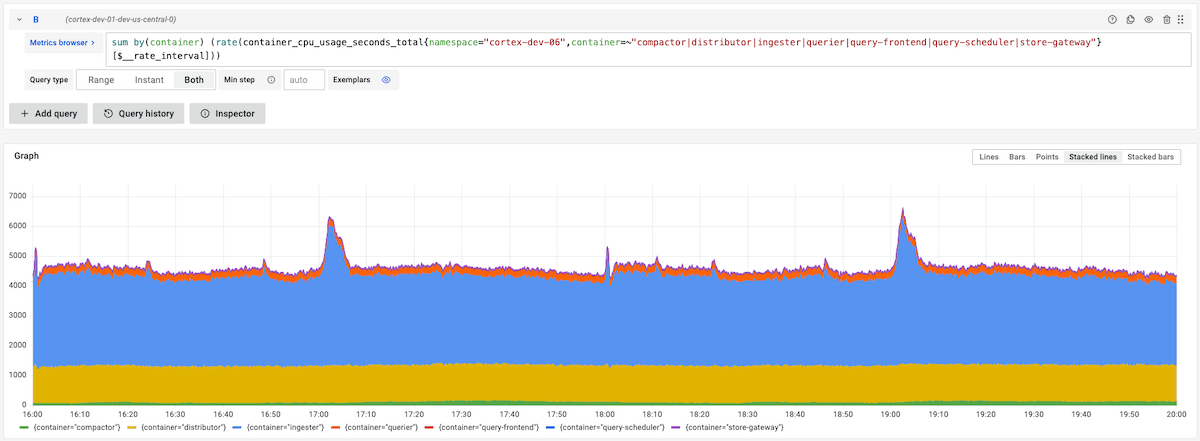
You can learn more by reading our blog post on how we scaled Mimir to 1 billion active series. You can also replicate our results by running this Grafana k6 script against a Grafana Mimir cluster spanning 1,500 replicas, about 7,000 CPU cores, and 30 TiB of RAM.
Run 10x faster queries
With more organizations turning to a distributed infrastructure, there is a greater need to query data efficiently across multiple machines. However, this often results in high cardinality data running in a single query that can stretch across time series, clusters, and namespaces.
To resolve this problem, we built Mimir on a microservices-based architecture, so all of Mimir’s components are horizontally scalable. One of these components is the querier, which evaluates queries. As we scale and ingest more metrics, not only do we have to efficiently ingest a higher volume of queries; Mimir also has to handle bigger, high-cardinality queries without sacrificing performance.
To overcome the limitations of running queries in a single thread, we introduced two sharding techniques that allow us to execute a single query across multiple CPU cores and machines in parallel: time splitting and query sharding. By using this sharded query engine, Mimir can run blazing-fast, high-cardinality queries — query sharding alone produced a 10x reduction in execution time for high cardinality and CPU-intensive queries.
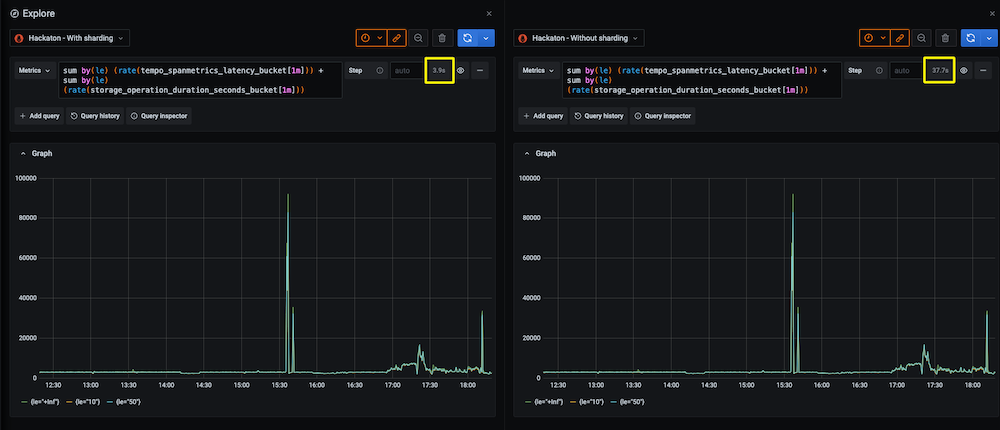
Check out our blog post on query performance in Mimir, and learn more about how query sharding works in our Grafana Mimir documentation.
A single TSDB for all your metrics
With the release of Mimir proxies last August, the open source project became an all-in-one TSDB.
When we launched Mimir, we focused on natively consuming Prometheus metrics. But within four months, we open sourced three write proxies to ingest metrics for Datadog, InfluxDB, and Graphite. OpenTelemetry quickly followed suit via the OpenTelemetry Collector (OTel Collector).
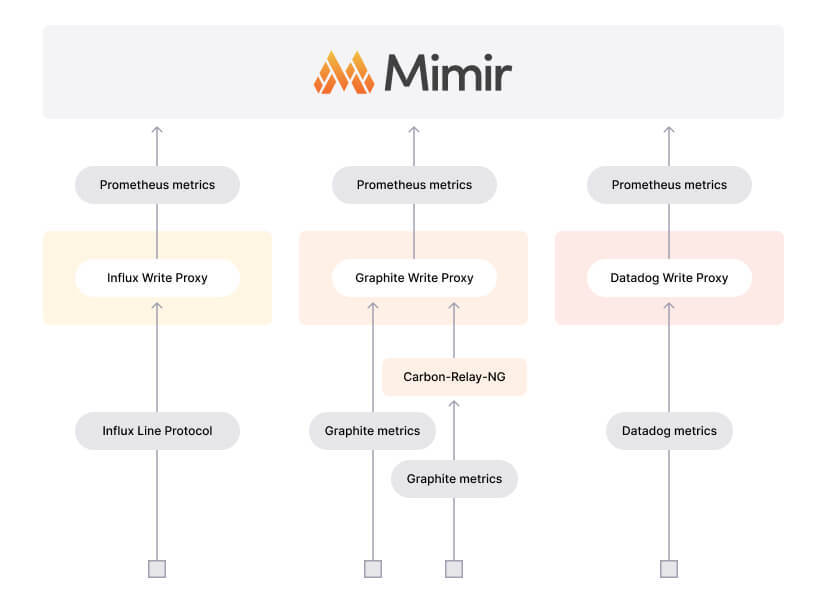
With the introduction of these proxies, users don’t have to change their code to ingest metrics into Mimir. After all, the vision for Mimir is not to be the best, most scalable Prometheus backend, but to be the best, most scalable time series database. Period.
To get started ingesting Datadog, InfluxDB, and Graphite metrics, go to our blog post about Mimir’s expanded interoperability. For more about OpenTelemetry, check our Mimir documentation.
Ingest data without strict time ordering
Traditionally, the Prometheus TSDB only accepts in-order samples that are less than one hour old, and then it abandons everything else. While this hasn’t really been much of a limitation for users because Prometheus has a pull-based model that scrapes data at a regular cadence, there are several use cases that do need out-of-order support. (Think: IoT devices programmed to write metrics asynchronously.) Plus, as observability expands to different industries and use cases, the limitation of in-order sampling can become a blocker for some solutions.
With the release of Grafana Mimir 2.2 came experimental support to accept out-of-order samples. With out-of-order support, Grafana Mimir can accept time series data from any metrics system that requires old samples to be ingested. This makes Grafana Mimir a general purpose TSDB, beyond simply a long-term storage.

To learn more, refer to our blog post about out-of-order sample ingestion and our TK documentation.
What’s next for Grafana Mimir
As the project’s popularity in Github continues to grow, so have the number of users from companies like Adobe, who talked about their observability stack with OpenTelemetry, Grafana Mimir, and Grafana Tempo during an ObservabilityCON 2022 session (now available on demand) and Pipedrive, who saw the advantages of Mimir immediately.
“The biggest benefit of migrating to Mimir was solving the Prometheus scalability limits we were facing,” Pipedrive Infrastructure Team Lead Karl-Martin Karlson wrote in a Grafana Labs blog. “Migrating to Mimir gave us much more room to scale as Pipedrive services started to expose more and more metrics each day.”
While interest in metrics continues to grow, with customers investing in Grafana Enterprise Metrics and Grafana Cloud, the team is looking to expand the scope of Mimir in the upcoming year. This includes adding support for Prometheus’s new native histograms, as well as simplified deployment modes for easier scaling. Watch for upcoming improvements in many areas — logging, tracing, testing, maintainability, and more. In the end, our goal is to be the best single tool to store all of your metrics.
You can learn more about how the Grafana Labs team built the most scalable, performant TSDB in this Mimir-centric episode of “Grafana’s Big Tent” podcast.
You can also find out more about how to get started with Grafana Mimir in our “Intro to Grafana Mimir” webinar, available for free on demand, or check out Mimir on GitHub.
Grafana Cloud is the easiest way to get started with metrics, logs, traces, and dashboards. We have a generous free forever tier and plans for every use case. Sign up for free now!


