Grafana Agent v0.32 release: New integrations with Oracle, AWS, Microsoft Azure, and more
Grafana Agent v0.32 is now available!
This release includes a host of new integrations for the Grafana Agent and components for Grafana Agent Flow so you can easily monitor your vital infrastructure.
We’re also excited to announce that Flow is no longer in beta. Introduced last fall, Flow is a new configuration mode that makes Grafana Agent easier and more powerful to run. With this latest release, Flow makes the Grafana Agent 100% compatible with OpenTelemetry (OTel), which helps support application observability powered by OTel metrics, logs, and traces and driven by the OpenTelemery Protocol (OTLP).
In this blog post, we’ll dive into all the latest updates in Grafana Agent v0.32.
New integrations
Several new integrations have been added in this release. Now you can monitor your:
- Oracle Database with the embedded oracledb_exporter
- MS SQL Server with the mssql integration
- AWS Cloudwatch Metrics with cloudwatch_exporter
- Azure Monitor Metrics using azure_exporter
- GCP Cloud Monitoring Metrics with gcp_exporter
New Flow components
In addition to all the new integrations noted above, Grafana Agent v0.32 includes a number of Flow components for existing exporters:
- prometheus.exporter.apache
- prometheus.exporter.consul
- prometheus.exporter.github
- prometheus.exporter.process
- prometheus.exporter.redis
We will be adding more Flow components in the near future, so stay tuned! Until then, you can learn more about the existing components for Grafana Agent Flow in our documentation.
We’ve also prepared a number of Grafana Agent Flow tutorials for your reference. You might also want to check out our Grafana Agent Flow documentation or dive into the config language reference to get a more complete picture of what it’s all about.
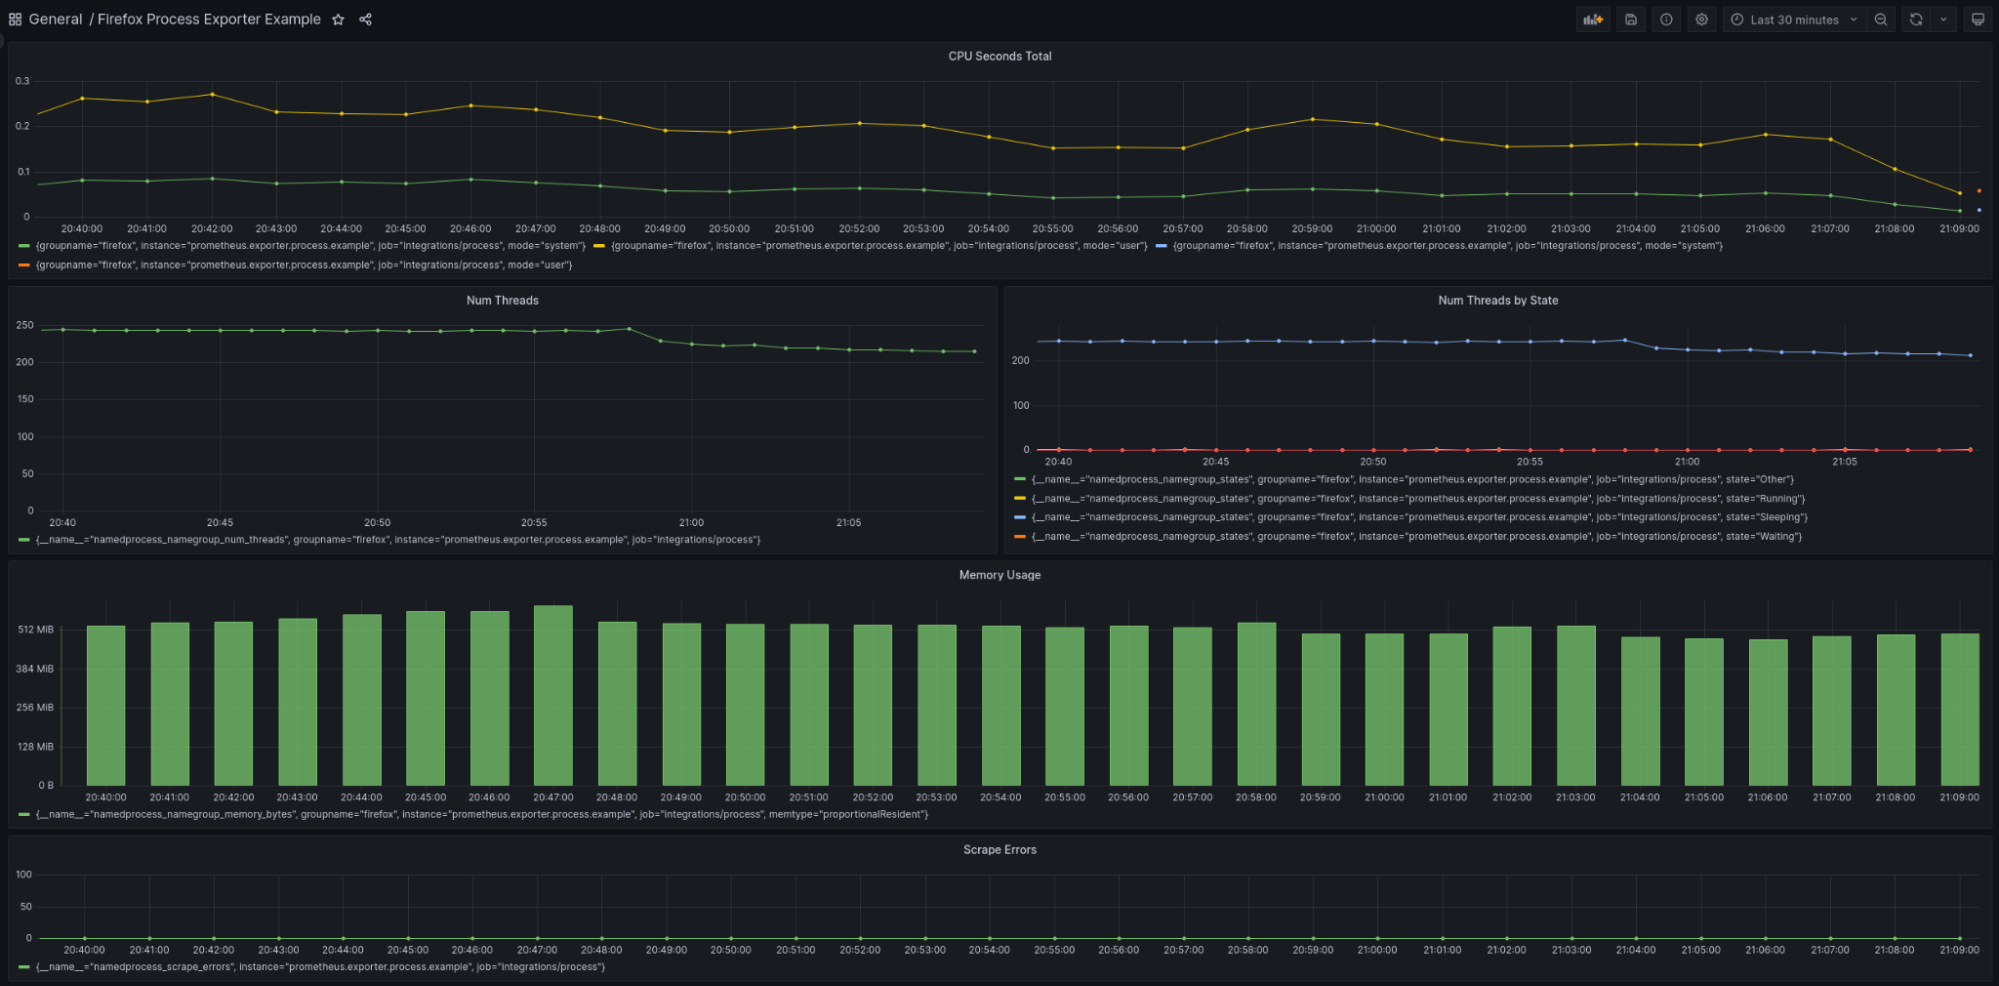
Monitor your Firefox system usage with Flow
Using the prometheus.exporter.process component, we can monitor how many system resources are being used by Firefox (and when it’s time to let go and finally close those tabs).
Start with the following Flow pipeline to set up the prometheus.exporter.process component and ship data to Grafana Cloud.
Note that the prometheus.exporter.process component will only run on systems that support procfs, namely Unix-like operating systems.
// contains the api key to write to Grafana Cloud
local.file "metrics_writer_key" {
  filename  = "<file>"
  is_secret = true
}

prometheus.exporter.process "example" {
  matcher {
	comm = ["firefox-bin"]
  }
  track_threads  = false
}

prometheus.scrape "default" {
  targets	  = prometheus.exporter.process.example.targets
  forward_to = [prometheus.remote_write.default.receiver]
}

prometheus.remote_write "default" {
  endpoint {
	url = "<url>"

	basic_auth {
  	  username = "<user>"
  	  password = local.file.metrics_writer_key.content
	}
  }
}
Learn more about Grafana Agent
For more information on the latest release, please refer to our Grafana Agent documentation or check out our Grafana Agent upgrade guide.
Please make note of some breaking changes in this release, including:
- The use of
EXPERIMENTAL_ENABLE_FLOWto run the Agent in Flow mode has been removed as was announced in v0.30. Instead useAGENT_MODE=flow agent run <path to river config>. - Some Flow components have been merged with their parent blocks to reduce the block hierarchy.
- Flow components previously prefixed with
prometheus.integration.*have been renamed toprometheus.exporter.*. To remove redundancy, these components have also had the_exportersuffix removed. For example, the component that embeds theapache_exporteris now namedprometheus.exporter.apache. - Support for the Flow UI for 32-bit ARMv6 builds has been temporarily removed. These artifacts should be supported again in the next release.
For more information, please refer to our Grafana Agent documentation.
As always, we’d love to hear from you, so feel free to drop by our Grafana Labs Community Slack or check out the Agent repo directly. We look forward to your comments and feedback!
Grafana Cloud is the easiest way to get started with metrics, logs, traces, and dashboards. We have a generous free forever tier and plans for every use case. Sign up for free now!


