Grafana 9.4 release: Easy data source setup, custom panels, Grafana Alerting updates, and more
Grafana 9.4 is here!
With the latest Grafana release, we’re introducing a wealth of new features and improvements that makes getting started with Grafana even easier and that take your visualizations and observability best practices to the next level.
In addition to enabling TraceQL, the new query language for distributed tracing in Grafana Tempo 2.0, for all Grafana Cloud users, the Grafana 9.4 release comes with a fresh round of features. From improved panel design and enhanced alerting to customizable panels, RBAC support for Grafana OnCall, and auto-login support for SAML authentication, this update is packed with exciting changes that will keep your systems running smoothly and provide deeper insights into your data.
For a full rundown of features in the latest release, read our What’s New documentation, and for complete details on Grafana’s recent updates, refer to the changelog.
Note: The Grafana 9.4.1 release also includes security fixes for CVE-2023-0594, CVE-2023-0507 and CVE-2023-22462. To learn more, please read our latest security release blog.
Create custom visualizations
Available in beta in Grafana OSS, Grafana Cloud (Free, Pro, Advanced), and Grafana Enterprise.
First introduced in Grafana 9.3, the canvas panel is an innovative way to combine the power of Grafana with the flexibility of custom elements. With the canvas panel, you can design custom visualizations and overlay data in ways not available with standard Grafana panels, all within Grafana’s UI.
Canvas visualizations are extensible form-built panels allowing you to place elements within static and dynamic layouts. In Grafana 9.4, we’ve added support for data links and the ability to create arrows, enabling you to connect elements together to create more complex visualizations. To learn more, check out our canvas panel documentation.
Redesigned panels
Available in preview now in Grafana Cloud (Free, Pro, Advanced), and by using the newPanelChromeUI feature toggle in Grafana OSS and Grafana Enterprise.
Get ready to experience enhanced panels in your Grafana dashboard. We’ve made it easier for you to access and understand the status of each panel by adding and moving key elements. With our redesigned panels, you’ll find that the panel information architecture has been reimagined, giving you additional interaction points while reducing visual clutter. Plus, essential components are now included in each panel’s header, making locating and utilizing them easier. We’ve also made improvements to panels without a header and plan to make more updates to enhance accessibility. When you use the new panel design, you can create more accessible, streamlined dashboards that provide all the information you need at a glance.
Effortless navigation
The new navigation will gradually roll out to all users on Grafana Cloud in March. In Grafana OSS and Grafana Enterprise, you can enable this feature using the topnav and topNavCommandPalette feature toggles.
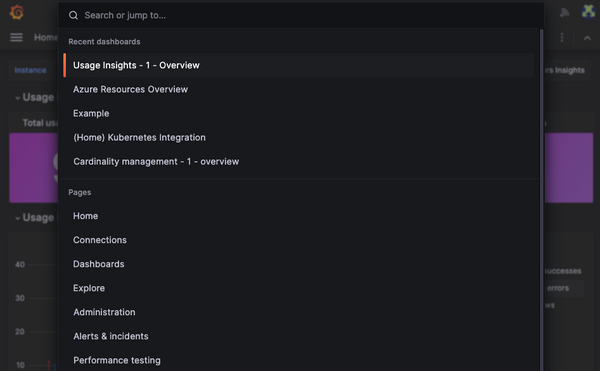
Grafana’s search and navigation have been improved, making it easier for you to move through the platform without taking your hands off the keyboard. Using the ctrl/cmd + K keyboard shortcut, the command palette lets you quickly search and access all pages and dashboards. Plus, the new navigation design with an improved structure makes it easier for you to access the data you need.

Connect your first data source from a dashboard or Explore
Available in Grafana OSS and Grafana Enterprise by using the datasourceOnboarding feature toggle.
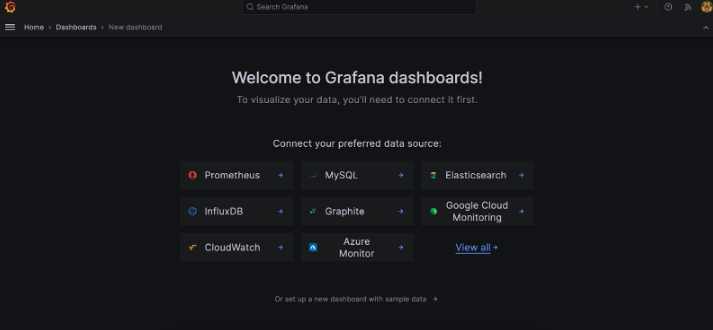
Get ready to dive into your data with ease: The new connection page in Dashboards and Explore will guide you through the initial setup. Whether you’re a new user or an administrator, selecting one of the most popular data sources or perusing the entire catalog of 300+ data sources in Grafana is just a click away. You can even continue without setting up a data source and use sample data instead.

Simplified and secure authentication
We’re excited to introduce several new authentication features in Grafana 9.4 to make your experience more secure and seamless. With this update, you can set expiration dates for your service accounts, enable automatic login for your SAML providers, and skip organization role synchronization with OAuth provider settings. Plus, you can also use OAuth provider-specific role mapping to bring in a whole new crew of users into Grafana without having to worry about messing up permissions. With these new features, you can rest easy knowing that your data and systems are more secure, and you can focus on the important work of analyzing and visualizing your data.
More control with Grafana Alerting
Generally available in Grafana OSS, Grafana Cloud (Free, Pro, Advanced) and Grafana Enterprise
In Grafana 9.4, you’ll experience better Grafana Alerting workflows that also make it easier to integrate with Grafana OnCall. The update brings enhanced alerting administration features, giving you more flexibility to search, view query definitions, and export alert rules for provisioning API or files. Now, you’ll be able to adjust the volume and resolution of data used in your alerting queries so that you can fine-tune the sensitivity of your alerts. Plus, you’ll have more search options so you can quickly find any alert you need. To learn more, refer to our Grafana Alerting documentation.

Get started with Grafana 9.4
Get ready to make the most out of your data with Grafana! With these updates, Grafana 9.4 provides a more user-friendly and efficient experience.
Download the latest version of Grafana 9.4 today or try it out on Grafana Cloud, which has a generous free forever tier and plans for every use case. Sign up for free today!
Refer to our Upgrade Grafana documentation for more information about upgrading your Grafana installation.
Thank you!
A big thanks to all the Grafana users who contributed by submitting PRs, bug reports, and feedback!


