Inside ObservabilityCon: 'I picked up so much practical information'
Jose Vicente Nunez works as a system administrator/DevOps/software developer at a fintech company. He is part of a team that manages a medium-complex trading application that requires multiple data sources (such as real-time and historical market data) and spans across several data centers with a complex mesh of servers and switches.
I’ve always been wary about vendor events. In my experience, many of them are mostly marketing pitches, with little or no content that is applicable to my use cases. Despite that, last year I decided to convince my manager to let me attend ObservabilityCON 2022 to see what I could learn from it. My hope was that I would be able to get practical knowledge that could be applied as soon as I got back to work. (Spoiler alert: I did!)
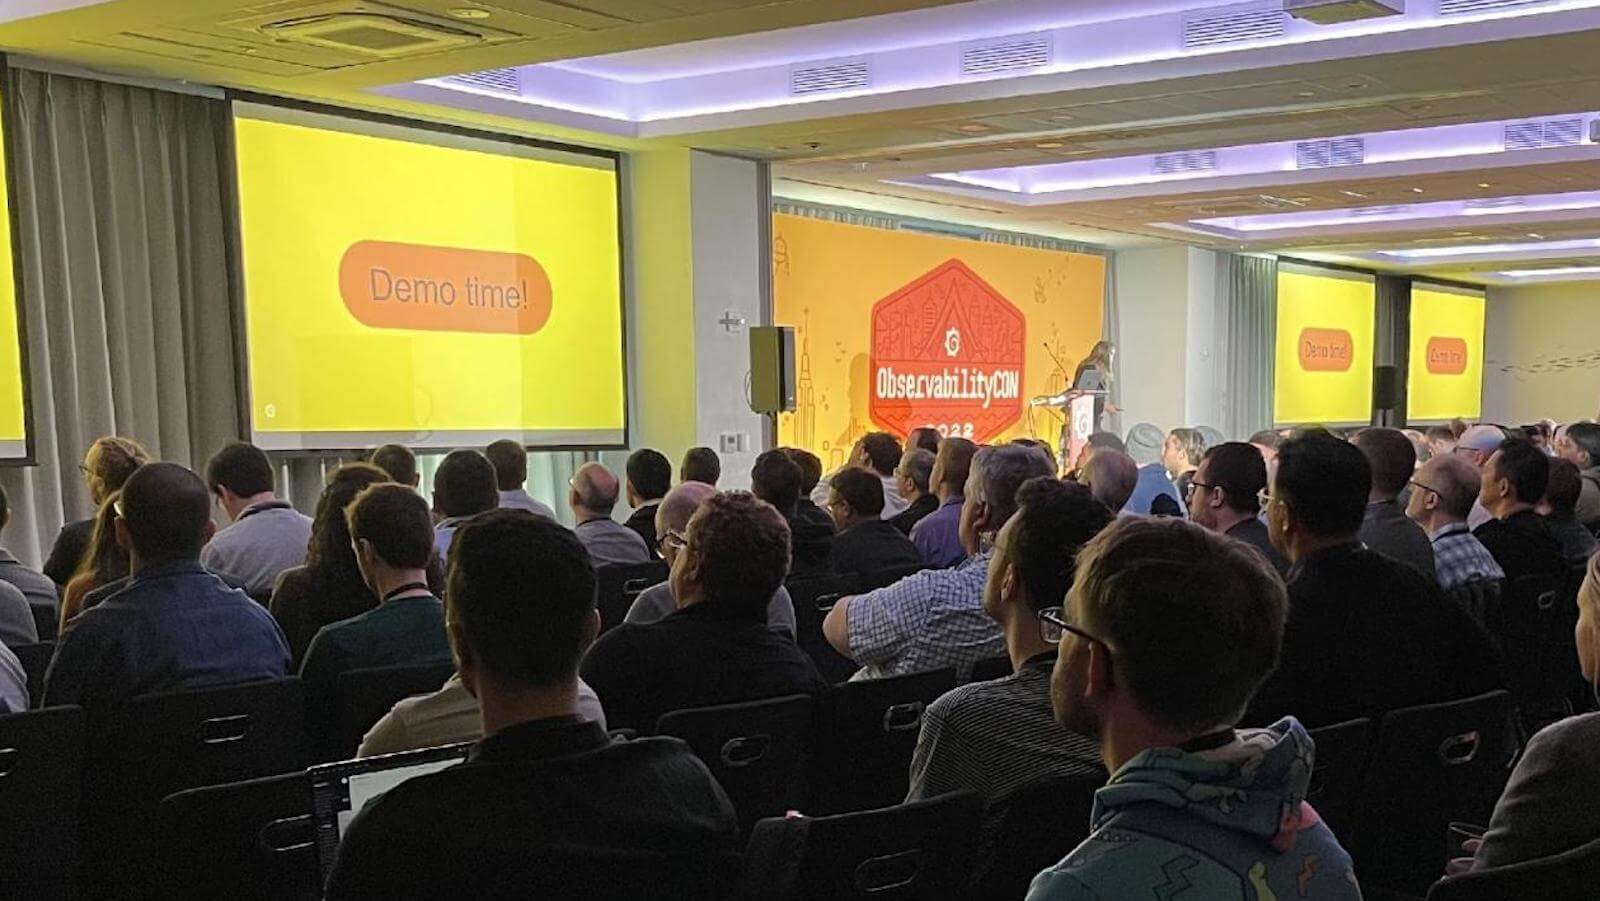
 by the Grafana Labs team.* An image from a presentation on Grafana Mimir, Grafana Loki, and Grafana Tempo at ObservabilityCON 2022](/media/blog/guest-post-obscon/photo-guest-post-obscon-nunez-LGTM-session.jpg)
My observability history
I’ve been on a journey to learn more about observability for a few years — I discovered Grafana around 2020 and have been using it ever since. At work, one of my responsibilities is to provide business and technology decision makers metrics about our infrastructure. If the infrastructure is not performing well, we lose our competitive advantage (or worse), so we need to know about small problems before they become big problems.
In order to monitor my infrastructure more efficiently, I automate almost everything that comes my way. My company has several open source tools, including Grafana, that are pretty good at collecting information and giving you a time series overview for specific components, like a switch or a server. With that data, I write utilization reports and alerts by leveraging the REST API offered by each one of the applications.
Things were good until I realized I was duplicating scripts and spending more and more time writing deployment code for the same tools that were supposed to automate my infrastructure monitoring. Getting other team members involved in the maintenance or improvement of the tools was time-consuming, and I also ended up writing more and more code to connect my alerts and reports to delivery mechanisms like email and chat services.
Once I found Grafana, the first thing I did was to try the integration with other data sources. I quickly discovered how easy it was to get all my data into a single place where I could leverage multiple presentation layers for other people on my team to see. Then I started using the alerting mechanism, and it won me over. Not only could I replace all my custom alerts, but I also could enrich them with other events and even deliver them to multiple destinations with little effort.
I’m not the only person at my company who has taken advantage of Grafana. My teammates on the business side also need to be able to ingest and analyze data so they can come up with the best strategies to keep us competitive. That requires multiple views of the same data, regression testing, and careful analysis, and Grafana has helped them do it all.
I stumbled on information about ObservabilityCON while I was reading tutorials and documentation about Grafana online and participating in an online forum about the product. I was excited about the possibility of talking in person with developers who contribute to the Grafana ecosystem, and other people in the industry who were also using it, to learn about the behavior of their infrastructure.
My trip to ObservabilityCON 2022

In 2022, ObservabilityCON took place in New York City and lasted two days. The first day was filled with optional workshops, and the second day featured the official conference presentations. I attended both days. It’s hard to summarize all the good stuff I got from the experience as many interactions were non-linear, but here are some of my highlights:
Pre-conference workshop

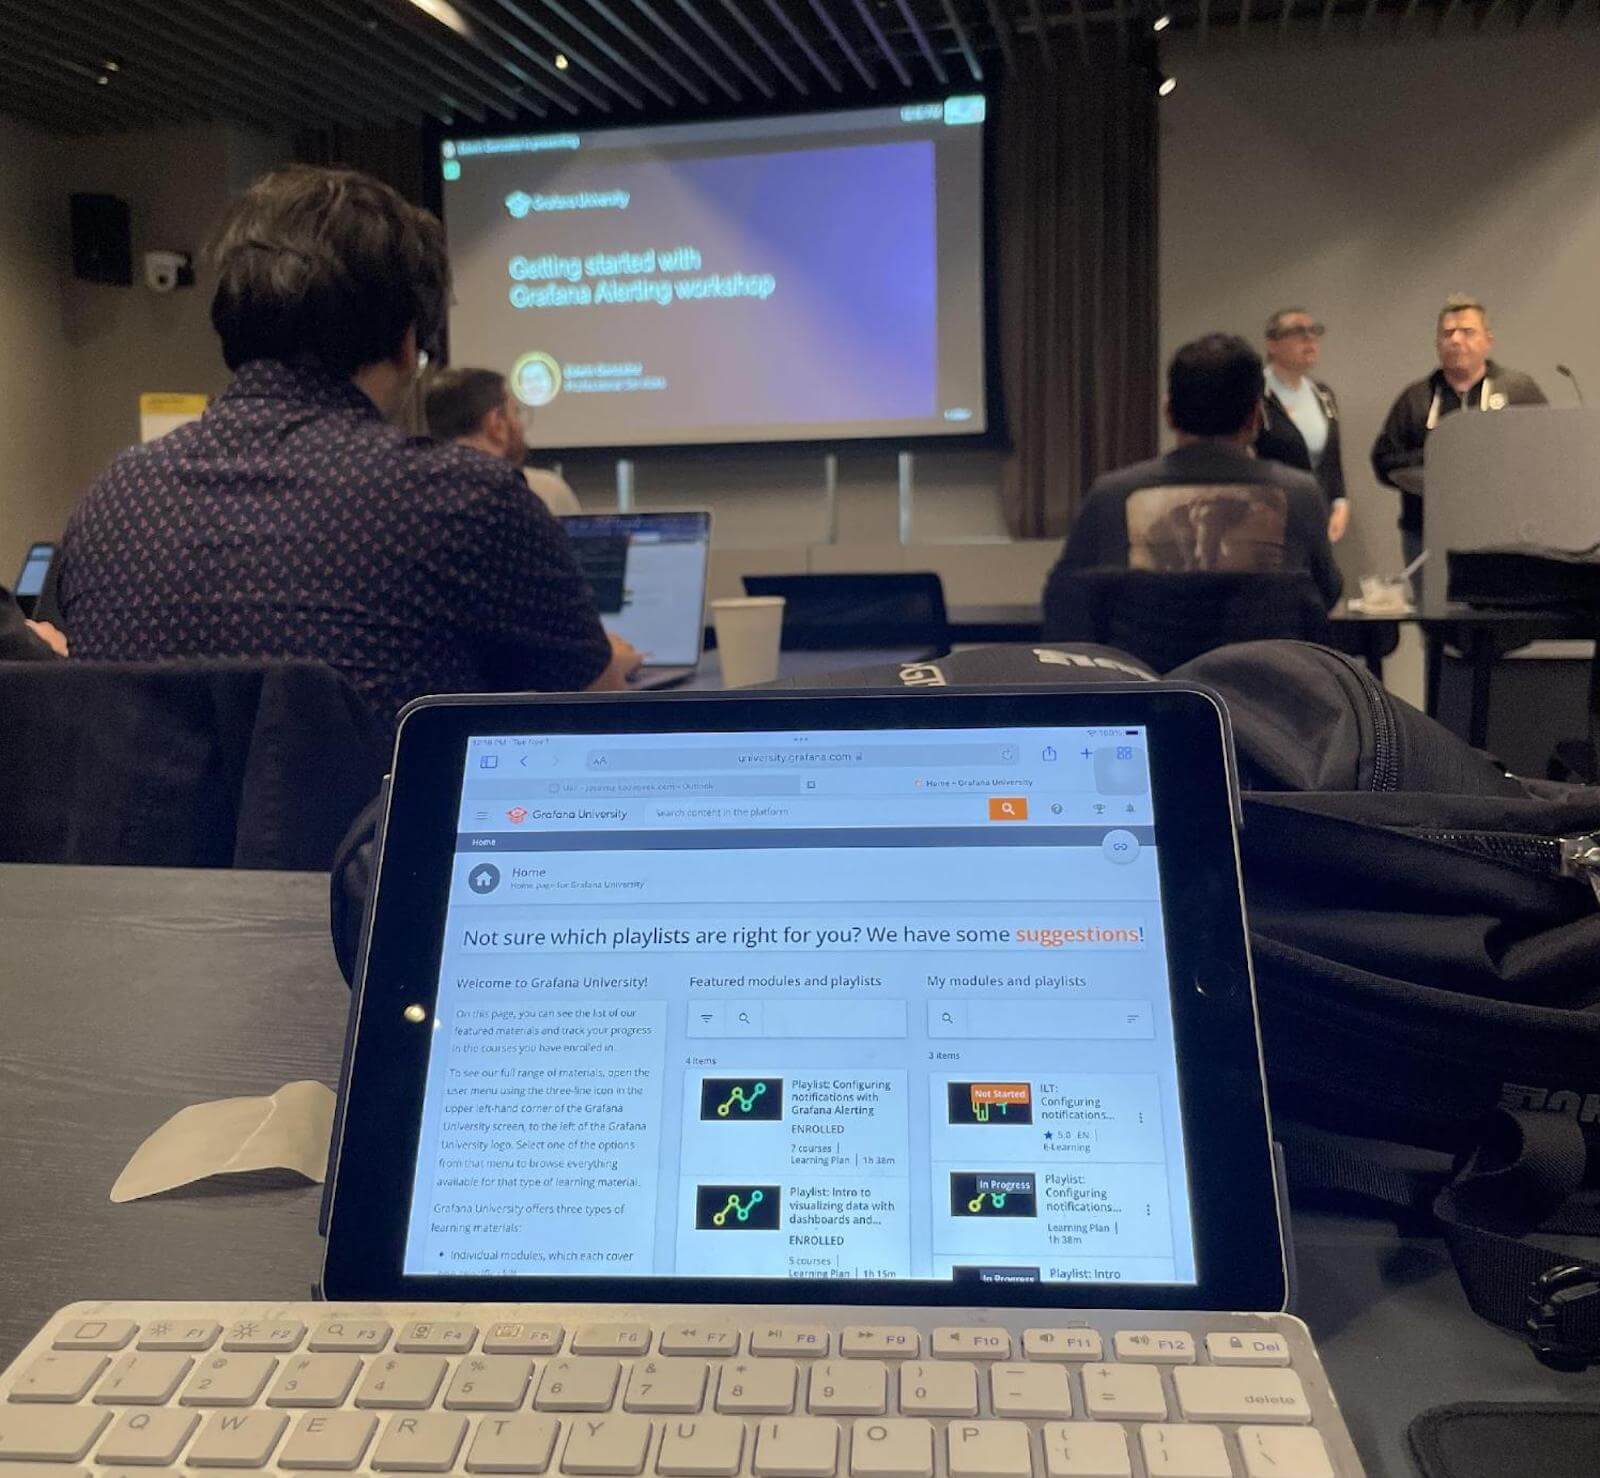
I attended the Introduction to Alerting workshop on Day One. It was very practical, with well-defined tasks to introduce us to the Grafana Alertingframework. It also covered topics such as scaling and alert optimizations techniques (like using Grafana Mimir). It was led by Edwin Gonzalez of Grafana Labs, who was very well-versed on everything and was able to provide us with additional information on topics not directly covered by the tutorial (like alerting templates in Go). I found this workshop very satisfying, and I was surprised we managed to cover a big chunk of material in so little time — usually, there is never enough time in a lab!
Customer presentations
. It had lots of practical examples, and the speakers were very honest about their journey.* An image from a Wells Fargo presentation about using Grafana at ObservabilityCON 2022](/media/blog/guest-post-obscon/photo-guest-post-obscon-nunez-wells-fargo-session.jpg)
The Day 2 sessions at ObservabilityCON were super useful. I liked seeing how other companies leveraged Grafana, especially in the same area where I do my work. I found that their journeys were similar to mine, and they gave me some ideas about where I could redirect future efforts. The presentations were pretty good, and the fact that Grafana made them available on demand afterward was a plus. It allowed my co-workers who didn’t attend the conference to see them, too.
Grafana Labs-led demos and live presentations
There were several sessions offered throughout the day, and I went to the ones I was interested in. They covered topics such as monitoring multiple services, scaling up, and making dashboards more useful and focused on the end users. I was able to ask questions not only during the demos, but also outside the presentations and during the labs. I picked up so much practical information about how to solve certain types of problems. The best part was being able to network and meet Grafana engineers. We’ve stayed in touch, and now I can message them if I have a technical question about a specific topic. In my opinion, that was the most valuable part of the conference — it was like accessing 1:1 coaching.
A special guest star

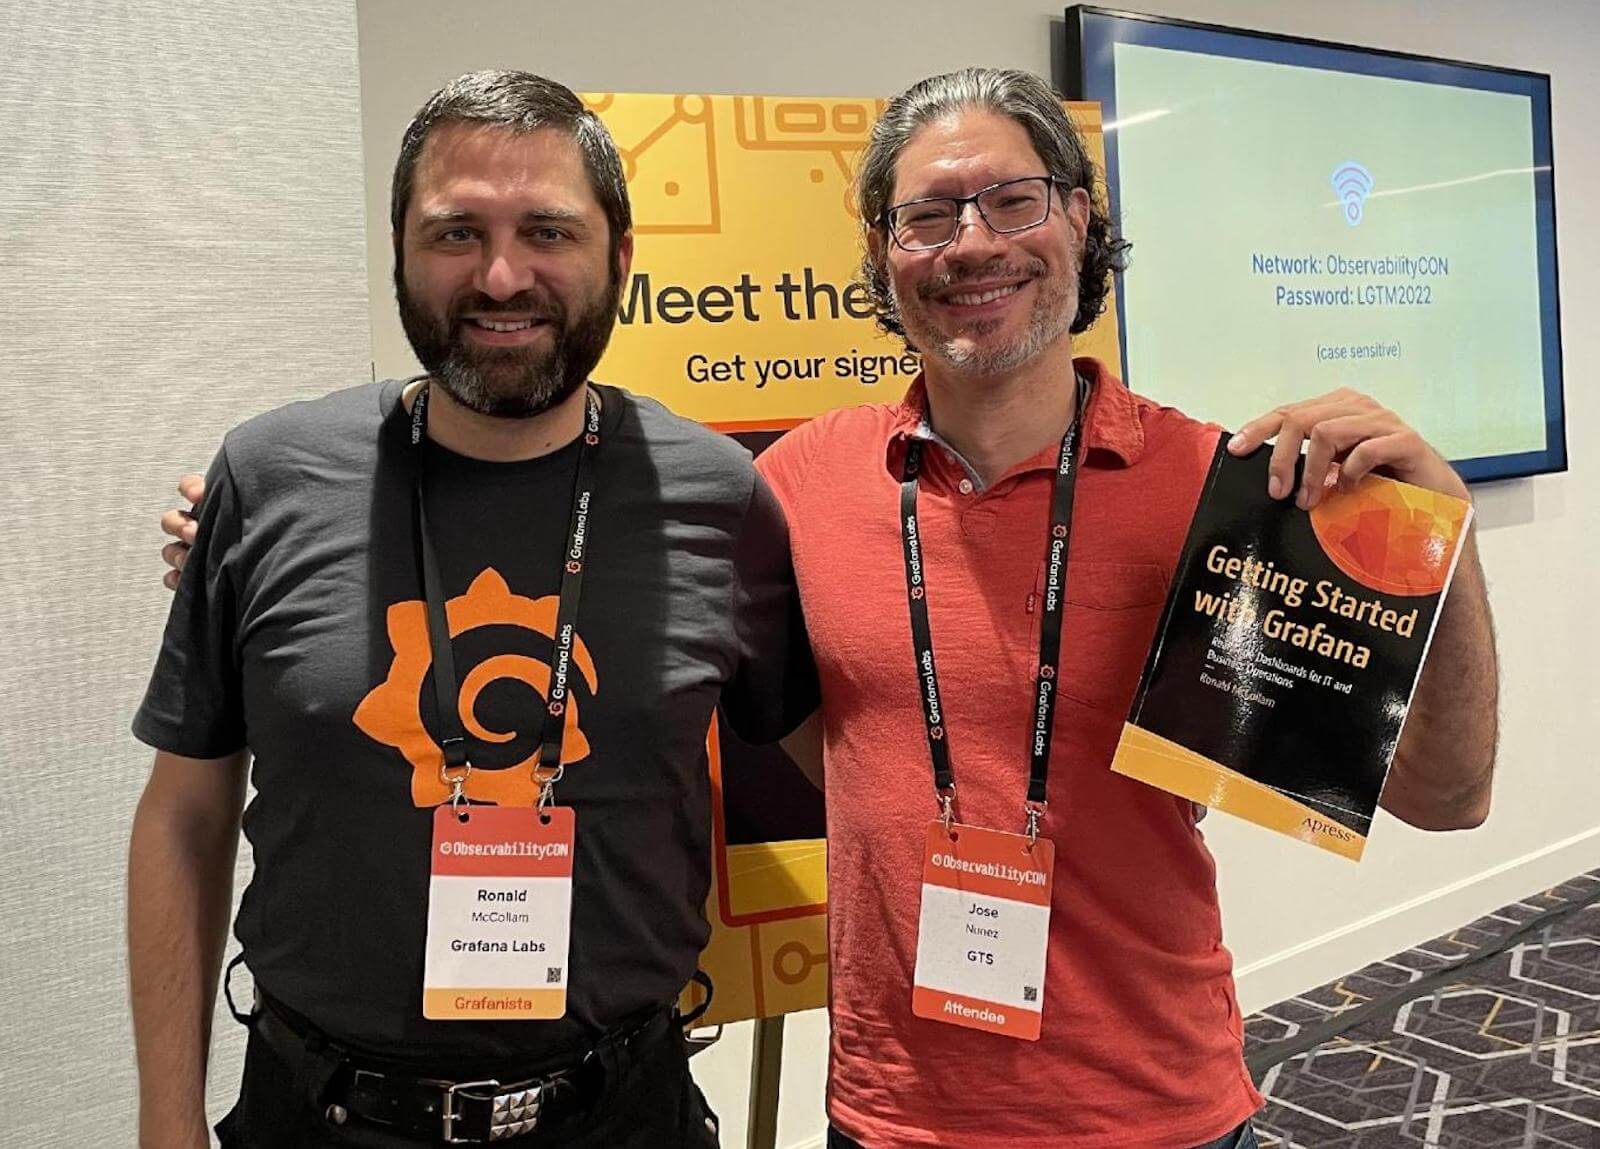
The cherry on top of the whole conference was being able to meet Grafana Labs solutions engineering manager Ronald McCollam, author of Getting Started with Grafana. He was there signing free copies of his book and also answering questions about the topics he covers in it. This was a nice surprise, and I hope Grafana brings more educational materials to future events.
My verdict
Attending ObservabilityCON turned out to be a smart decision. I enjoyed the conference a lot, and the content was relevant to me as a Grafana user. You could tell the Grafana Labs folks made an effort to make it an experience you can use to improve your practical skills while also getting a better idea about what to improve upon next. I would highly recommend attending an ObservabilityCON event if you can. As for me, I would definitely go again. Since I now know what’s offered, I could maximize my time even more at a future event.
We are bringing ObservabilityCON to a city near you! Learn more about ObservabilityCON on the Road, our series of live events that Grafana Labs will host around the world to bring together the open source observability community.


