How Grafana Labs unlocks the power of recruitment data with Grafana dashboards
As the recruitment team here at Grafana Labs, we used to struggle to get a comprehensive view of our recruitment data. We had multiple sources of information, but it was difficult to pool that information so we could see the big picture and identify trends and patterns that could help us hire the right talent in a highly competitive market.
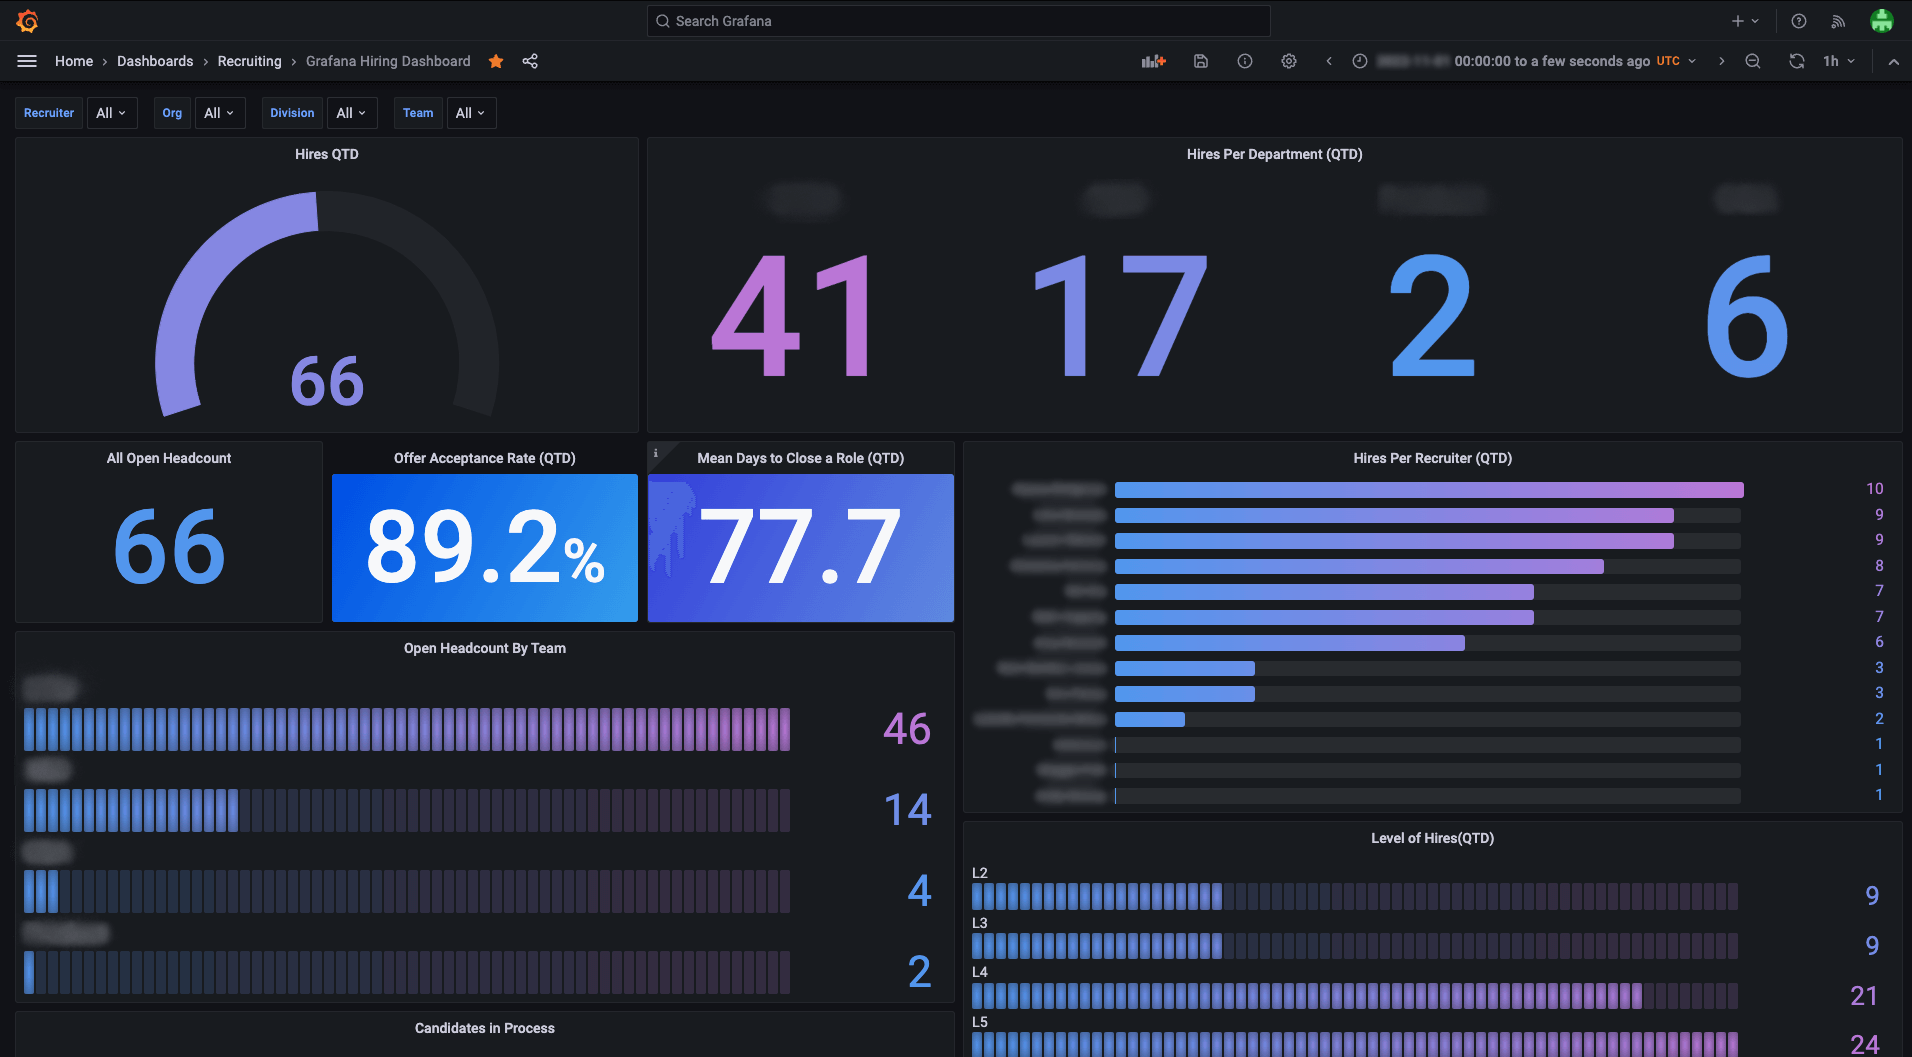
We also wanted to customize our data visualization so we could focus on the metrics that were most important to us, such as the number of hires per recruiter, the time it took to hire a candidate, and the acceptance rates for different levels and departments.
To solve these problems, we recently decided to build a recruitment data dashboard here at Grafana Labs. And what better way to do it than with Grafana? In this blog, we’ll dig into what we built and how it has helped us make more informed decisions and become more efficient in our recruitment process. And since we eventually plan to open source the dashboard framework, we hope other organizations can use this information to improve their own recruiting efforts.

Aggressive hiring goals and valuable recruitment insights
We needed to address multiple challenges when we set out to build the recruitment data dashboard. For starters, we had ambitious hiring goals — Grafana Labs is currently at 850 employees and growing, across more than 40 countries — that required us to be highly efficient and effective in our recruitment efforts. We also had to accommodate a talent team that had rapidly grown to 15 people, as well as all the hiring managers in the business, who would be using the dashboard to make data-driven decisions. We needed a way for all stakeholders to quickly and easily access that information.
We wanted a tool that would provide insights into the recruitment process. And even though we had accumulated all this valuable recruitment data, we lacked a comprehensive view because it was spread across multiple sources — manual trackers, SaaS-based platform Greenhouse Recruiting, and our internal data stored in Google BigQuery. This negatively impacted our work, as we were unable to make data-driven decisions or optimize our recruitment process.
And finally, we wanted to design the dashboard as an open source framework that other external talent teams could use to visualize data from Greenhouse and make better informed decisions.
Designing a Grafana dashboard for better recruitment
To build our recruitment data dashboard, we followed a defined process that involved several key steps. First, we put together a project plan that defined the scope of the project and the key success metrics we wanted to achieve. This included bringing in key stakeholders and subject matter experts to contribute to the plan and ensure that the dashboard met the needs of the recruitment team.
We worked closely with the data analytics team and IT here at Grafana Labs to build a powerful, user-friendly dashboard that combined several tools and technologies. They focused on building the custom queries that would be used to retrieve data, while we worked on defining the business logic for the queries.
Our primary source of data was our applicant tracking system, Greenhouse, which we used to track and manage all of our recruitment data. We also used BigQuery as our data store, where we pulled in data from Greenhouse and other sources.

And since we were working with personally identifiable information, we needed to ensure our data was secure in the data store. To solve this, the data analytics team and IT set up a new BigQuery data set with appropriate security protocols and permissions to ensure that only authorized users had access. We used Fivetran to extract the data from Greenhouse into this new, secured BigQuery data set. We then enriched and transformed the data with our standard data pipelines using dbt and Prefect.
Once we had secured and modeled the data, we used the Grafana BigQuery plugin to start visualizing the data in a Grafana dashboard. This allowed us to create custom queries and build interactive visualizations that helped us understand our recruitment data more clearly. And with the queries were set up, Grafana made it easy to create interactive visualizations and build the dashboard.
Open sourcing the dashboard and future improvements
All told, the process of getting the dashboards set up took a couple months. We started last June and had the initial version done by mid-July. Over the fall, we iterated on the business logic and visualizations to match our needs. In December, we launched the dashboards company-wide.
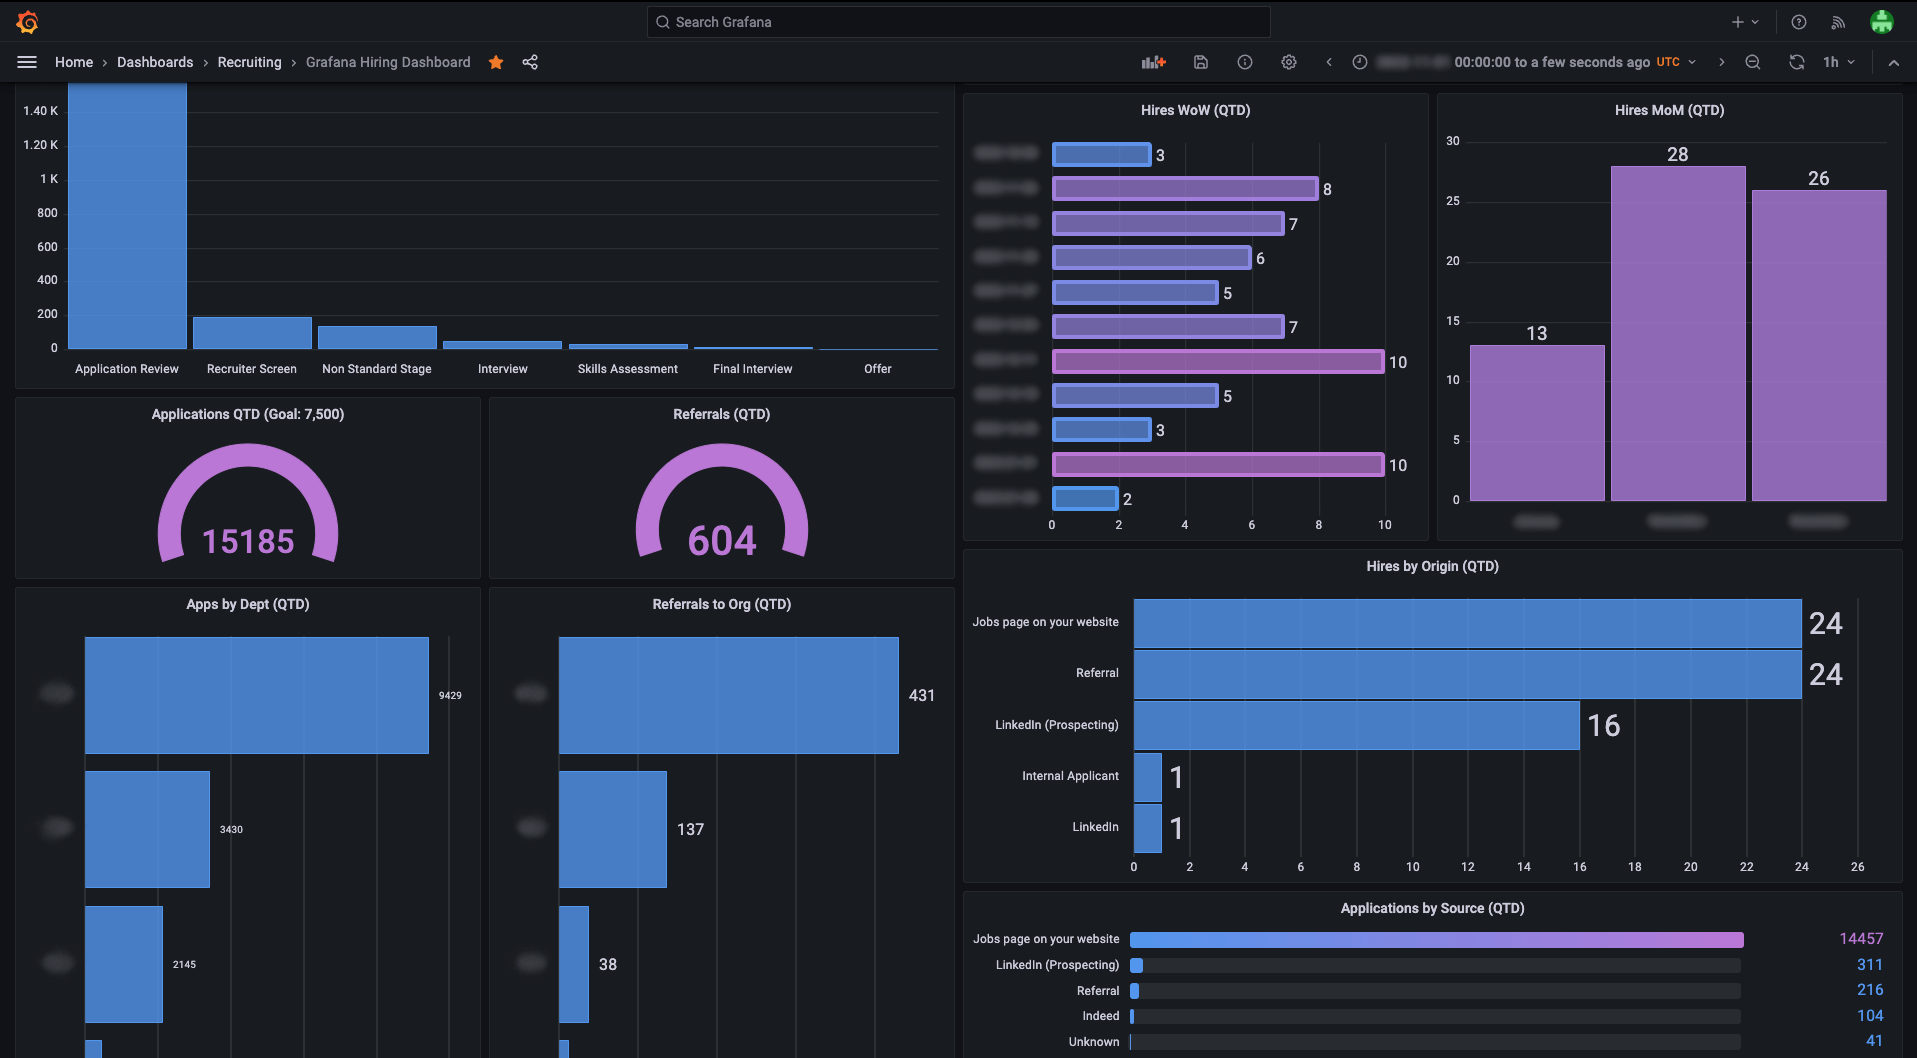
Today, we pull data from our applicant tracking system (Greenhouse) and our data store (BigQuery) and we use Grafana to create interactive visualizations. We track key metrics like hires, applicants, and referrals, and see how they changed over time. This helps us make more informed decisions and improve the efficiency of our recruitment process.
For example, we recently used the dashboards to correlate data by using the source and location of hires. We then looked at trends to identify how we can drive location-specific hiring for our GTM department. We also saw positive impacts when we used the dashboard to monitor changes in acceptance rates after running a new workshop on negotiations and objection handling with our talent and people teams.

Looking to the future, we plan to expand and improve the dashboard. We are particularly interested in applying machine learning and artificial intelligence techniques to analyze our data and make more accurate forecasts and predictions. For example, we want to use the dashboard to forecast application volumes and hire rates so we can identify potential bottlenecks or areas of opportunity in our recruitment process.
We also plan to incorporate job planning scorecards into the dashboard to help us understand the metrics that are most important to our success. This will involve working with our stakeholders and subject matter experts to define the appropriate metrics and develop custom queries that will allow us to track them over time.
Finally, we plan to open source the dashboard so other teams facing similar challenges can use it as a starting point for building their own data dashboards. By sharing our work and experiences with the community, we hope to help others benefit from the insights and improvements we have made to our recruitment process.
Learn more about the Grafana Labs team and our remote-first culture, and find out how you can become an official Grafanista by visiting our careers page.


