Watch: 5 tips for improving Grafana Loki query performance
Grafana Loki is designed to be cost effective and easy to operate for DevOps and SRE teams, but running queries in Loki can be confusing for those who are new to it.
Loki is a horizontally scalable, highly available, multi-tenant log aggregation system inspired by Prometheus. It doesn’t index the content of the logs, but rather a set of labels for each log stream. This requires a different approach to queries, but don’t worry — it’s very easy to get going with powerful, performant queries.
In this blog post, we’ll go over five tips you can use to improve your query performance in Loki.
5 ways to improve Loki query performance
If you want additional background on how Loki differs from full-text index solutions, watch this video on Loki query basics. You can also read the documentation for LogQL, the querying language used in Loki.
Let’s look at some easy ways to get insights from your log data even faster. As you’ll see, there’s an overarching theme to these tips — reduce and refine your searches as much as possible.
1. Label or log stream selectors
The first and most important way to improve Loki query performance is with the label or log stream selector. Think of labels as metadata for log streams. They’re key-value pairs that define a stream in Loki, and if a label value changes, it creates a new stream. In Prometheus, these are called series, but Loki is simpler in comparison since it doesn’t have the additional metric-name dimension.
So, when you narrow down your label selector, it reduces the size of the log volume Loki has to search, which translates to faster queries. For example, instead of using a wildcard label selector, use a precise label selector. In the screenshot below, you see that we’ve selected the application, environment, and component, which will search a much more narrow data set than a query of every log associated with that application.

2. Line Filters
Line filter expressions are another great way to accelerate queries by cutting back on the data that’s being analyzed. Filters work by performing a distributed grep over the logs from matching streams, discarding those that don’t match the filter expression. This should be done immediately after you’ve entered any label selectors to help narrow down to the most relevant data from selected streams.
In the below example, after searching for logs from the myapp application in the `prod` environment, we filter for lines that contain the string “/api/”, and then for lines that contain “requests”:

As much as possible, avoid regex in your filters. While it will give you more precise results, it will have a negative impact on performance as regex filters are a bit less performant than simple substring matching. In the screenshot above, we used a less greedy, non-regex filter ( │= “/api/” │= “requests”) that will return results faster than the alternative.
Finally, note that like in this example, filter operators can be chained, and are applied sequentially.
3. Time range selection
If you’re familiar with Grafana, you understand the importance of selecting the appropriate time range for your visualization with the time picker. Well, the same principle applies to Grafana Loki queries. While you may ultimately need to go back days, you’re better off starting small. If, for example, you were to select a one-hour time range, it would need to process far less data than if you selected a 24-hour time range.

These smaller intervals make it easier to iterate and refine your query. From there, you can expand your time frame to get the full results you need. Plus, as you use this feature more frequently, you’ll notice recently used intervals will start to auto populate the dropdown menu for easier selections in the future.
4. Parsers
LogQL Parsers are used to extract structured fields from unstructured log lines. Loki currently supports four types of parsers, which are listed here in order from fastest to slowest: pattern, logfmt, JSON, and regex.
Make sure to filter results to get the most performance out of parsing, as this reduces the amount of logs that have to be queried; filtering before parsing will always be more performant than the other way around! After parsing, you typically have one or more equality operators. Depending on the use case, this can also be a filter to improve performance.

5. Recording rules
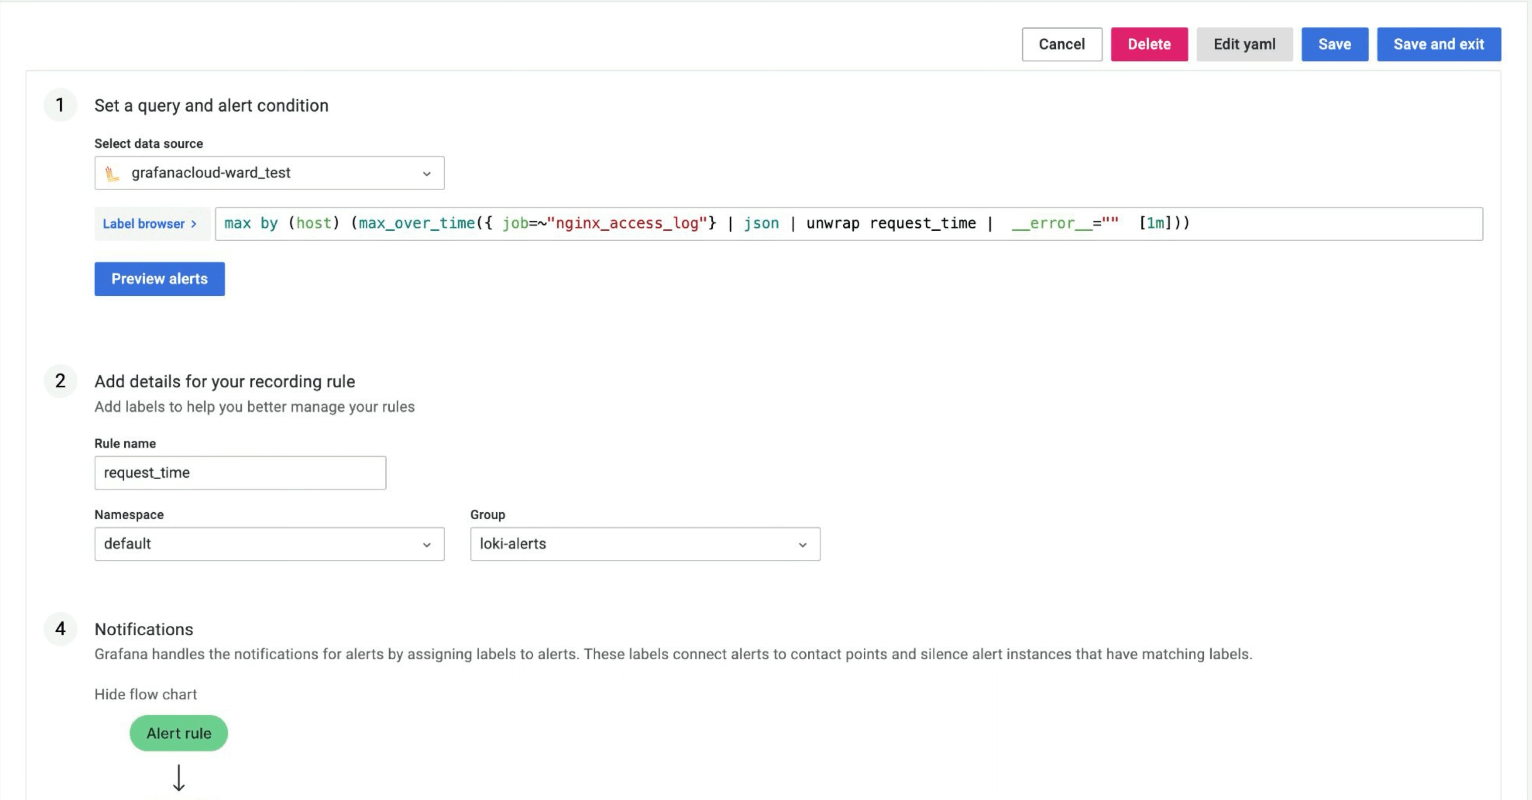
To improve the performance of your Loki queries in Grafana, we recommend using a recording rule for frequently used metrics. This could include metrics in your dashboards or those that process a lot of data.

The rules will be stored in a Prometheus-compatible backend, like Grafana Mimir or any other preferred repository. This will help save money because it’s more efficient for long-range queries.
Grafana Cloud is the easiest way to get started with metrics, logs, traces, and dashboards. We have a generous free forever tier and plans for every use case. Sign up for free now!
If you’re not already using Grafana Cloud — the easiest way to get started with observability — sign up now for a free 14-day trial of Grafana Cloud Pro, with unlimited metrics, logs, traces, and users, long-term retention, and access to one Enterprise plugin.


