How to monitor Kubernetes with Grafana and Prometheus: Inside Powder’s observability stack
David Calvert is a site reliability engineer working remotely from the south of France. He’s currently focused on observability, reliability, and security aspects of cloud infrastructure. You can find him as dotdc on GitHub and @0xDC_ on Twitter.
Over the past three years, I’ve built and operated Kubernetes clusters for two different companies — the first one on-premises, and the second on a public cloud platform for my current job at Powder. To fulfill this task and to make my day-to-day operations easier, I started working on a set of Grafana dashboards for Kubernetes monitoring that embedded everything I learned on these systems.
In this blog post, I’ll describe how we use Grafana dashboards as part of an open source Kubernetes monitoring solution that helps us track and adapt our resources as needed.
Our Kubernetes monitoring use case
I’m a DevOps Engineer at Powder, an AI-powered gaming platform that automatically saves highlights from your favorite games and allows you to win real rewards as you play. To serve the needs of this gaming clips platform, we rely on Amazon Elastic Kubernetes Service (EKS), among other cloud services, to host our platform applications.
When it comes to Kubernetes monitoring, Prometheus has been the go-to open source solution for a long time. It was even the second CNCF project to graduate, just after Kubernetes itself. To deploy Prometheus, we decided to use kube-prometheus-stack because our team was already familiar with this Helm Chart that embeds Prometheus, Prometheus Operator, Grafana, Alertmanager, and a lot of built-in defaults. We also use Promtail and Grafana Loki to collect all our infrastructure and application logs, before storing them in Amazon S3.
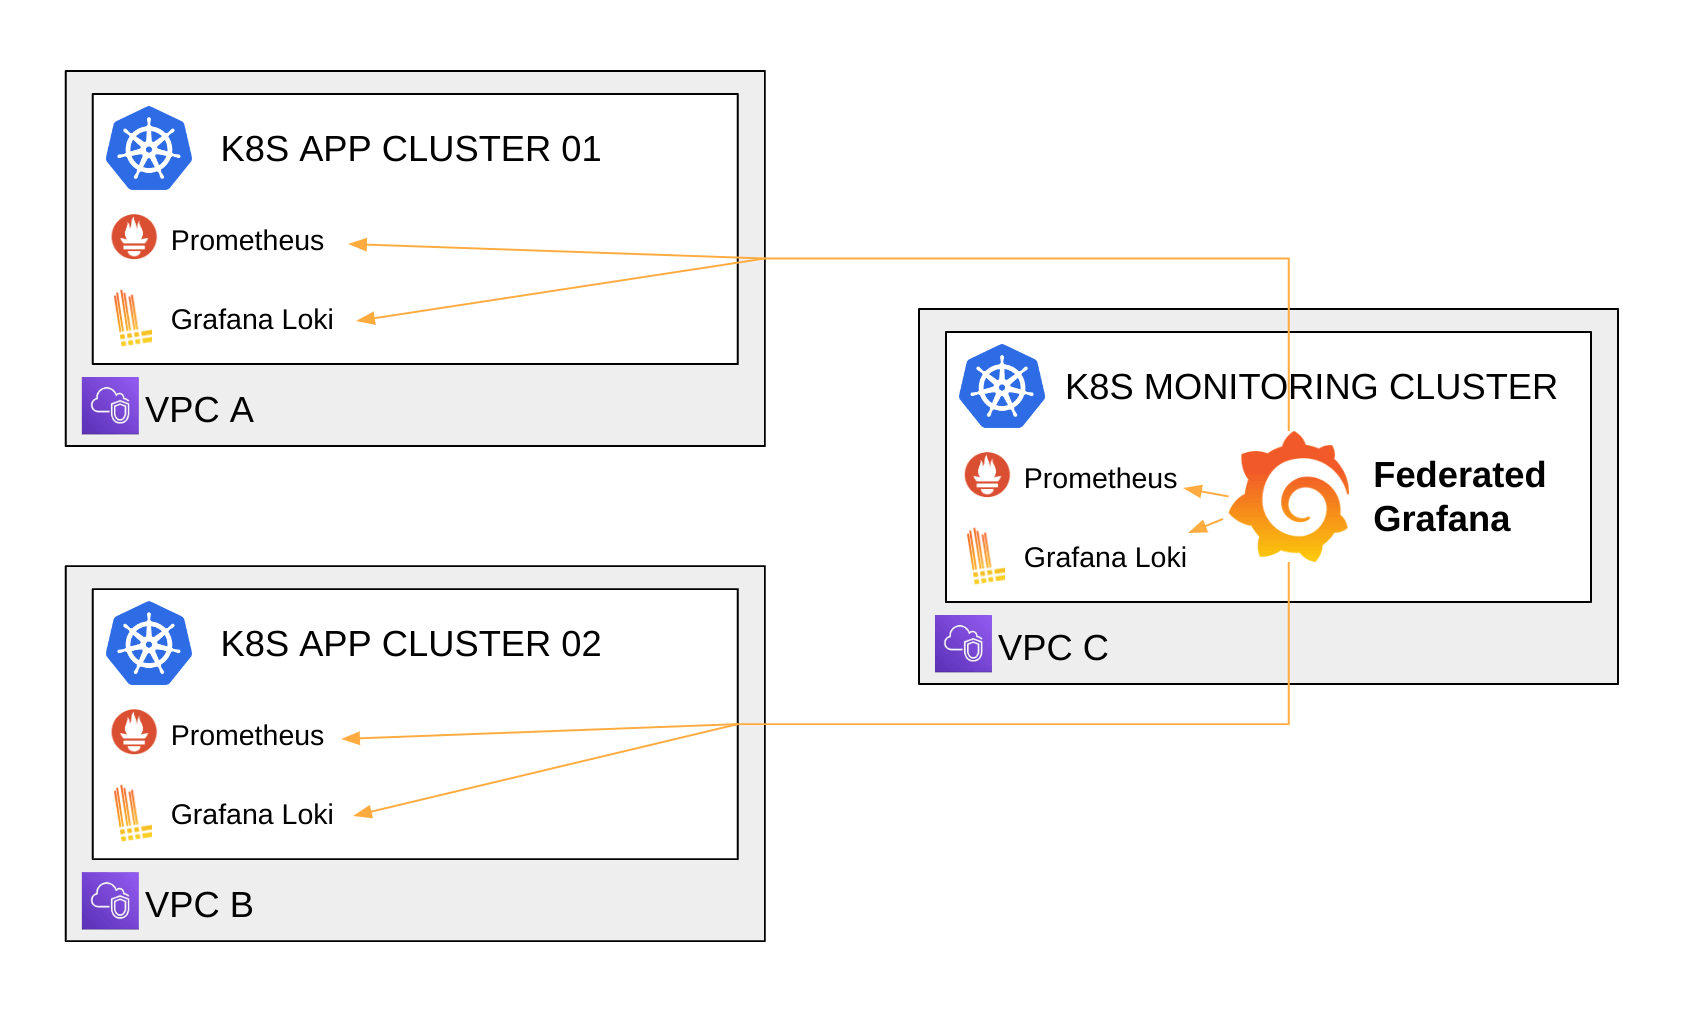
We manage several Kubernetes clusters, but for convenience, we are using a single federated Grafana instance that queries all our clusters using AWS’ VPC peering. Grafana makes it easy for us to gather and visualize all our metrics in a single place. For each cluster, we have two Grafana data sources — one for the Prometheus metrics, and one for the logs from Grafana Loki. Our technical squads use this Grafana instance to develop, test, and operate our technical stack. This includes part of our cloud infrastructure that relies on Amazon CloudWatch metrics, but our main components remain applications running on Kubernetes.

Because Kubernetes was at the core of our infrastructure, I installed the dashboards from dotdc/grafana-dashboards-kubernetes, my own open source project, because I was already familiar with them and I knew they would be a good addition to kube-prometheus-stack’s Grafana dashboards already in place.
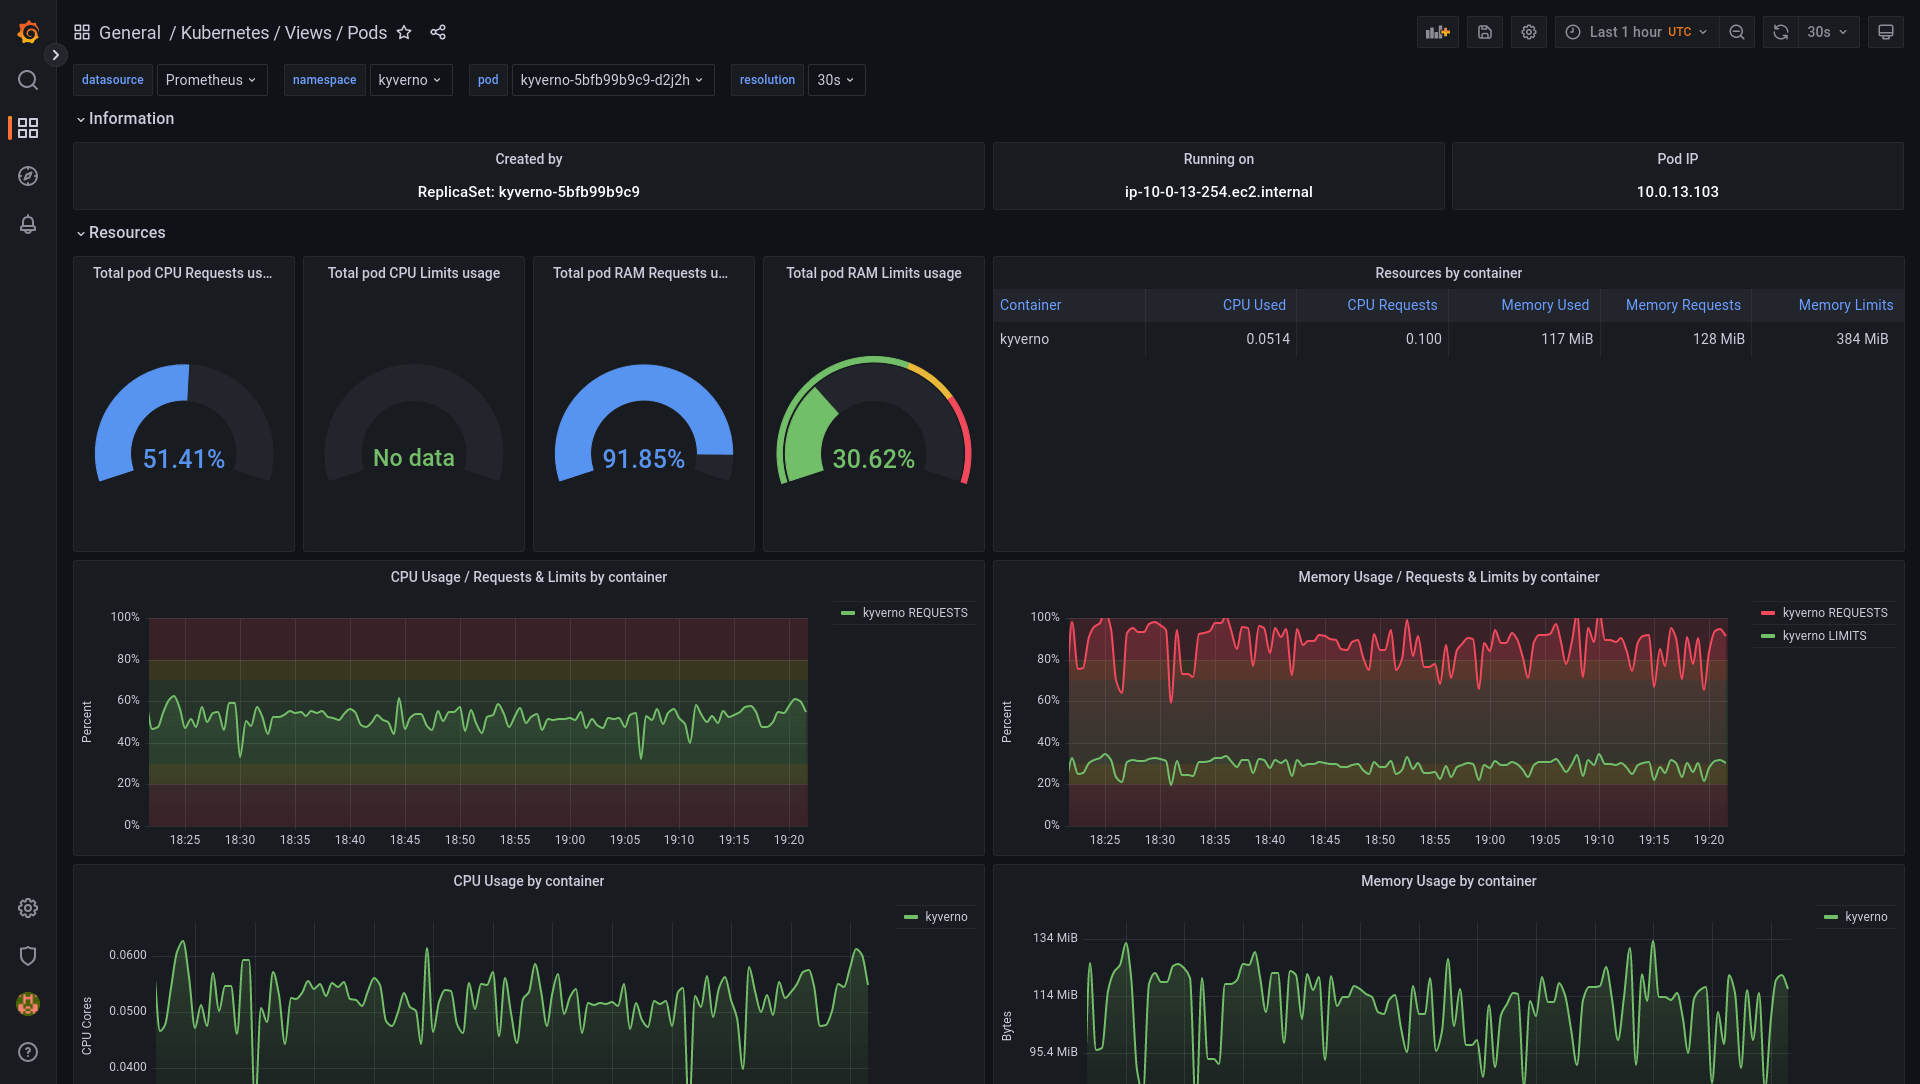
Our teams started using them, and based on their feedback, we contributed back all the changes that would benefit users of this project. During the same time period, I also worked on the side to implement other features and ideas that I thought could be useful to the project. For example, I worked with Richard Durso, a project contributor, on his ideas to make it easier to do container and pod sizing using Kubernetes requests and limits on the “pods” dashboard in this issue. I was also inspired by online resources like Grafana’s webinar “Getting started with Grafana dashboard design,” which I recommend to everyone building Grafana dashboards.
Getting the open source community involved
Despite the work that went into building the dotdc/grafana-dashboards-kubernetes, it hadn’t gained much attention, in part, because I hadn’t done much to promote it. So last June I decided to write an article about it, titled “A set of modern Grafana dashboards for Kubernetes.” I wanted to share my work with the community, and the blog post helped the project gain a lot more attention. People from all around the world started using the dashboards, and some of them came back with more fixes and enhancements for the project.

Here’s the list of changes since the original article:
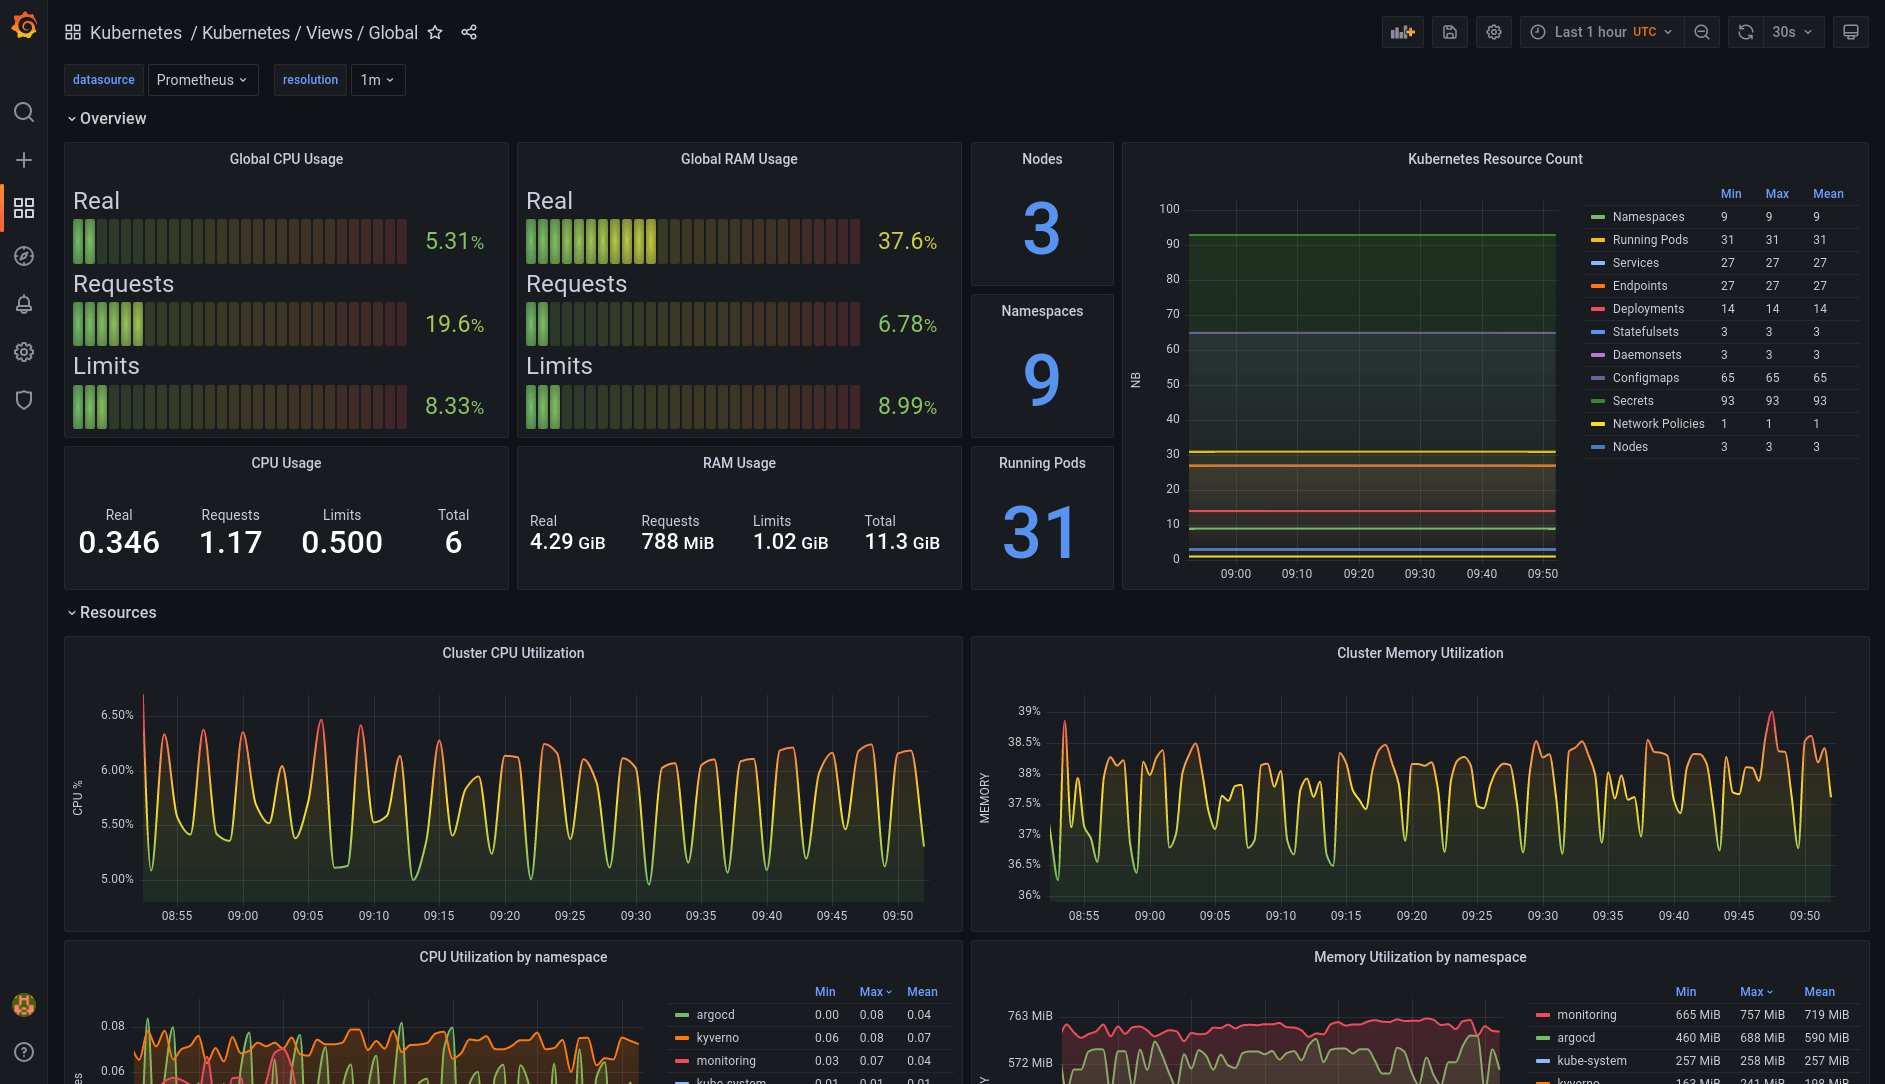
- Updated the global view to show real, requests and limits resource usage
- The pods view has been re-imagined to ease container resource sizing (requests, limits)
- Dashboards can now be deployed as an ArgoCD application, on top of the existing installation methods
- Data links between the nodes dashboard and the pods dashboard
- Fixed display errors when using the Grafana light theme
- Various other fixes and enhancements
These were made possible thanks to the project contributors: reefland, mashun4ek, kongfei605, vladimir-babichev, SuperQ, miracle2k, k1rk, William-LP, clementnuss, germetist, and geekofalltrades.

Moving toward the Grafana LGTM Stack
Using Grafana has become a daily habit for us. It allows us to understand and fine tune both our applications and our infrastructure. The community around Grafana is huge and very active on Slack and GitHub, which comes in handy when we need help!
Going further, we are migrating from OpenTracing to OpenTelemetry, and we’re switching from Jaeger to Grafana Tempo at the same time. This will allow us to take another step forward towards using the entire Grafana LGTM Stack and ensure our three pillars of observability are well integrated together.
PS: Thanks the Grafana Customer and Community Marketing team for the opportunity to share this story on the Grafana blog.
If you’re interested in monitoring your Kubernetes clusters but don’t want to do it all on your own, we offer Kubernetes Monitoring in Grafana Cloud — the full solution for all levels of Kubernetes usage that gives you out-of-the-box access to your Kubernetes infrastructure’s metrics, logs, and Kubernetes events as well as prebuilt dashboards and alerts. Kubernetes Monitoring is available to all Grafana Cloud users, including those in our generous free tier. If you don’t already have a Grafana Cloud account, you can sign up for a free account today!


