How to use the Grafana Ansible collection to manage Grafana Agent across multiple Linux hosts
Anyone who is trying to set up monitoring for multiple machines knows how tough it can get to manage multiple Grafana Agents across them. To make things easier, we recently added the Grafana Agent role to the Grafana Ansible collection, which will help users manage the Agent across multiple Linux hosts.
(Need to know how to get started with the Grafana Ansible collection for Grafana Cloud? Check out my previous blog post.)
In this tutorial, I will walk through how you can use the grafana_agent Ansible role to simultaneously deploy and manage Grafana Agents across eight Linux hosts and eventually monitor them using Grafana Cloud.
Prerequisites
- A Grafana Cloud account (If you don’t already have one, you can sign up for free today!)
- Linux hosts
- SSH access to the Linux hosts
- Account permissions sufficient to install and use the Grafana Agent on the Linux hosts
Installing the Grafana Ansible collection
The Grafana Agent role is available in the Grafana Ansible collection as part of the 1.1.0 release.
To Install the Grafana Ansible collection, run this command:
ansible-galaxy collection install grafana.grafana:1.1.0Test environment
For this tutorial, I am using eight Linux hosts, which have two Ubuntu hosts, two CentOS hosts, two Fedora hosts, and two Debian hosts. I have also added my Public SSH Keys to these hosts during the creation.
My Ansible inventory, which resides in a file named inventory, looks like this:
146.190.208.216    # hostname = ubuntu-01
146.190.208.190    # hostname = ubuntu-02
137.184.155.128    # hostname = centos-01
146.190.216.129    # hostname = centos-02
198.199.82.174     # hostname = debian-01
198.199.77.93      # hostname = debian-02
143.198.182.156    # hostname = fedora-01
143.244.174.246 # hostname = fedora-02Note: If you are copying the above file, remove the comments (#).
I also have an ansible.cfg within the same directory as inventory, which looks like this:
[defaults]
inventory = inventory  # Path to the inventory file
private_key_file = ~/.ssh/id_rsa   # Path to my private SSH Key
remote_user=root
Installing the Linux Node integration for Grafana Cloud
I am going to use the Linux Node integration and leverage the prebuilt Grafana dashboards that are included. Using an integration is completely optional. Here’s how to get the dashboards:
- In your Grafana Cloud instance, click Integrations and Connections (lightning bolt icon), then search for or navigate to the Linux Server tile.
- Click the Linux Server tile and click Install Integration.
- You should now see the prebuilt dashboards.
Configuring the Grafana Agent
In this example, I will be using an agent configuration similar to the one provided by the Linux integration, but with a few changes.
Create a file named agent-config.yml within the same directory as ansible.cfg and inventory and add the configuration below.
logs:
 configs:
   - name: default
     clients:
       - basic_auth:
           password: <Grafana.com API Key>
           username: <Logs User ID>
         url:  https://<Loki URL>/loki/api/v1/push
     positions:
       filename: /tmp/positions.yaml
     target_config:
       sync_period: 10s
     scrape_configs:
       - job_name: varlogs
         static_configs:
           - targets: [localhost]
             labels:
               instance: ${HOSTNAME:-default}
               job: varlogs
               __path__: /var/log/*log

metrics:
 configs:
   - name: integrations
     remote_write:
       - basic_auth:
           password: <Grafana.com API Key>
           username: <metrics User ID>
         url: https://<Prometheus URL>/api/prom/push
 global:
   scrape_interval: 60s
 wal_directory: /tmp/grafana-agent-wal

integrations:
 node_exporter:
     enabled: true
     instance: ${HOSTNAME:-default}
 prometheus_remote_write:
   - basic_auth:
       password: <Grafana.com API Key>
       username: <metrics User ID>
     url: https://<Prometheus URL>/api/prom/push
You can see the label instance has been set to the value ${HOSTNAME:-default}, which is substituted by the value of HOSTNAME environment variable in the Linux host. To read more about the variable substitution, refer to the Grafana Agent documentation.
Make sure that the instance labels match for logs and metrics. This ensures that you can quickly dive from metrics graphs to corresponding logs for more details on what actually happened during an incident.
In the example I’m using here, we are directly scraping the systemd journal and log files as described in the Linux integration documentation.
Using the Grafana Agent Ansible role
Create a file named deploy-agent.yml in the same directory as ansible.cfg and inventory and add the configuration below.
- name: Install Grafana Agent
  hosts: all

  tasks:
   - name: Install Grafana Agent
     ansible.builtin.include_role:
       name: grafana.grafana.grafana_agent
     vars:
       agent_config_local_path: agent-config.yml
       systemd_config: |
         [Unit]
         Description=Grafana Agent
         [Service]
         User=grafana-agent
         Environment=HOSTNAME=%H
         ExecStart={{ agent_binary_location }}/agent-{{ linux_architecture }} -config.expand-env -config.file={{ agent_config_location }}/agent-config.yaml
         Restart=always
         [Install]
         WantedBy=multi-user.target
This Ansible playbook calls the grafana_agent role from grafana.grafana ansible collection. We are also passing two variables: One is agent_config_local_path, which is set to the path where the agent configuration resides on local. The second is systemd_config, which has the systemd service configuration for Grafana Agent.
Refer to the Grafana Ansible documentation to understand the other variables that can be passed to the grafana_agent role.
To run the playbook, run this command:
ansible-playbook deploy-agent.ymlNote: deploy-agent.yml, agent-config, ansible.cfg and inventory can also be placed in different directories per your needs.
Checking that logs and metrics are being ingested into Grafana Cloud
Logs and metrics should soon become available in Grafana Cloud. To test this, use the Explore feature. Click the Explore icon (it looks like a compass) in the vertical navigation bar.
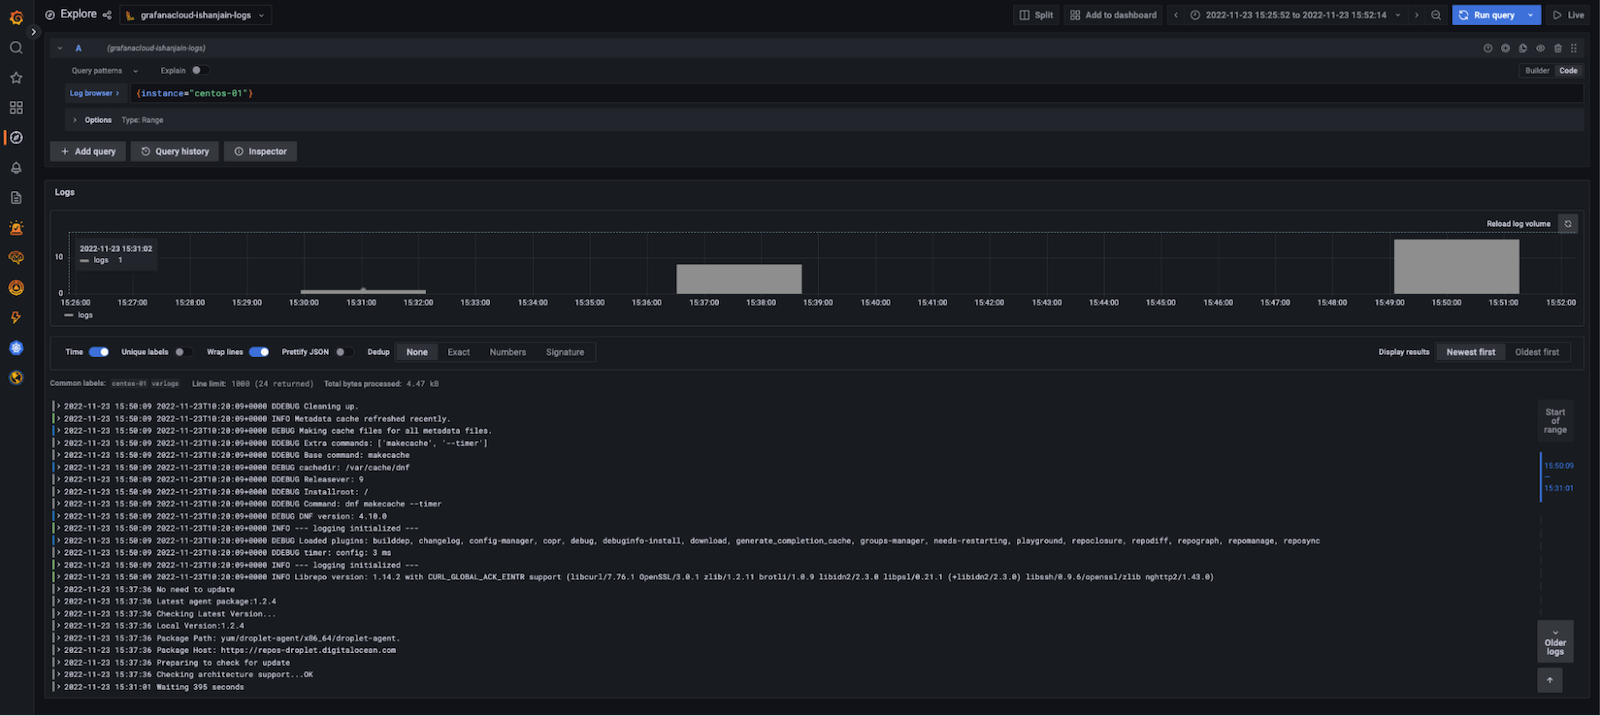
To check logs, use the dropdown menu at the top of the page to select your Loki logs data source. In the log browser, run the query {instance="centos-01"} where centos-01 is the hostname of one of the Linux hosts.
If no log lines appear, logs are not being collected. If you do see log lines (example below), that confirms logs are being received.

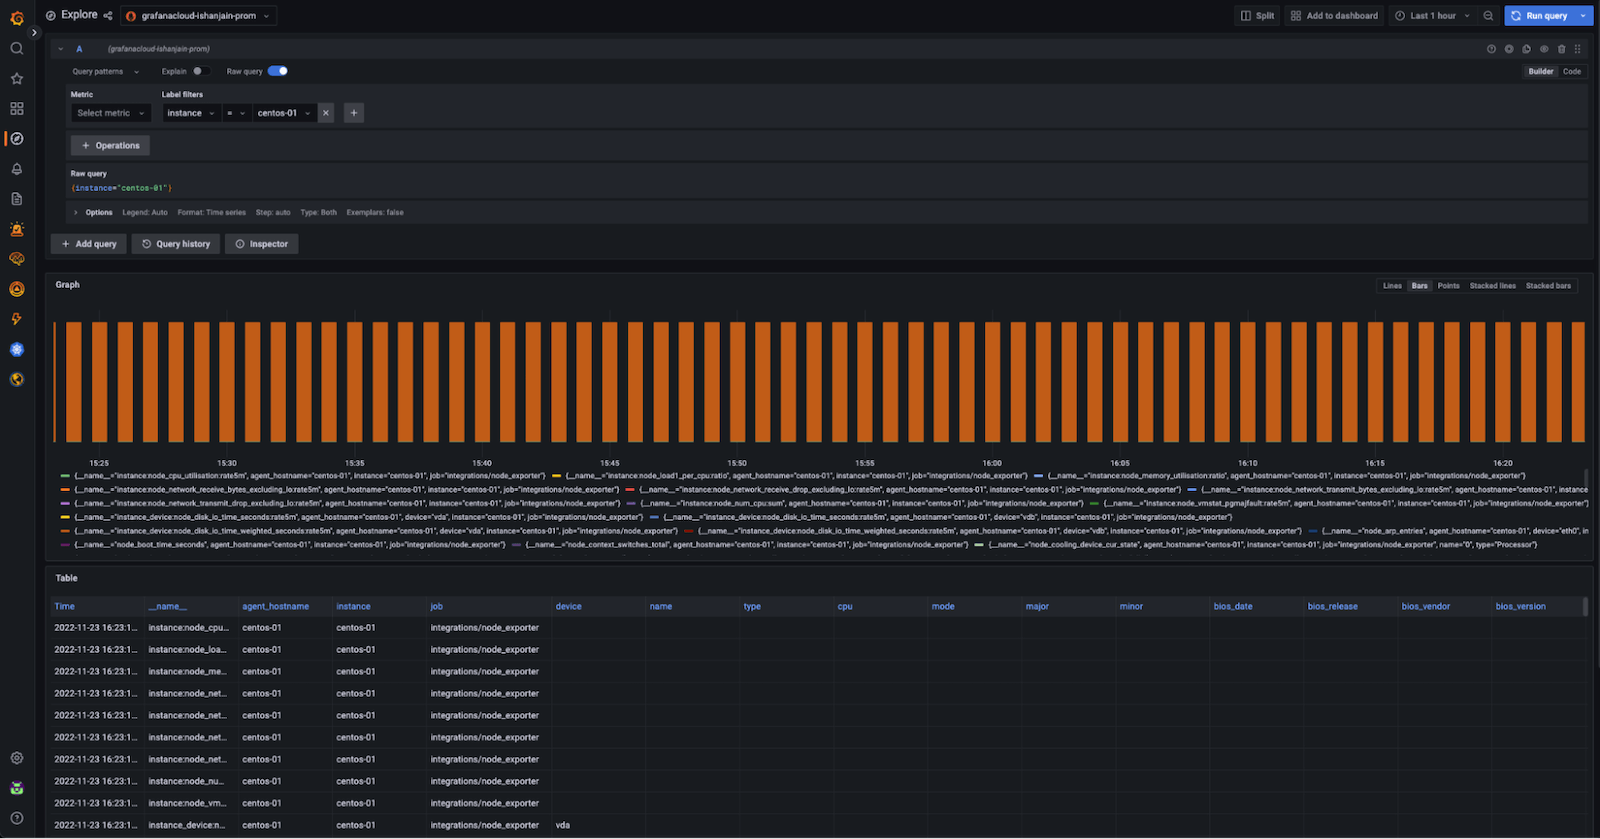
To check metrics, use the dropdown menu at the top of the page to select your Prometheus data source and run the same query as before.
If no metrics appear, metrics are not being collected. If you see a metrics graph and table (example below), that confirms metrics are being received.

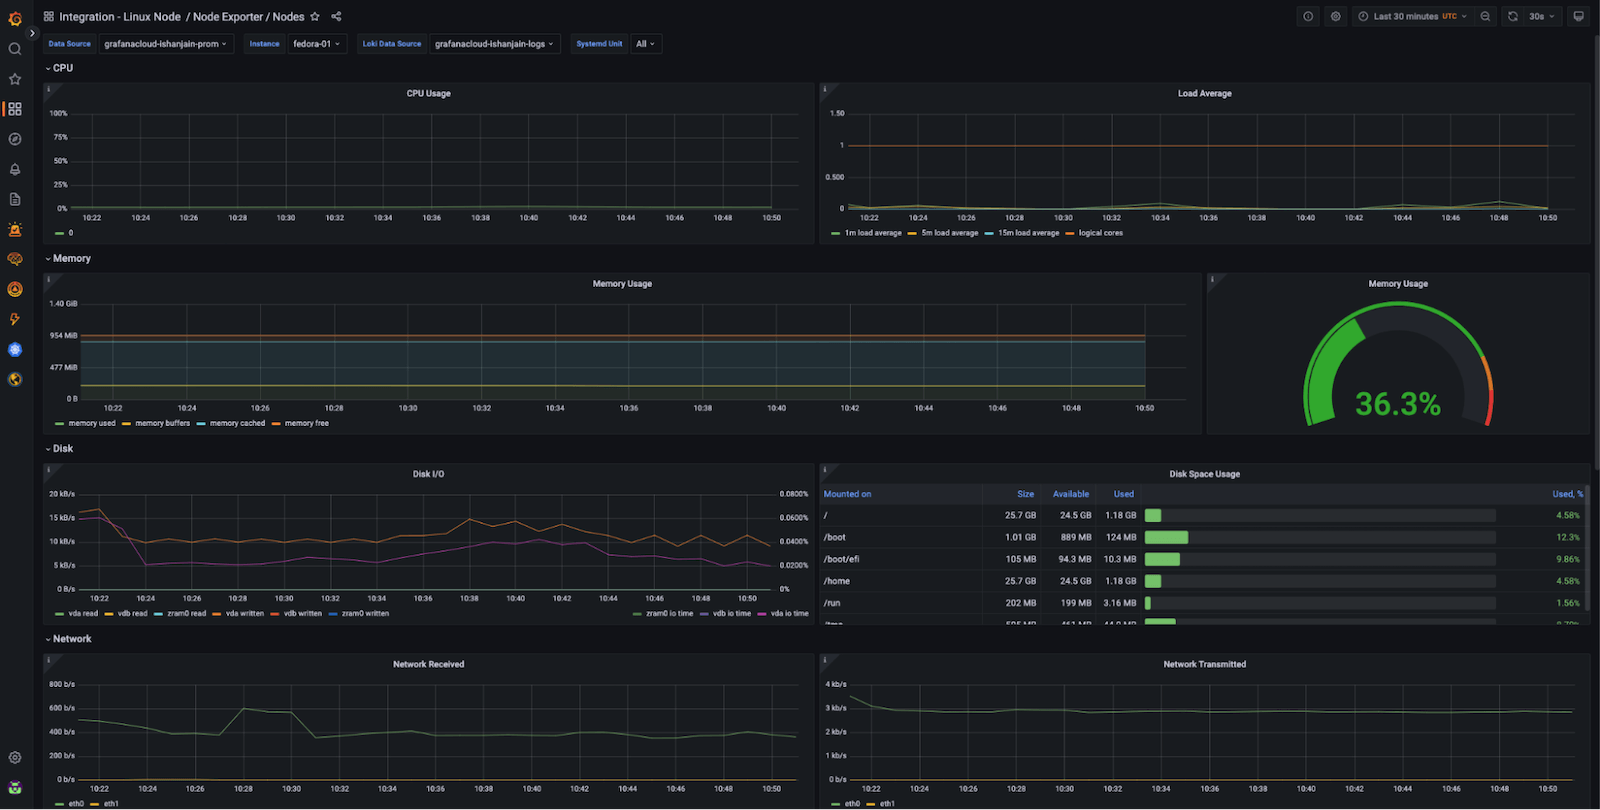
Now that you have logs and metrics in Grafana, you can use dashboards to conveniently view them. Here’s an example of one of the prebuilt dashboards you’ll get by using the Linux integration:

Using the Instance dropdown in the above dashboard, you can select from the hostnames (for example, ubuntu-01, fedora-02, etc) where you deployed Grafana Agent and start monitoring them.
Conclusion
The grafana_agent role makes it very easy for users to deploy Grafana Agents across various machines at the same time and ultimately makes it easier to manage these deployments. I used eight in my example, but it’s possible to use many more. It is easy to scale since you just need to update the inventory file and re-run the Ansible playbook (which can also be automated).
To learn more about the Grafana Ansible collection, check out its GitHub repository or documentation. You can also find more tutorials on how to use the Grafana Ansible collection in the Grafana Cloud documentation.
Grafana Cloud is the easiest way to get started with metrics, logs, traces, and dashboards. We have a generous free forever tier and plans for every use case. Sign up for free now!


