
Grafana dashboards in 2022: Memorable use cases of the year
One of our favorite things at Grafana Labs is seeing Grafana dashboards in action. Over the past year, members of the Grafana community — from inside and outside of the company — shared the unique ways they have used dashboards to monitor a wide range of projects including an elderly parent’s home, a Tesla, and a python named Pretzel. Let’s take a look back at some of the eye-catching and informative results:
Taking care of a loved one
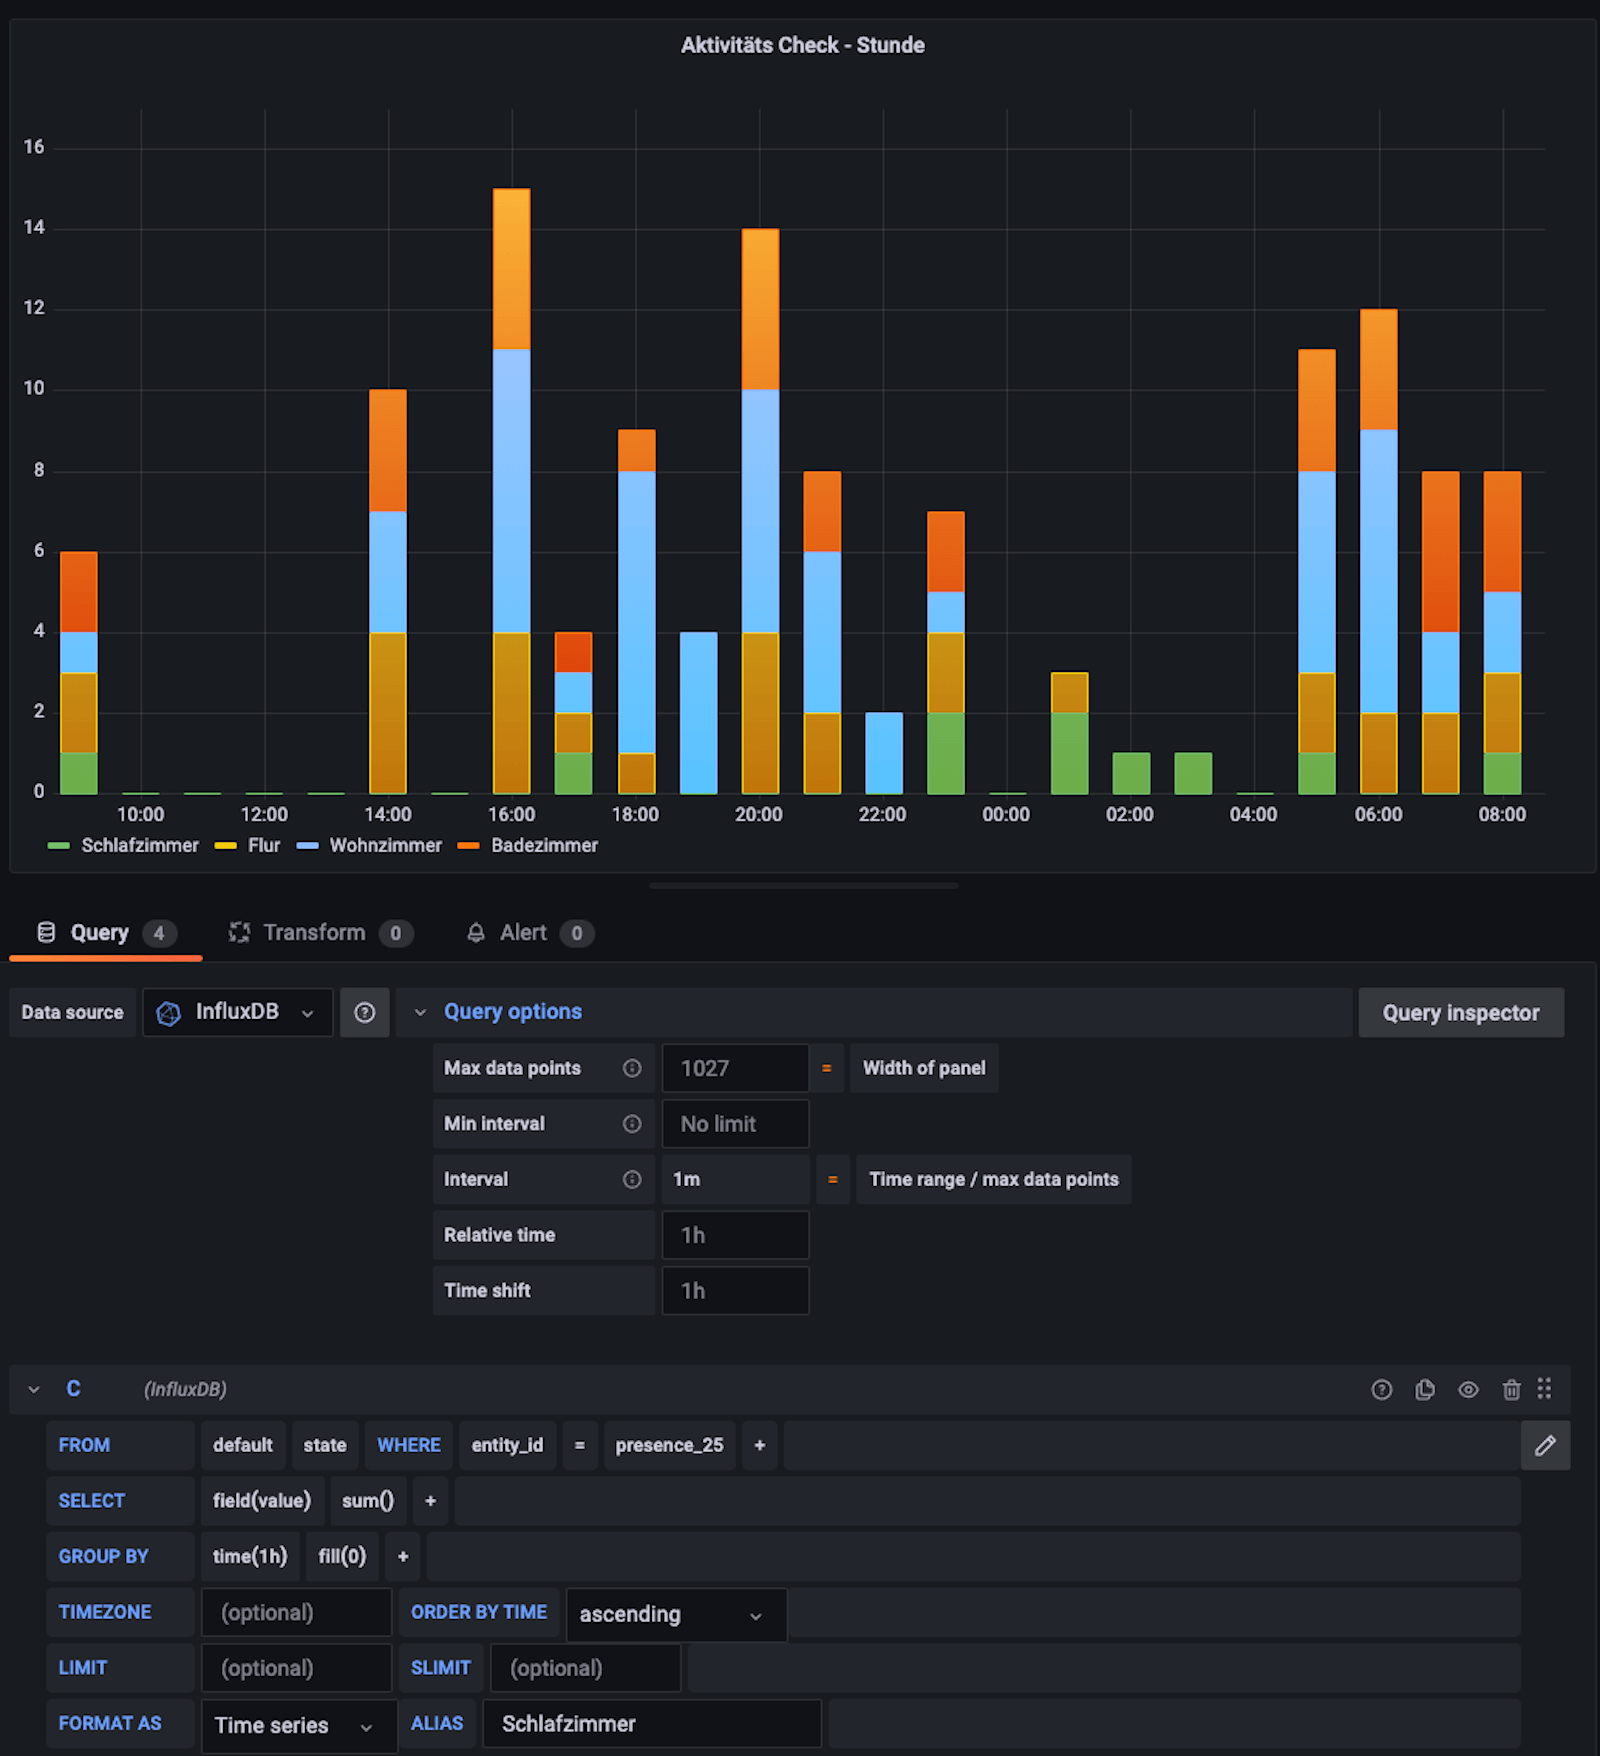
As part of his professional work, SmartLiving.Rocks founder Amon Reich had been involved in a government project on Ambient Assisted Living (AAL), which is the use of smart technology to support and monitor senior citizens living independently in their own homes. His personal life and work life converged when he needed to find a way to keep an eye on his own elderly father’s health and activity.
In a guest blog, he explained how he created the SeniorenSmarthome system by modifying his father’s existing Smart Home device (which was mainly used for controlling the lights) and connecting it to a Grafana dashboard. Using sensors and Grafana, he can keep track of things such as movement detection, when the coffee machine is on, or if the bathroom humidity rises (which means his father is showering). “That information — which lets me know he’s going about his usual day — not only gives me peace of mind,” he said, “but it’s also a lot less costly than hiring an aide or moving my father out of his home.”
Analyzing scientific images
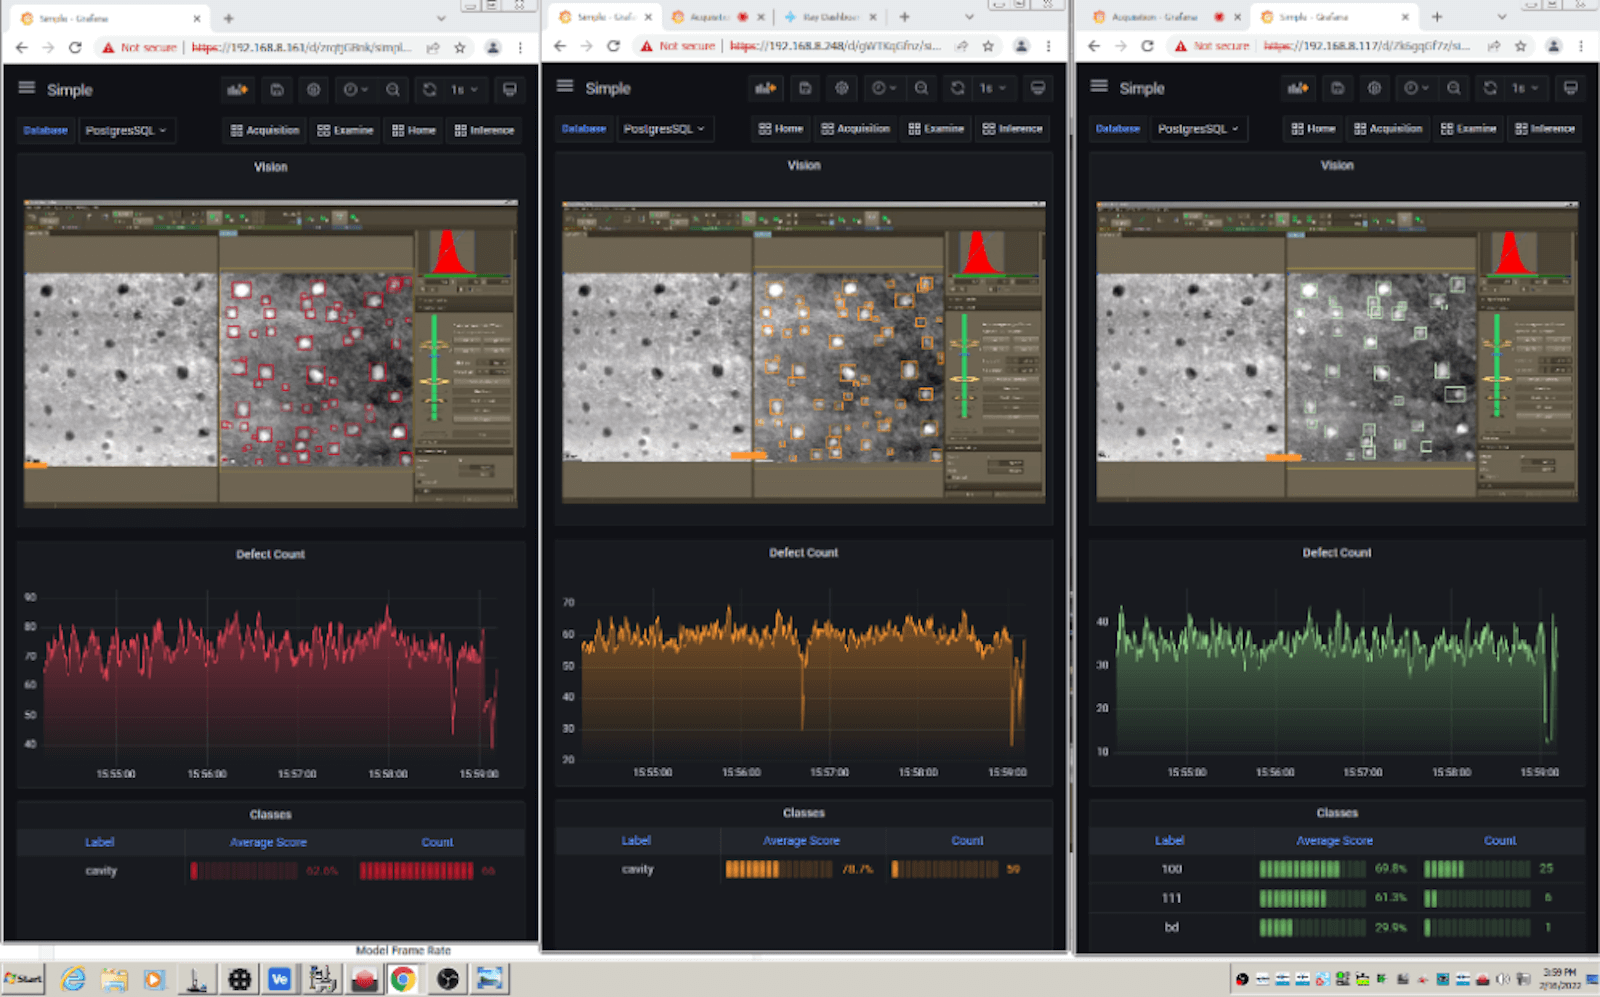
In a guest post and a presentation at GrafanaCONline 2022, Theia Scientific President, Managing Member, and Lead Developer Chris Field and Volkov Labs founder and CEO Mikhail Volkov shared how they are using Grafana and machine learning for real-time microscopy image analysis, a technique used for manufacturing and quality control, as well as in academic research and more. It involves capturing images on a microscope using a digital device such as a PC, iPad, or camera, then using the images to count or measure the size of certain features contained in it.
By combining machine learning, computer vision, and Grafana, they were able to automate workflow to enable real-time or “live” analysis of microscopy images. It reduced labor costs by 80% in some instances and helped deliver analysis results in seconds rather than years or months.
Keeping tabs on a Tesla
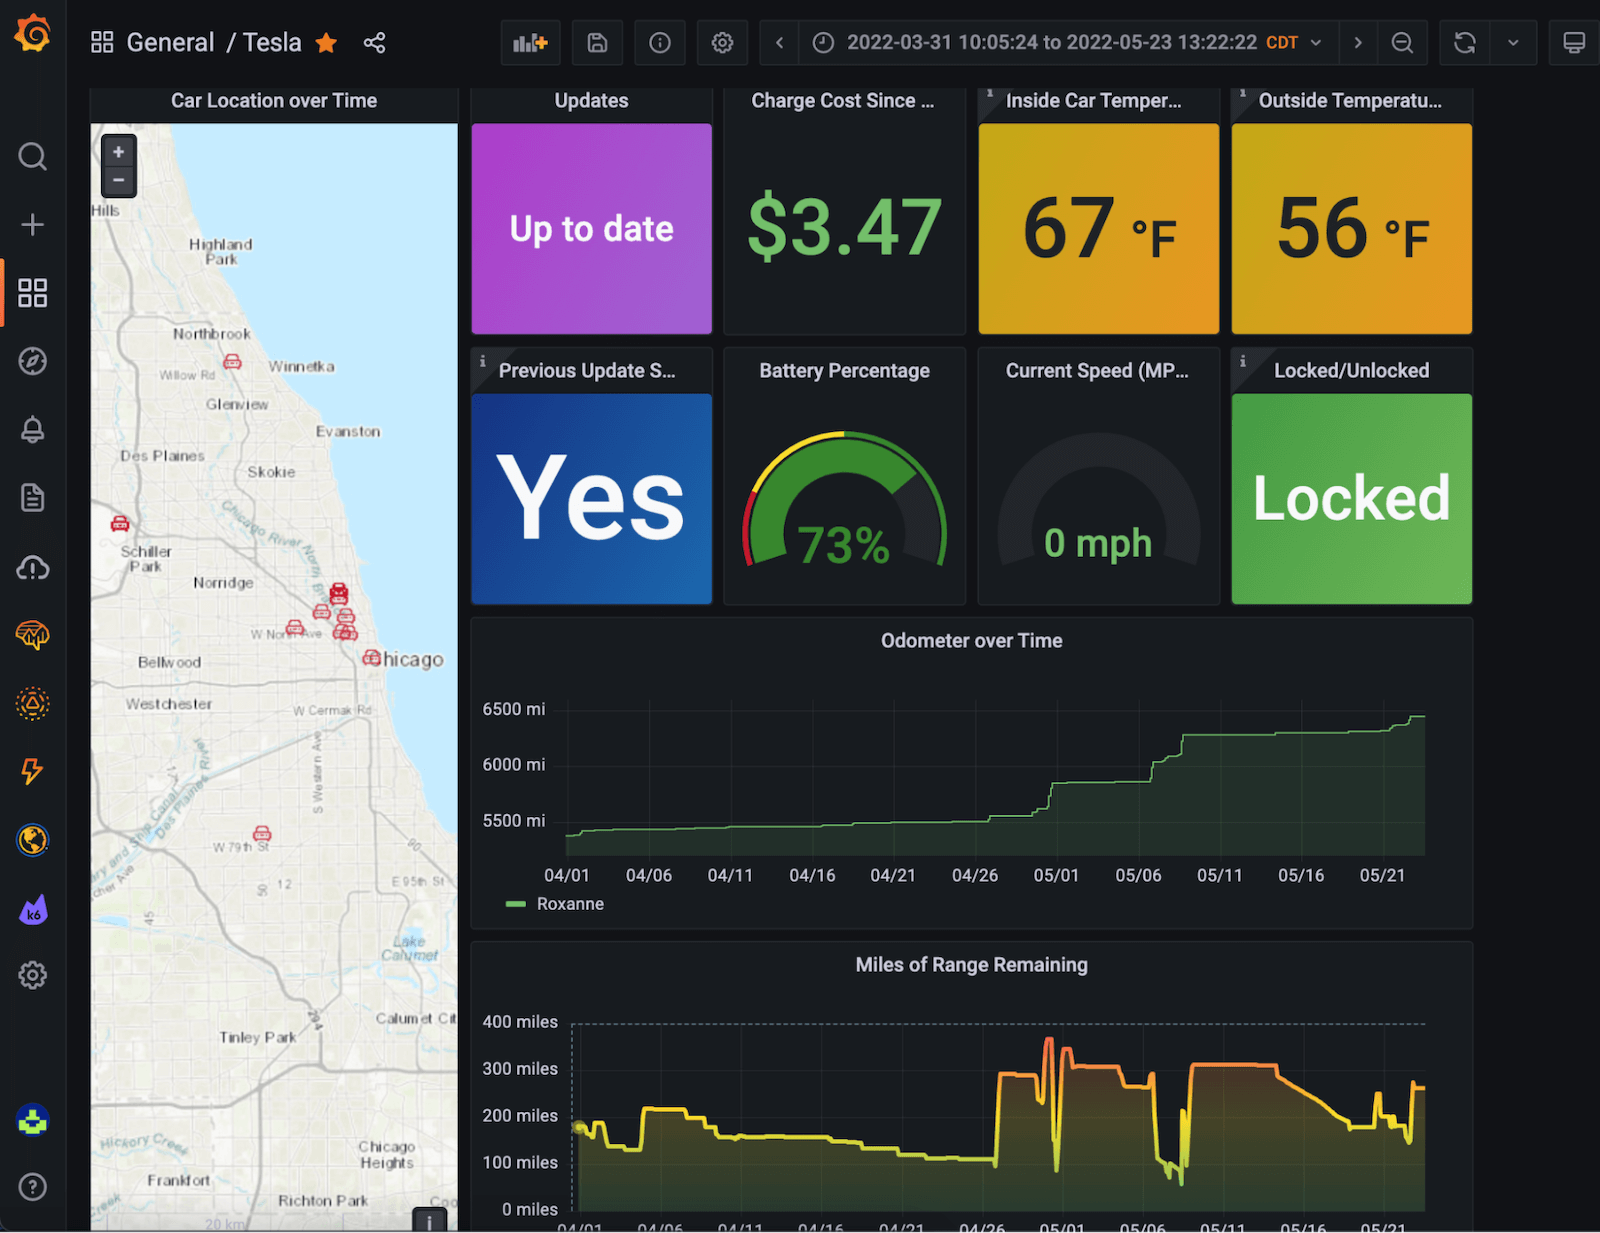
When senior solutions engineer Matt Stewart joined Grafana Labs in March, he decided to get to know Grafana better by using it to monitor his Tesla Model 3. “Having seen that the Tesla APIs were available for use, it felt like a good learning opportunity,” he said. “Plus, I thought it would be fun to look at all of the cool usage insights I could collect, from understanding if my over-the-air (OTA) updates succeeded, to keeping track of my charge state, how many miles I’ve driven in the last month, if I left a door unlocked, and more.” In his post, he walked through his setup, which included a Grafana Cloud account, Prometheus (local install on Raspberry Pi), and a teslafi_exporter.
Tracking the growth of a sourdough starter
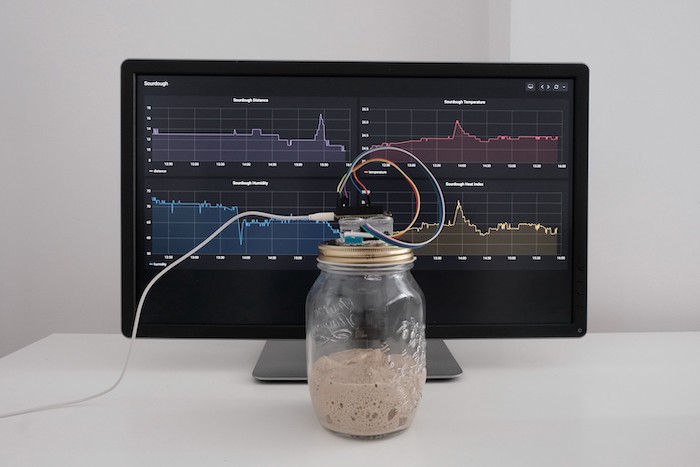
In a sequel to her 2020 post on monitoring a sourdough starter, Grafana Labs software developer Ivana Huckova shared how she’s updated the setup she uses to track her sourdough starter’s temperature, humidity, and height. “Now the collected data goes to Grafana Mimir, the open source time series database that stores Prometheus metrics, in Grafana Cloud, and the information is visualized in beautiful graphs in Grafana,” she said. “In Grafana, you can track your metrics over time or even set up alerts that will remind you when to feed your starter.”
Staying on top of a hard water softener
Did you know that Grafana Cloud can help prevent dry skin and pipe damage? Senior solutions engineer Willie Engelbrecht made that discovery when he successfully used an ESP32 microcontroller and Grafana Cloud to build a system to monitor a hard water softener at his home. It keeps track of the level of a salt block inside of a water tank and alerts him when it is time to be replaced.
“Thanks to Grafana Cloud, I will never forget to replace my salt in time again,” he said in his post. “My family’s skin, our pipes, and our appliances are very thankful, and now I don’t have to worry about spending money on repairing hard water damage in the future.”

Making a pet python comfortable
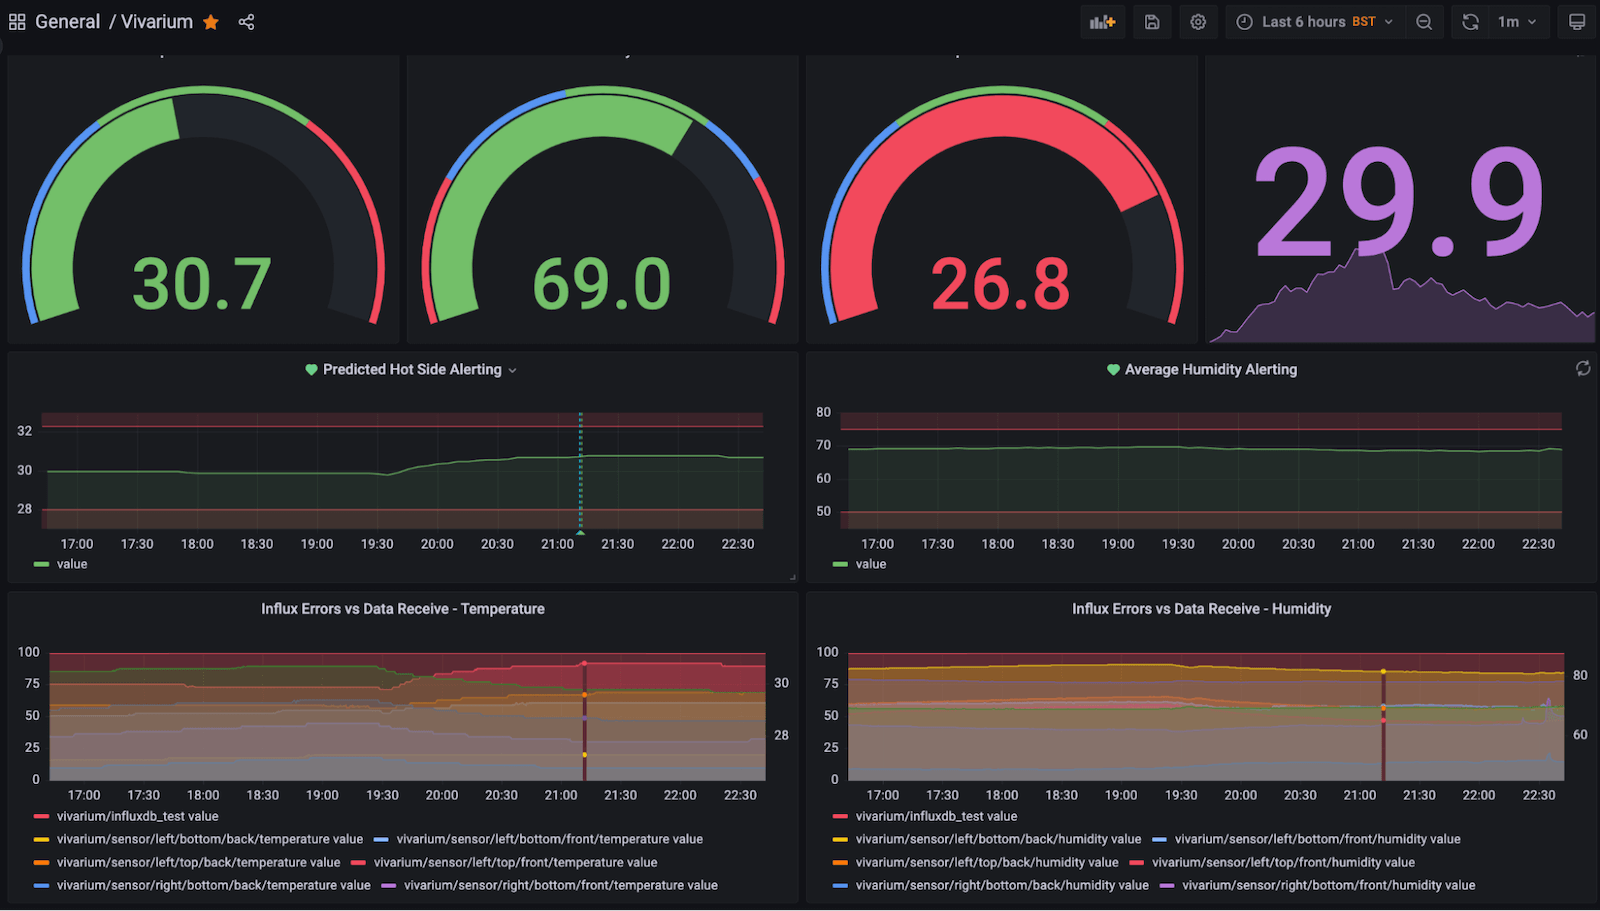
A snake named Pretzel was the star of this guest post from IT consultant Paul Leroy and his daughter Astri. When Astri wanted a pet python, Paul realized it was going to take some work to make sure it was happy living in a temperature-controlled vivarium in their UK home. The pair set up a monitoring and alerting system using sensors along with Grafana, InfluxDB, Mosquitto, and Node-RED. It was mobile and easy enough for Astri (a secondary school student) to use.
In one of their dashboards, they set up critical panels that show the humidity in the vivarium as well as the temperature in different areas. The graphs track humidity and temperature for the over-time analysis used for the alerting, and they can also see the input (and gaps in the data) as well as the Influx test point, which lets Paul know if data is missing from the sensor or Node-RED.
Though Paul said he still had some adjustments to make, he reported, “Pretzel is doing well.”
Visualizing fitness metrics
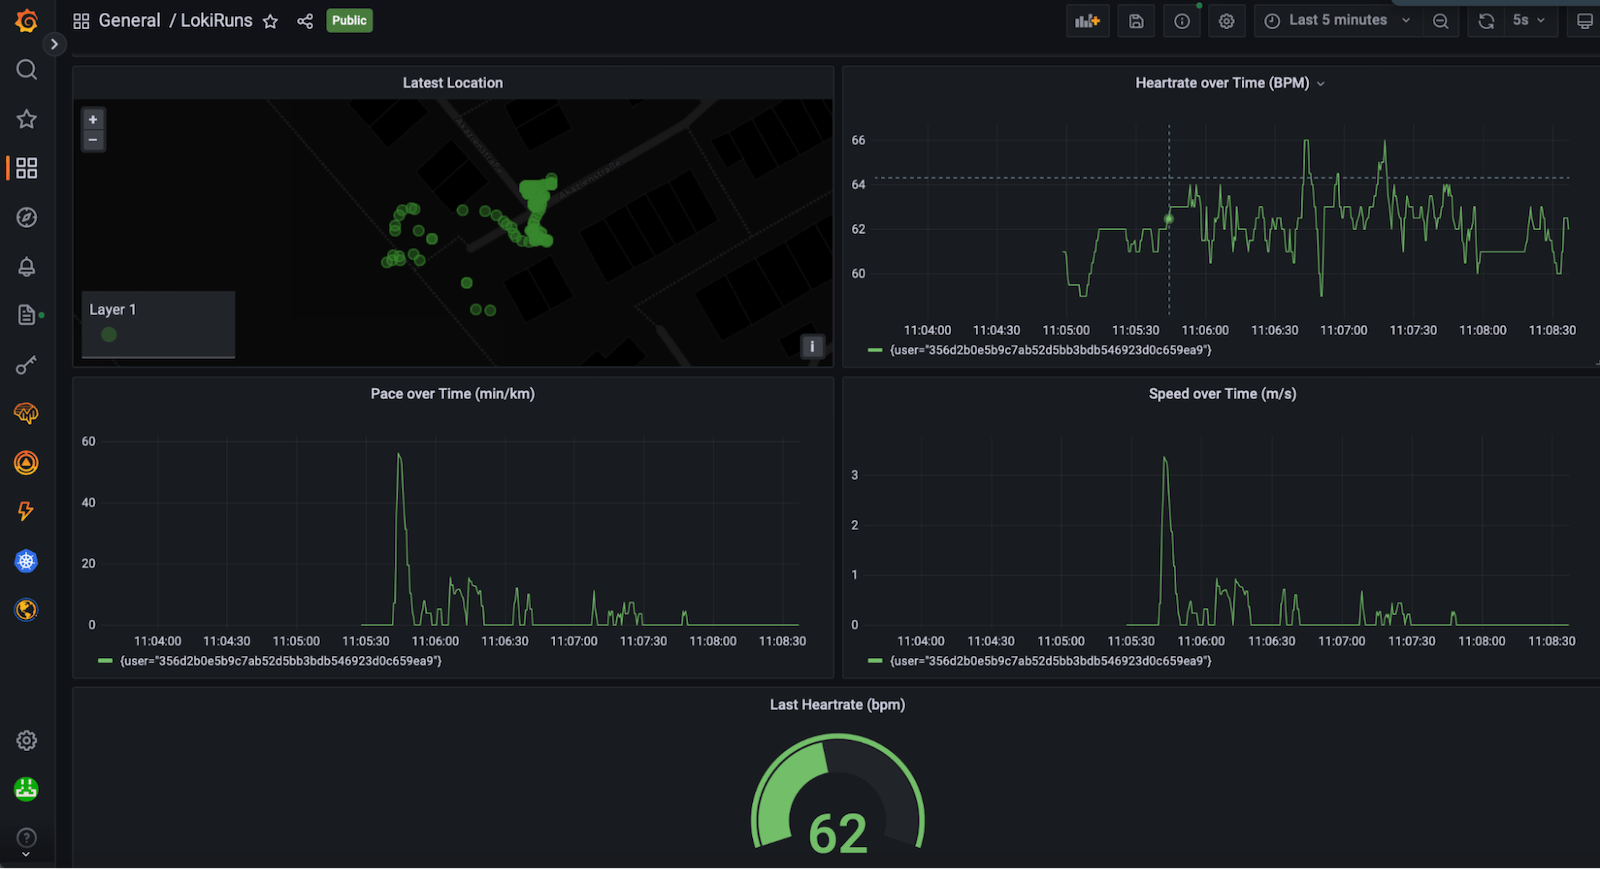
Grafana Labs solutions engineers and running pals Emil A. Siemes and Stefan Kupstaitis-Dunkler teamed up on a project that used Grafana Loki, Grafana Cloud, and an IoT sensor — a Garmin sport watch — to visualize running metrics on a Grafana dashboard.
In their blog post, they walked through their setup and noted that there is a wider use case for their project that is not limited to sports trackers or human body telemetry: “This architecture serves as an IoT example with a much broader area of application: simple devices with no direct internet connection talking to edge devices with more compute power and internet connection.”
Monitoring high-performance computing systems
The National Energy Research Scientific Computing Center (NERSC) is a modern data center that’s home to two powerful high-performance computing (HPC) systems used for worldwide scientific research in genetics, physics, geology, and more. Any deviation outside certain air condition parameters can degrade NERSC’s HPC system, so monitoring the temperature and humidity is essential. Nicolas Ventura, a critical facilities engineer at NERSC, contributed a guest post that revealed how they integrated air condition data charts with Grafana to quickly and easily monitor supply air conditions in their HPC system.
Data centers follow a standardized set of environmental parameters to help maintain efficiency and maximize the lifetime of computer equipment. “These parameters include not only dry bulb temperature, but also wet bulb temperature, dew point temperature, and relative humidity,” Ventura explained. “These are called psychrometric state variables, and the combination is called a psychrometric state. Our systems require a strict tolerance on the state of air, so visualizing the state helps us quickly take action to keep our data center healthy.”
Ventura said they only need to really know two psychrometric properties to “fix the state,” which means that all other state variables can be calculated just by knowing any two of them. They do that by using a psychrometric chart.
“Some of my colleagues in the building infrastructure group have been asking for a real-time psychrometric chart for a long time — and we worked to create that solution with Grafana,” he said. He explained how he built a project dubbed “Psychart,” which was intended to integrate a psychrometric chart in Grafana (as seen below).
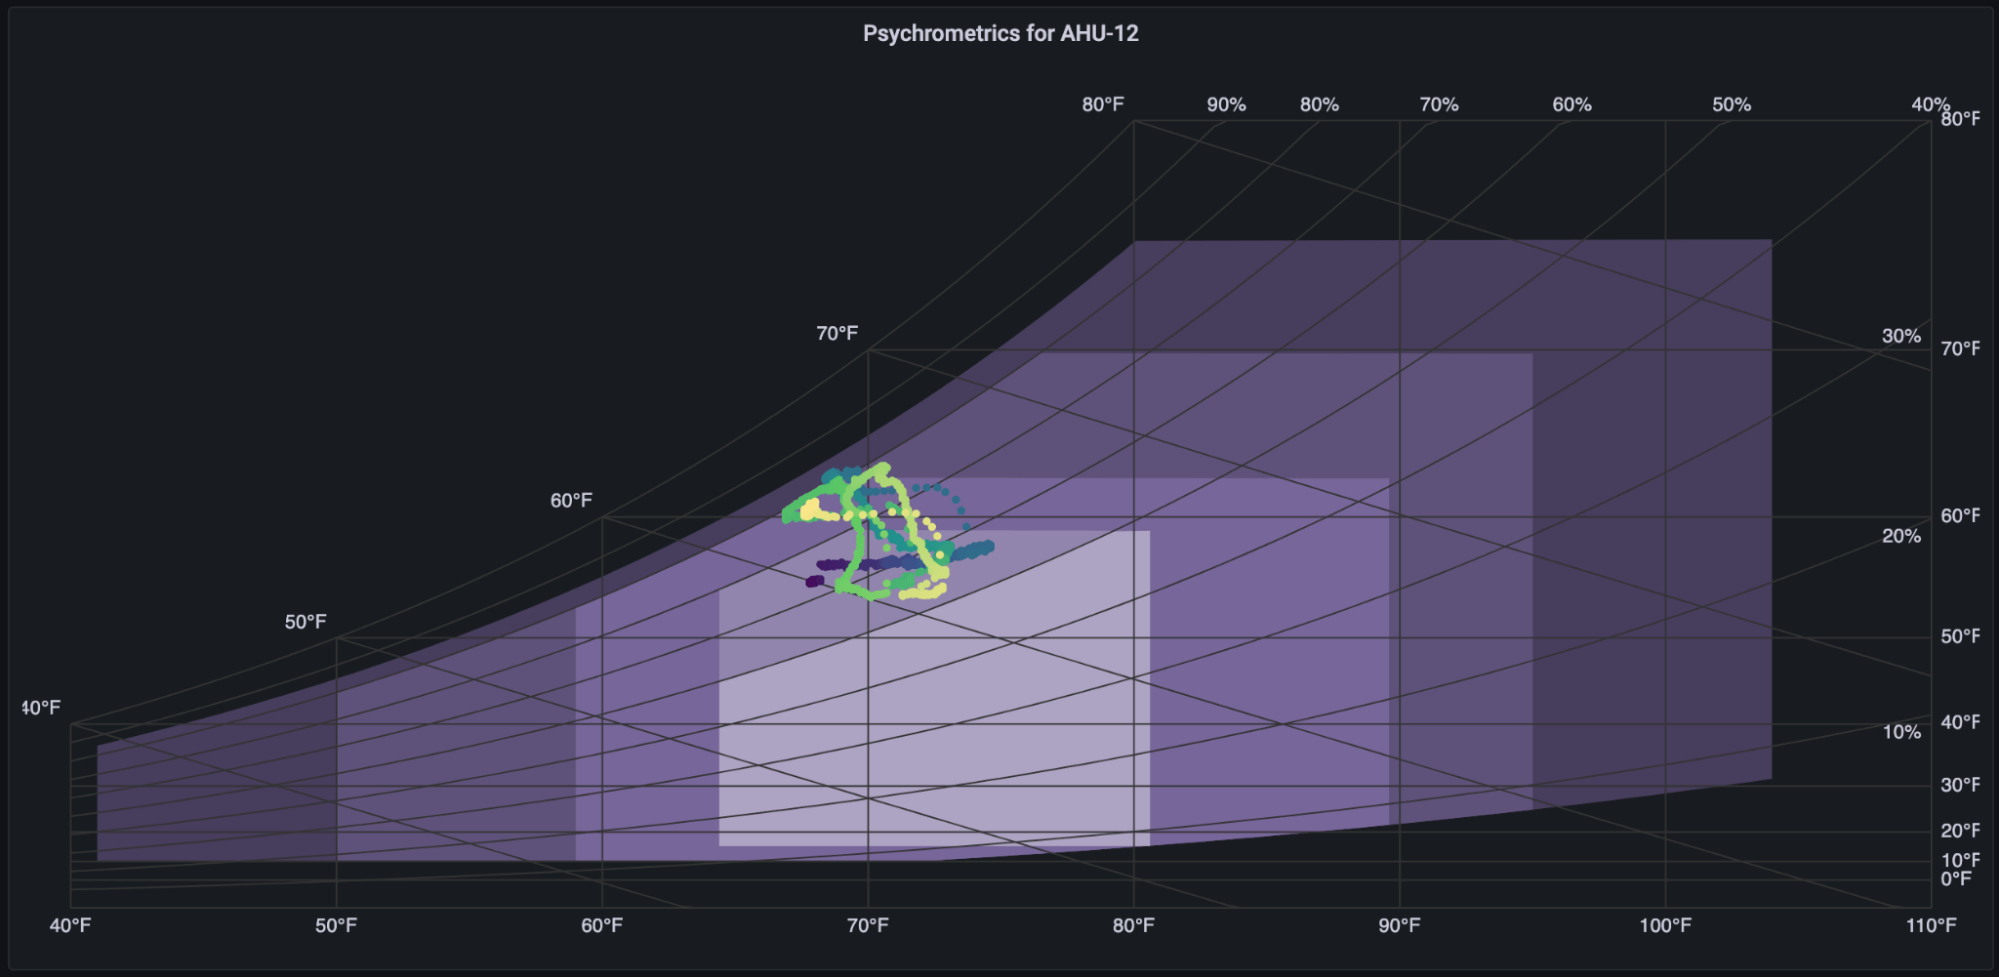
“The project, which is open source and free to download, is proving to be an extremely helpful visual tool for our cooling plant and many others,” he said.
And that’s not all . . .
In 2022, we also highlighted a wide range of customer success stories. Check out some of their impressive dashboards:
Monitoring crops remotely
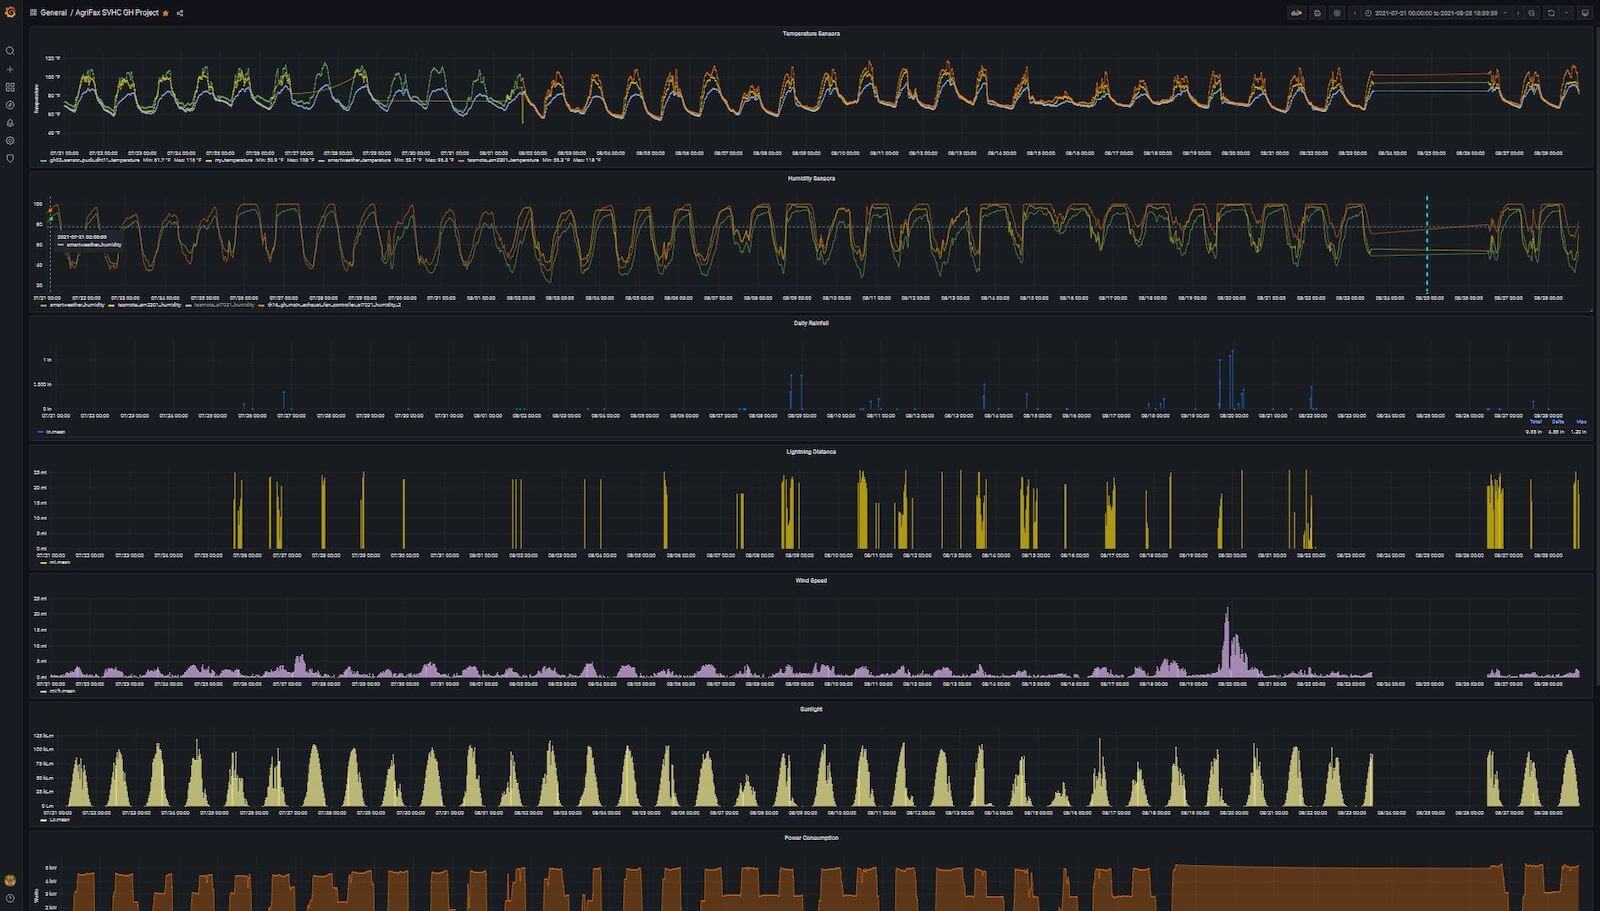
The agricultural tech consulting company AgriTech uses sensor data analytics, AI, IoT, and Grafana to help farmers — such as Pure Shenandoah, one of the largest industrial hemp fiber growers in Virginia — improve their crop health, maximize their yield (and resulting profits), cut costs, and offset their CO2 emissions.
Keeping track of next-generation maritime vessels
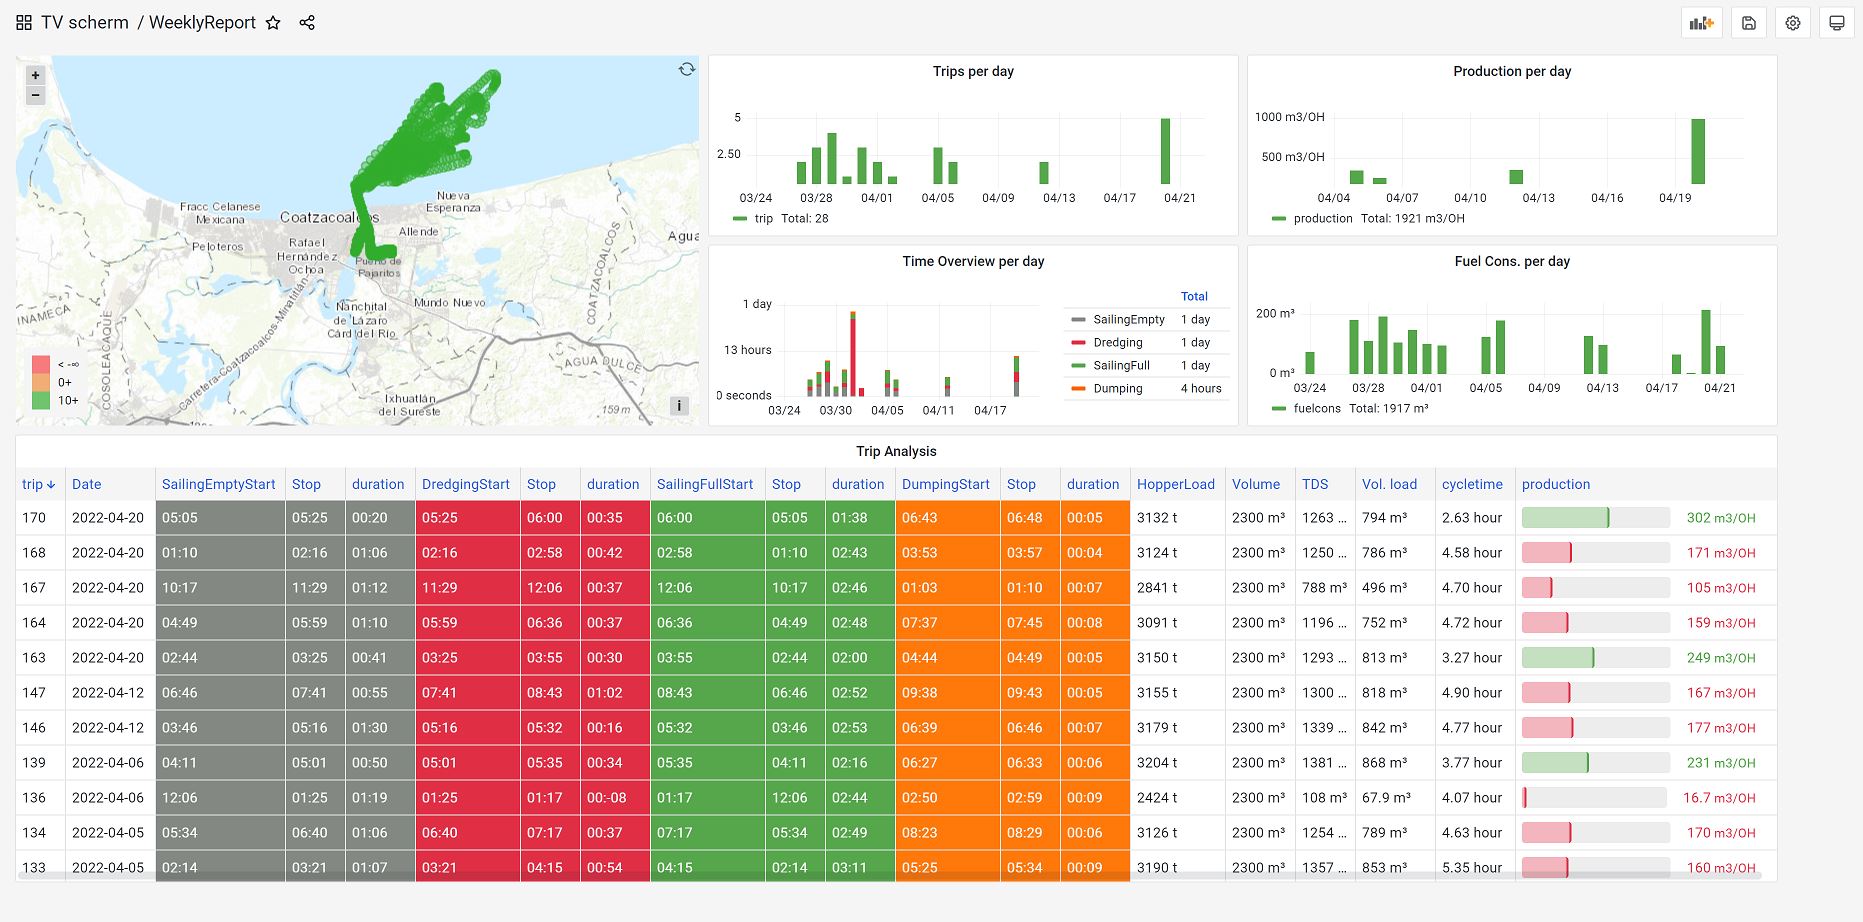
Maritime technology supplier Royal IHC is known for delivering reliable, integrated solutions for their customers’ sensor-filled dredging vessels. With Grafana — first OSS and then the Grafana Cloud Advanced plan — they’ve created dashboards that can provide a high-level view of a fleet and also showcase key performance metrics such as production, fuel consumption, service hours, atmospheric conditions, and alarm status.
Improving uptime with real-time data
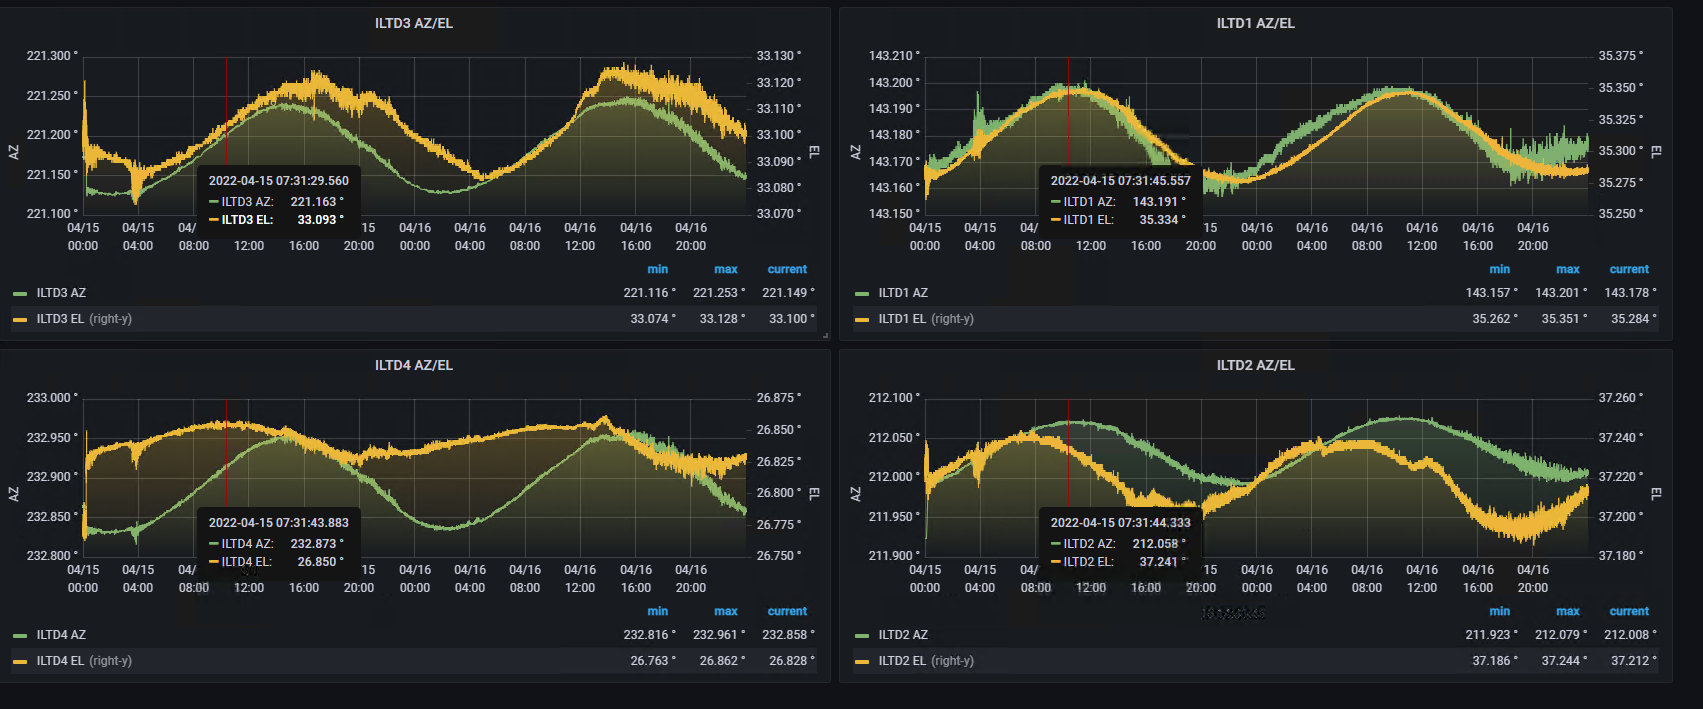
For Dish Network a company offering products ranging from Dish and Sling TV to retail wireless services and 5G networks, monitoring satellite communications equipment is mission critical to maintaining extreme uptime for Dish’s 20 million customers across the U.S.
In a GrafanaCONline 2022 talk titled “Grafana and Grafana Loki in space: Monitoring Earth Station Operations for Dish Network” (available to watch on demand), Systems Administrator Engineer Ted Raymond shared how his team uses Grafana to improve their already outstanding uptime with real-time dashboards and insights on everything from uplink equipment performance to weather conditions.
Detecting leakages and solving whodunits
Energinet, an independent public enterprise owned by the Danish Ministry of Climate, Energy, and Utilities, maintains high-voltage substations and cables that run through the North Sea, the Baltic Sea, and The Skagerrak, a strait between Denmark, Sweden, and Norway. Thanks to Grafana Enterprise, Energinet now has dashboards that can alert team members to leakages on high voltage switchgear and — with Grafana’s geomap panel — also help them determine who or what may have caused a cable fault.

Providing data visibility at a major live event
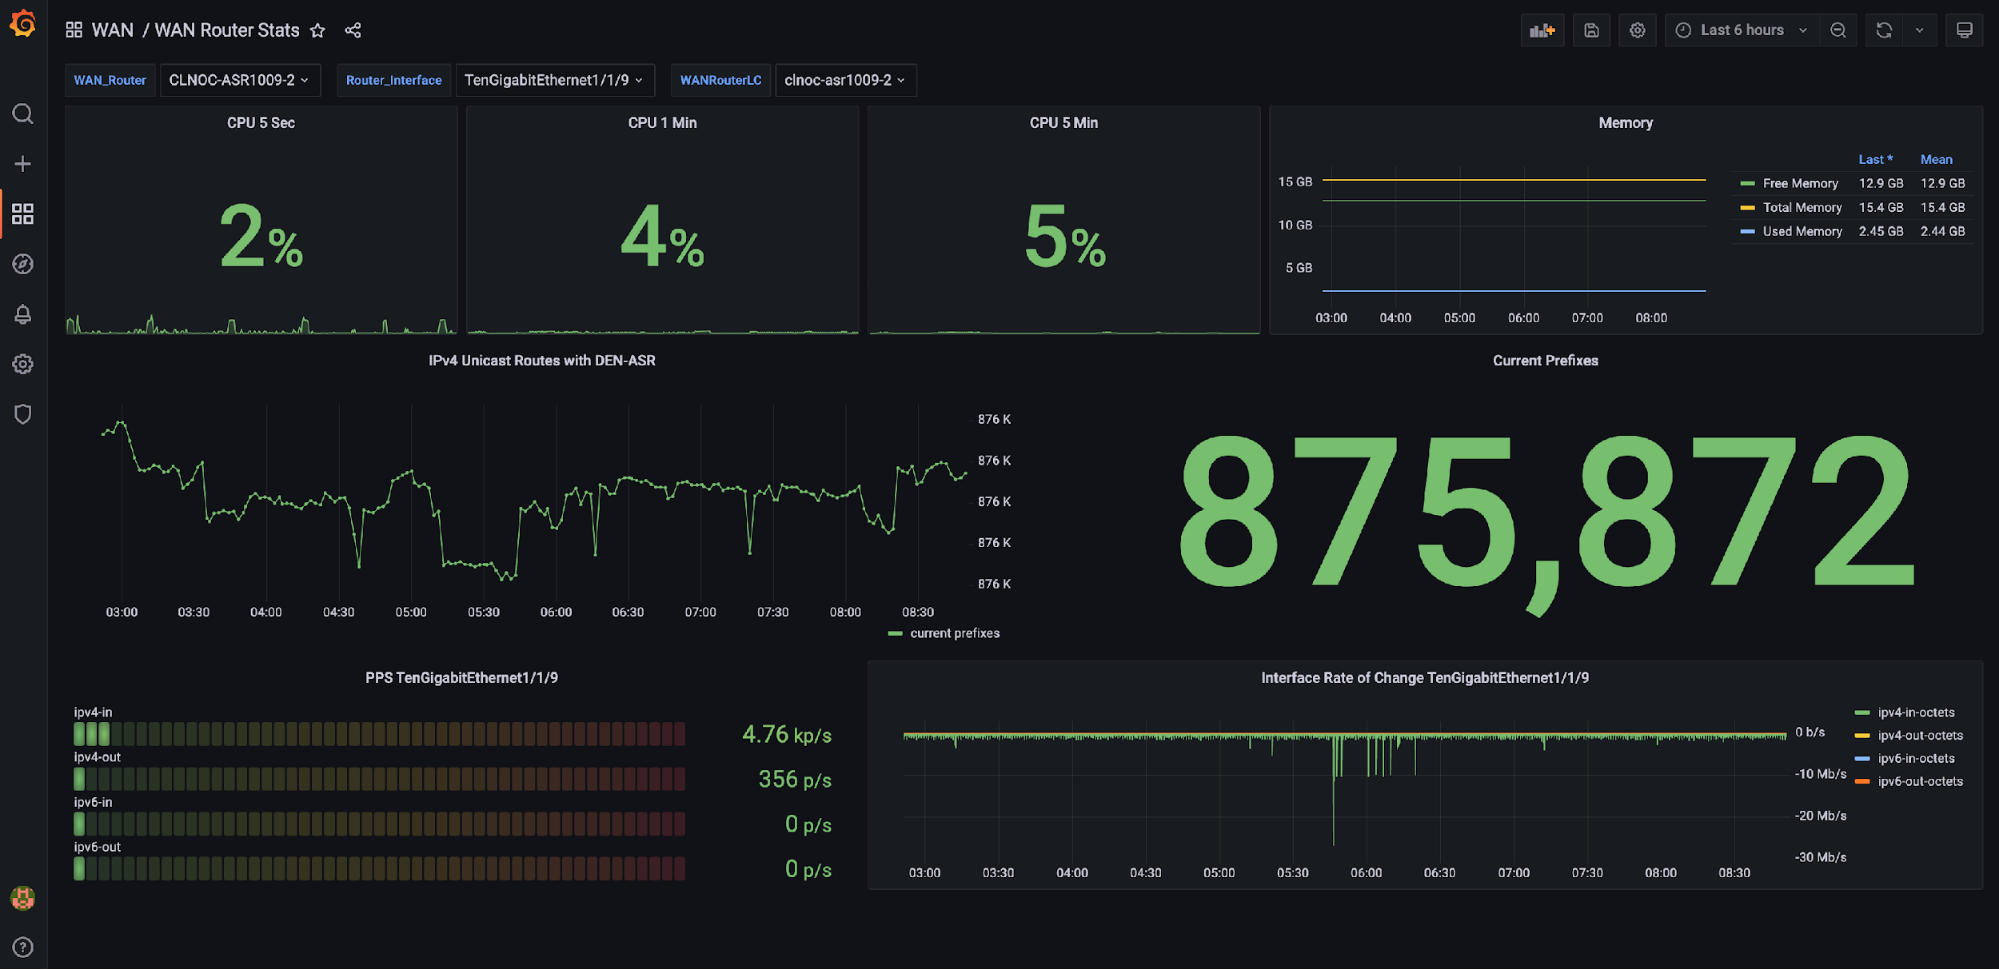
The GrafanaCONline 2022 talk titled “28,000 people, 2300 wireless access points, 650 network switches, and jumbo dashboards: How Grafana provides data visibility at Cisco Live” revealed how Cisco creates engaging Grafana dashboards that delight attendees at the company’s annual event and provide mission-critical insights for team members and stakeholders.
Viewing website performance
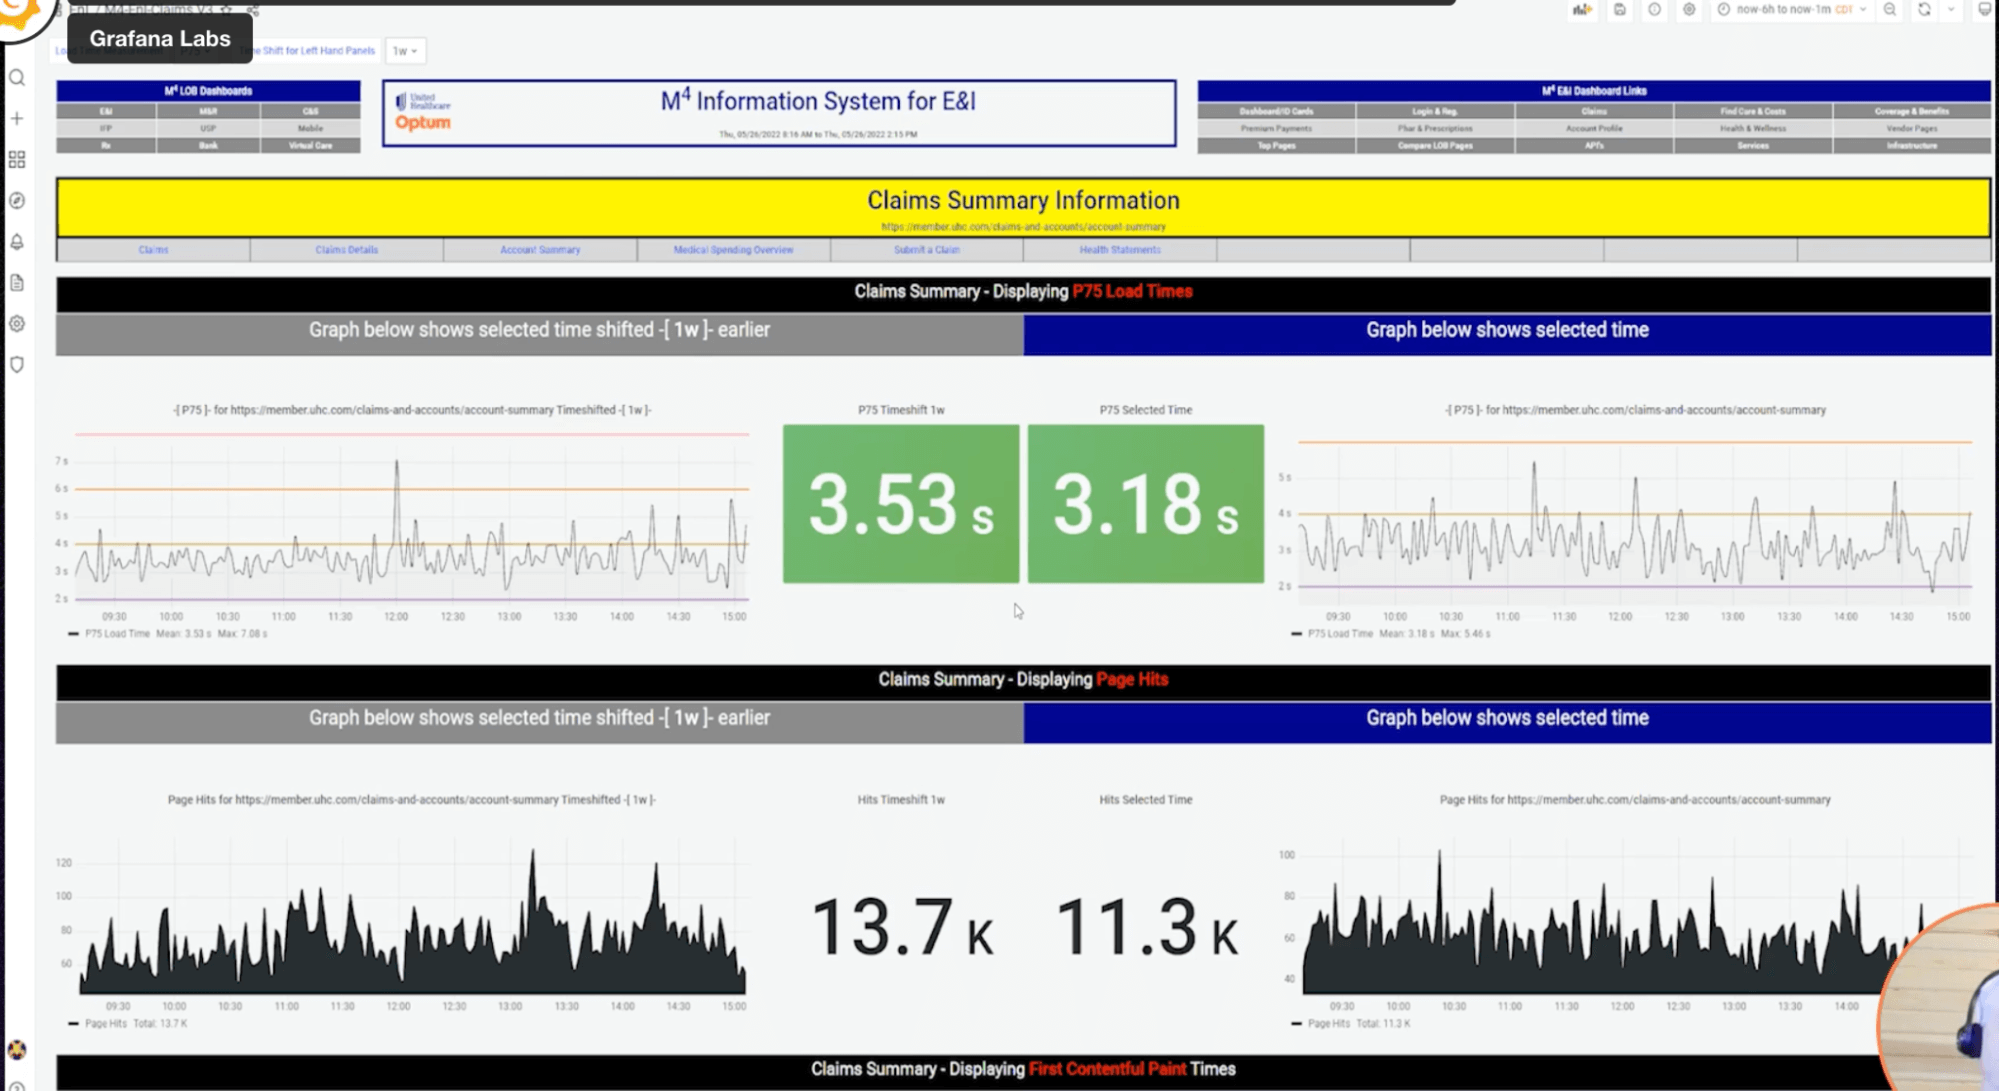
The U.S.-based health services business Optum has been using Grafana Enterprise to build a website performance monitoring system that’s easy for people across the organization — from the C-suite to admins to development teams — to access and interpret data to drive better decision making.
The GrafanaCONline 2022 talk “How Optum uses Grafana Enterprise for a top-to-bottom view of its healthcare website,” explained how the Optum team that created the dashboards made sure that all information could be put into context so a viewer could quickly compare current metrics with historical data and see how performance was shifting over time.
We look forward to seeing more standouts in 2023!
Want to share your Grafana story and dashboards with the community? Drop us a note at stories@grafana.com.


