
Open source at Grafana Labs in 2022: Year in review
At Grafana Labs, we’re all about open source, and this year we took it to a whole new level.
Many of you are familiar with the acronym “LGTM,” which is shorthand for “Looks good to me” and commonly used in code reviews. At Grafana Labs, LGTM has also been a guiding rubric in developing our observability stack. Up until this year, we already had our own “L” (Grafana Loki for logs), “G” (Grafana for graphs and visualizations), and “T” (Grafana Tempo for traces). In March, we rounded out our open source LGTM stack by adding the “M” with Grafana Mimir for metrics. Together they create a complete open, composable, interoperable observability stack powered by Grafana Labs and the open source community.
“We’re committed to making these core open source projects world class and continue to pour a lot of our resources into them,” Grafana Labs CEO and co-founder Raj Dutt said at GrafanaCONline 2022.

But we didn’t just stop there. We have also continued to innovate within the observability space and released three new solutions that play a part in our growing ecosystem:
- Grafana OnCall for on-call management
- Grafana Phlare for continuous profiling
- Grafana Faro for frontend application monitoring.
And we’re inspired by the community to continue releasing impactful open source tools. “Our community, that’s our superpower,” Dutt said. “We get so much lift, so much feedback, and so much energy from the wider open source community — and it ultimately helps us build better open source software.”
Here’s a look back at some of the 2022 highlights in Grafana Labs’ open source projects.
Grafana LGTM stack updates
In addition to the summaries below, you can watch our Grafana Labs experts walk through the latest and greatest updates to our LGTM stack in the “LGTM: Scale observability with Mimir, Loki, and Tempo” ObservabilityCON session available on demand.
Grafana Loki
Started in 2018, Grafana Loki is a horizontally scalable, highly available, multi-tenant log aggregation system inspired by Prometheus. It has quickly become our second most popular OSS project behind Grafana, in part, because it’s designed to be cost effective and easy to operate.
Here are some of the upgrades we made in 2022:
- Redesigned the Loki TSDB index to increase the maximum number of streams Loki can support and decrease its resource utilization.
- Added multi-tenant queries so you can query multiple tenants at once to get a global view of your logs.
- Added log line deletion so you can scrub log lines from the database you don’t want.
- Took ownership of the Loki Helm chart by bringing it into the Loki repo. This improved the docs, configuration experience, and support for meta-monitoring to make the experience of running Loki on Kubernetes easier than ever.
There’s supposed to be a video here, but for some reason there isn’t. Either we entered the id wrong (oops!), or Vimeo is down. If it’s the latter, we’d expect they’ll be back up and running soon. In the meantime, check out our blog!
For more information, check out our most recent Loki blog posts, Grafana Loki documentation, and the Grafana Loki release notes.
Grafana
Our flagship project, Grafana is used to query, visualize, alert on, and understand metrics, regardless of where they’re stored. Grafana reached an important milestone this year, surpassing 1 million instances — as well as our wildest dreams with all the inventive ways people put it to use everyday.
Some of the notable enhancements between our first release of 2022 (v8.4) and our most recent one (v9.3) focused on making Grafana more accessible and easier to use. And, of course, there were new ways to make your dashboards more dynamic and impactful. Here are the highlights:
- Amazing new visualizations include
- Bar chart panel
- New time series panel
- Candlestick panel
- New heatmap panel
- Geomap panel updates
- Panel suggestions
- Focused on accessibility and internationalization to open Grafana up to billions of new users.
- Launched the command palette and our new search and navigation to make it easier to get around.
- Took machine access to the next level — Swagger documentation and an OpenAPI spec and service accounts replace API keys.
- Rolled out the new and improved Grafana Alerting (formerly known as Unified Alerting) as the default alerting system in Grafana 9.0.
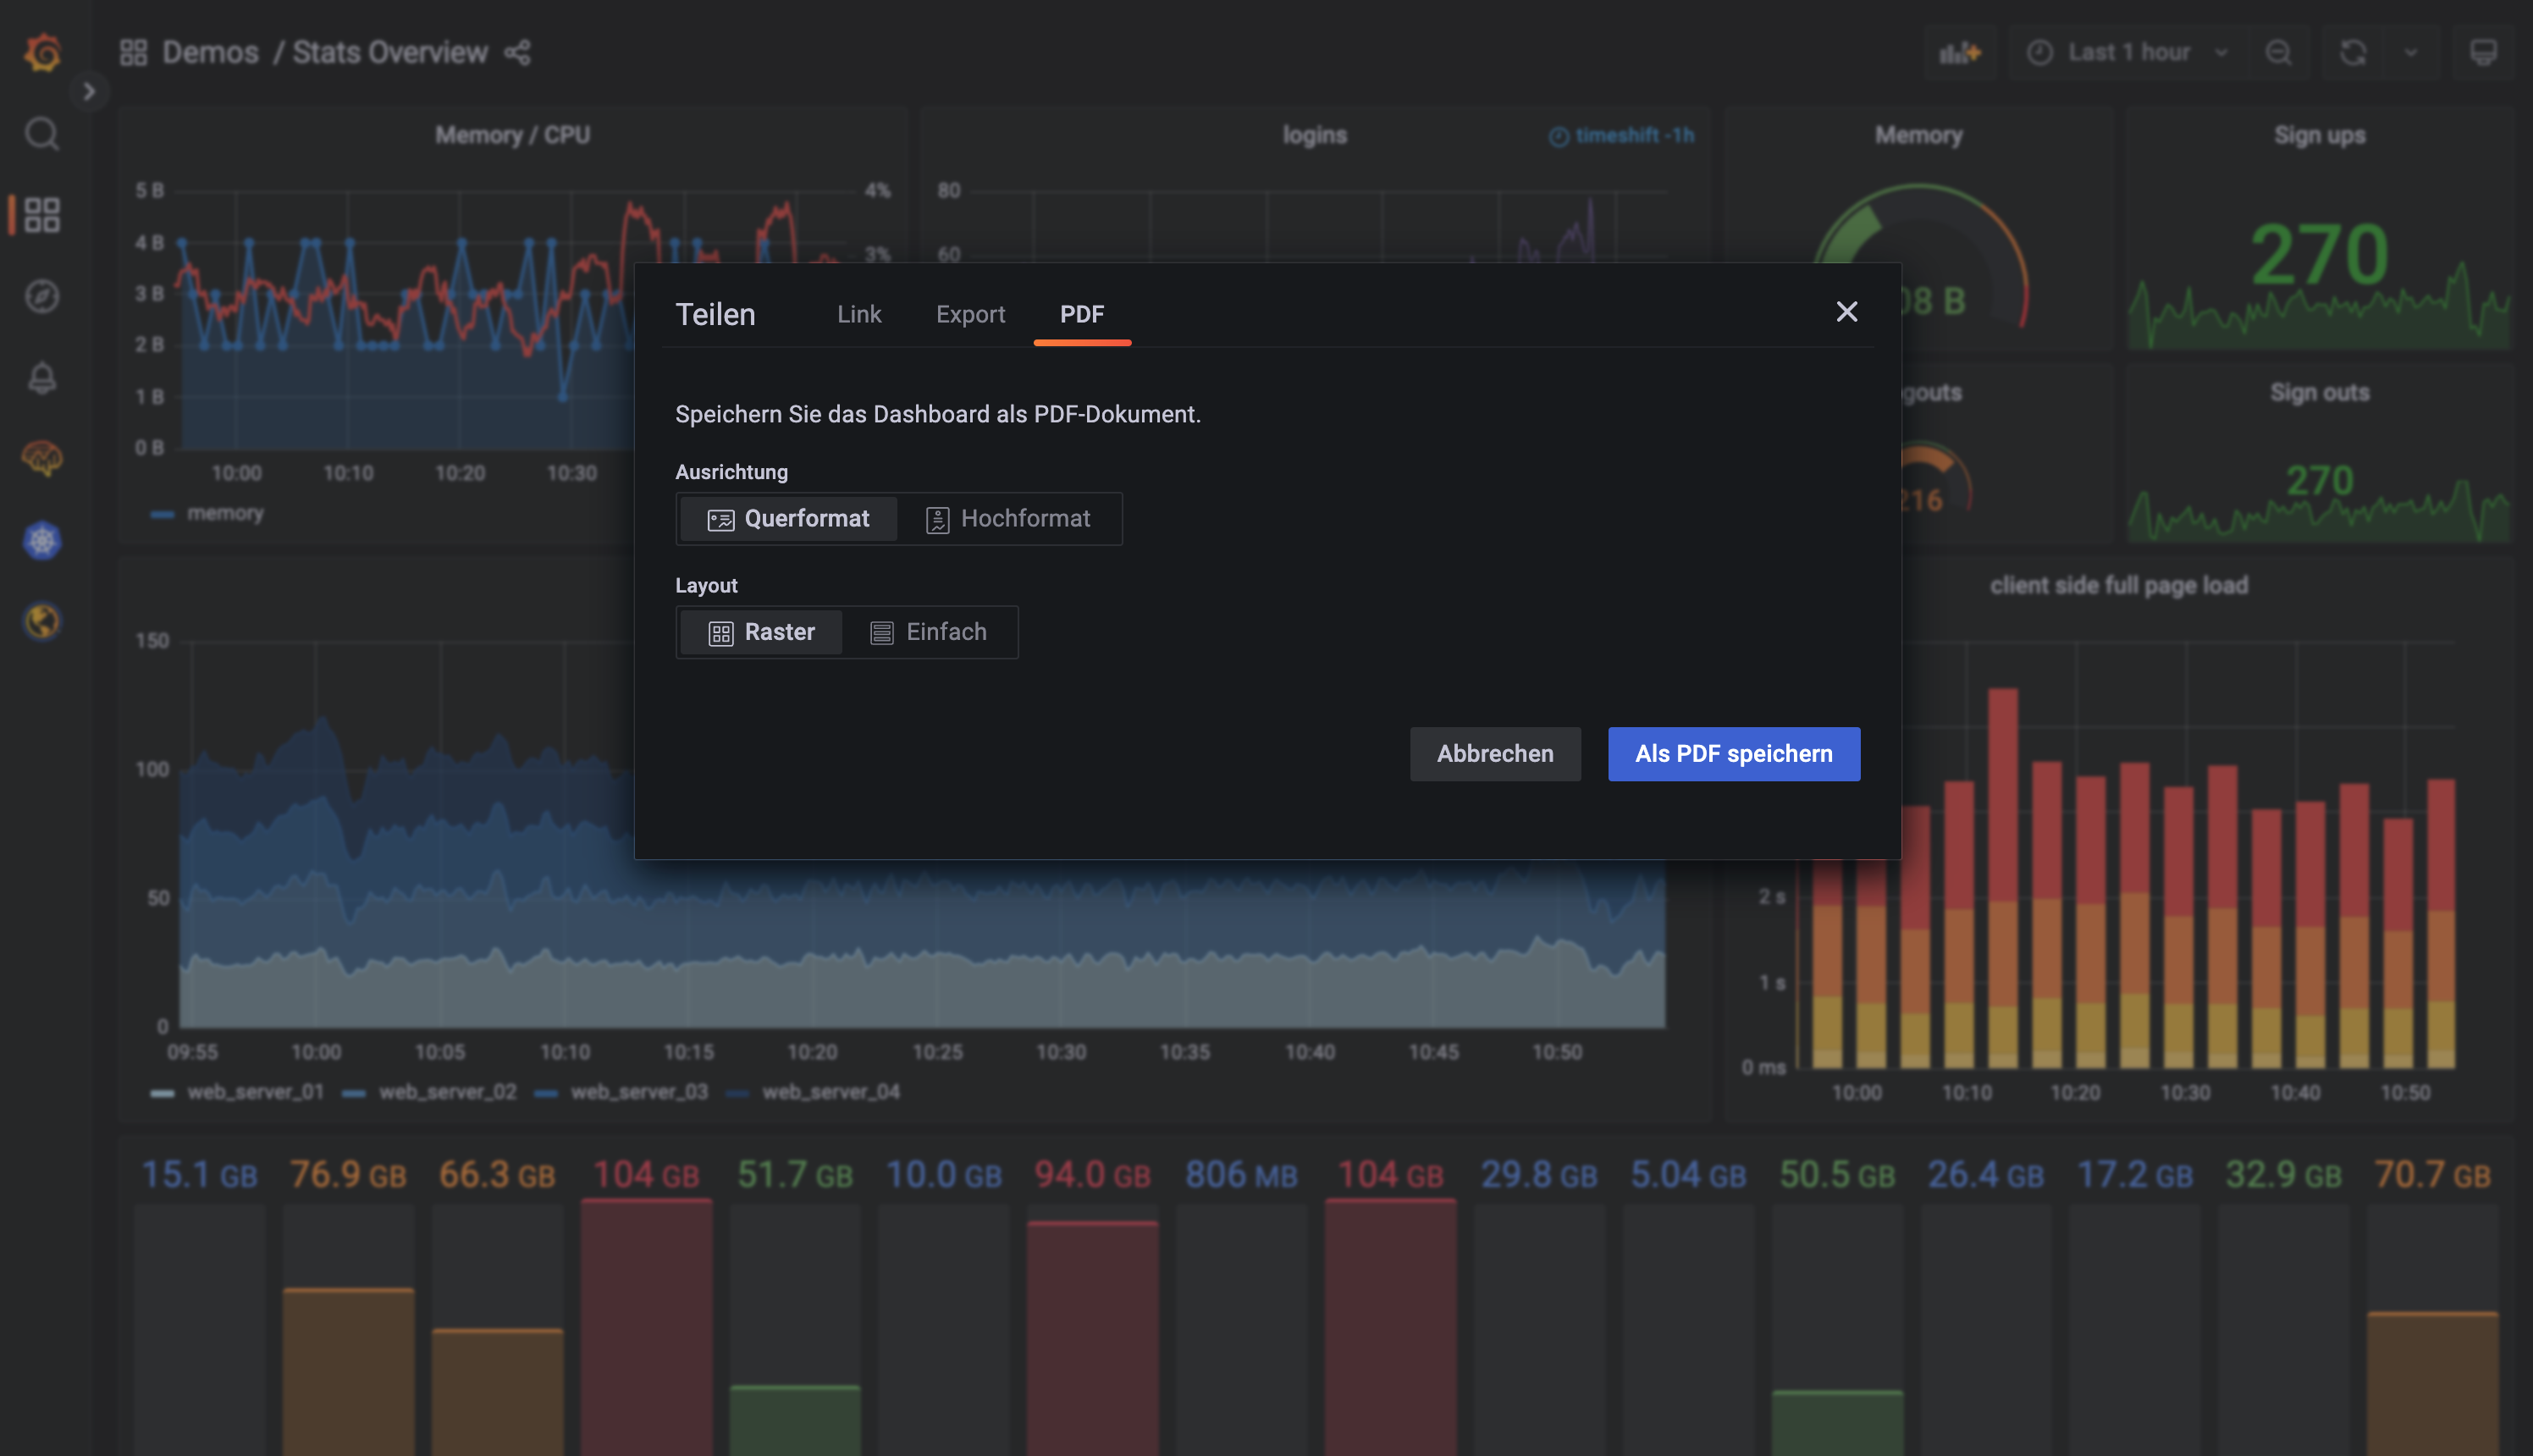
To learn more, read our most recent Grafana blog posts, check out our Grafana documentation, and the What’s new documentation for each Grafana release.
Grafana Tempo
Grafana Tempo, a highly-scalable distributed backend for tracing data, has continued to build momentum since it became generally available last year. Here’s what was added to Tempo in 2022:
- Added the ability to automatically generate metrics from trace data to build service maps and measure RED (request/error/duration) of your services with no added effort.
- Increased the window of time that Tempo can search so that you can not only query recent traces, but those from days and weeks in the past as well.
- Transitioned from using a bespoke trace storage format to using Parquet to 10x the effective speed at which we can search traces.
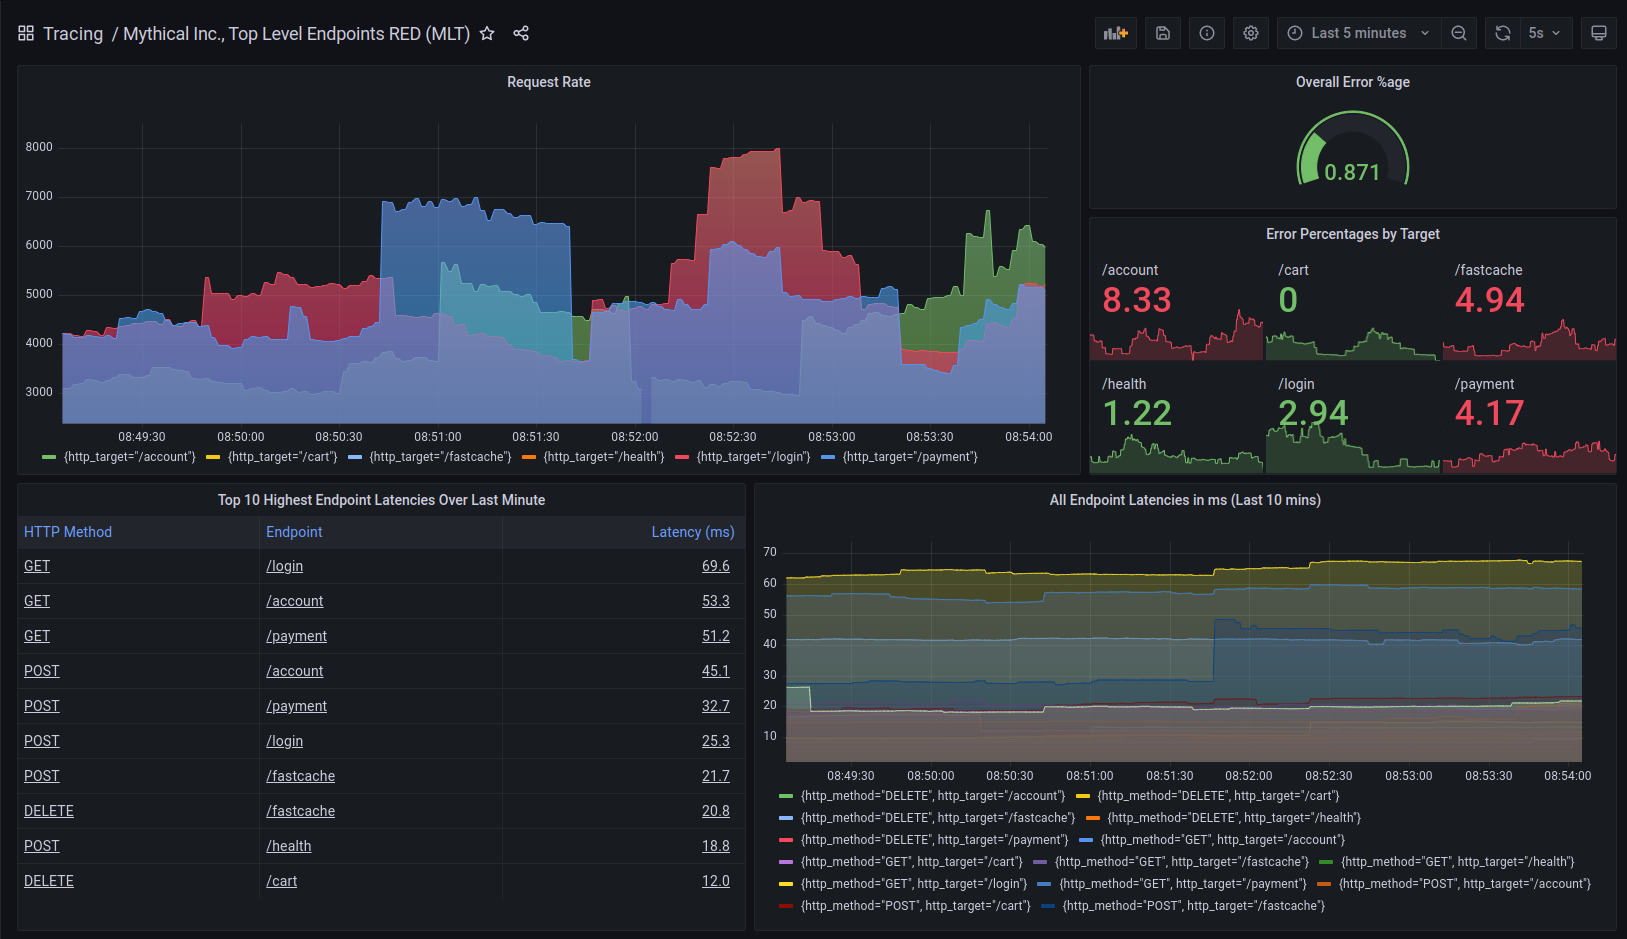
There are big advancements on the horizon for Tempo in the new year, but until then, learn more in our recent Grafana Tempo blog posts, our Tempo release notes, and our Grafana Tempo documentation.
Grafana Mimir
We were thrilled to add Grafana Mimir to our composable stack in March 2022. Mimir is the most scalable, most performant open source time series database in the world, and we’re just getting started. Here’s what we have rolled out in the first nine months of the project:
- Released with the proven ability to scale to 1 billion active time series while still providing blazing fast query performance thanks to our advanced query sharding.
- Added the ability to accept data points arriving late or out of order.
- Added the ability to ingest data sent in Datadog, Graphite, Influx, and OpenTelemtry formats so you can run one database for all your time series data.
- Added the ability to import historic data from other Prometheus compatible time series databases to make it easy to get started with Mimir without losing your existing data.
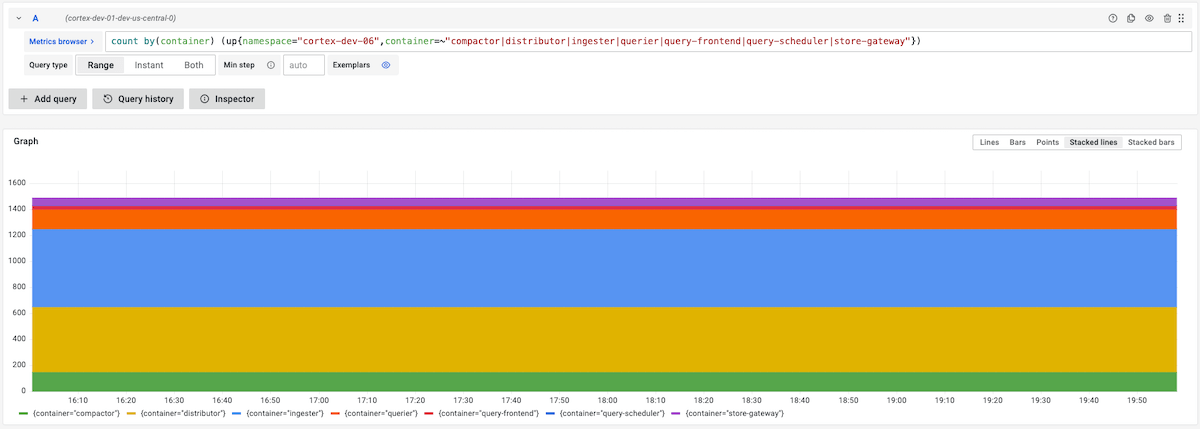
To learn more, check out our blog posts about Grafana Mimir, the Mimir release notes, and the Grafana Mimir documentation.
More open source projects
Along with updates to Grafana k6, our open source tool for load testing; Grafana Agent, which collects and forwards telemetry data to open source deployments of the Grafana LGTM Stack, Grafana Cloud, and Grafana Enterprise; and Grafana Tanka, the clean, concise and super flexible alternative to YAML for your Kubernetes cluster, we introduced three new open source tools in 2022.
Grafana OnCall OSS

Grafana OnCall was launched in November 2021 as an easy-to-use, on-call management tool in Grafana Cloud that helps reduce toil for DevOps and SRE teams. In June, we released the open source version of Grafana OnCall, which is designed for self-managed and on-premises deployments, including use cases where there are certain security requirements, third-party sensitive data, or limited connectivity. Here’s what Grafana OnCall OSS can do:
- Support for open source monitoring systems, such as Grafana, Prometheus, Alertmanager, Zabbix, and more.
- Automatic grouping of alerts to avoid alert storms and to reduce the noise during an incident.
- Customized alert grouping and routing, so you can decide which alerts you want to be notified of and how.
- Slack, Telegram, voice, and SMS alerting.
- Launched as 1.0 after extensive testing with Grafana k6.
Learn more about Grafana OnCall OSS in the announcement blog post and in the Grafana OnCall OSS documentation.
Grafana Phlare
Announced at ObservabilityCON just last month, Grafana Phlare is a horizontally scalable, highly available database for the storage and querying of profiling data. Here is a sampling of Phlare’s features:
- Easy to install with just one binary and no additional dependencies — just like Prometheus.
- Provides durable, long-term storage of your profiling data to help you identify changes and trends over time.
- Multi-tenancy and isolation make it possible to run one database for multiple independent teams or business units.
To help you use continuous profiling to understand your application performance and optimize your infrastructure spend, we’ve also released a Grafana data source for Parca, another open source profiling database as well as a flame graph panel in Grafana that can be used by anyone to build dashboards that display profiling data next to data from any number disparate data sources.
For more information, you can check out our ObservabilityCON keynote, our Grafana Phlare blog posts, and the Phlare documentation.
Grafana Faro
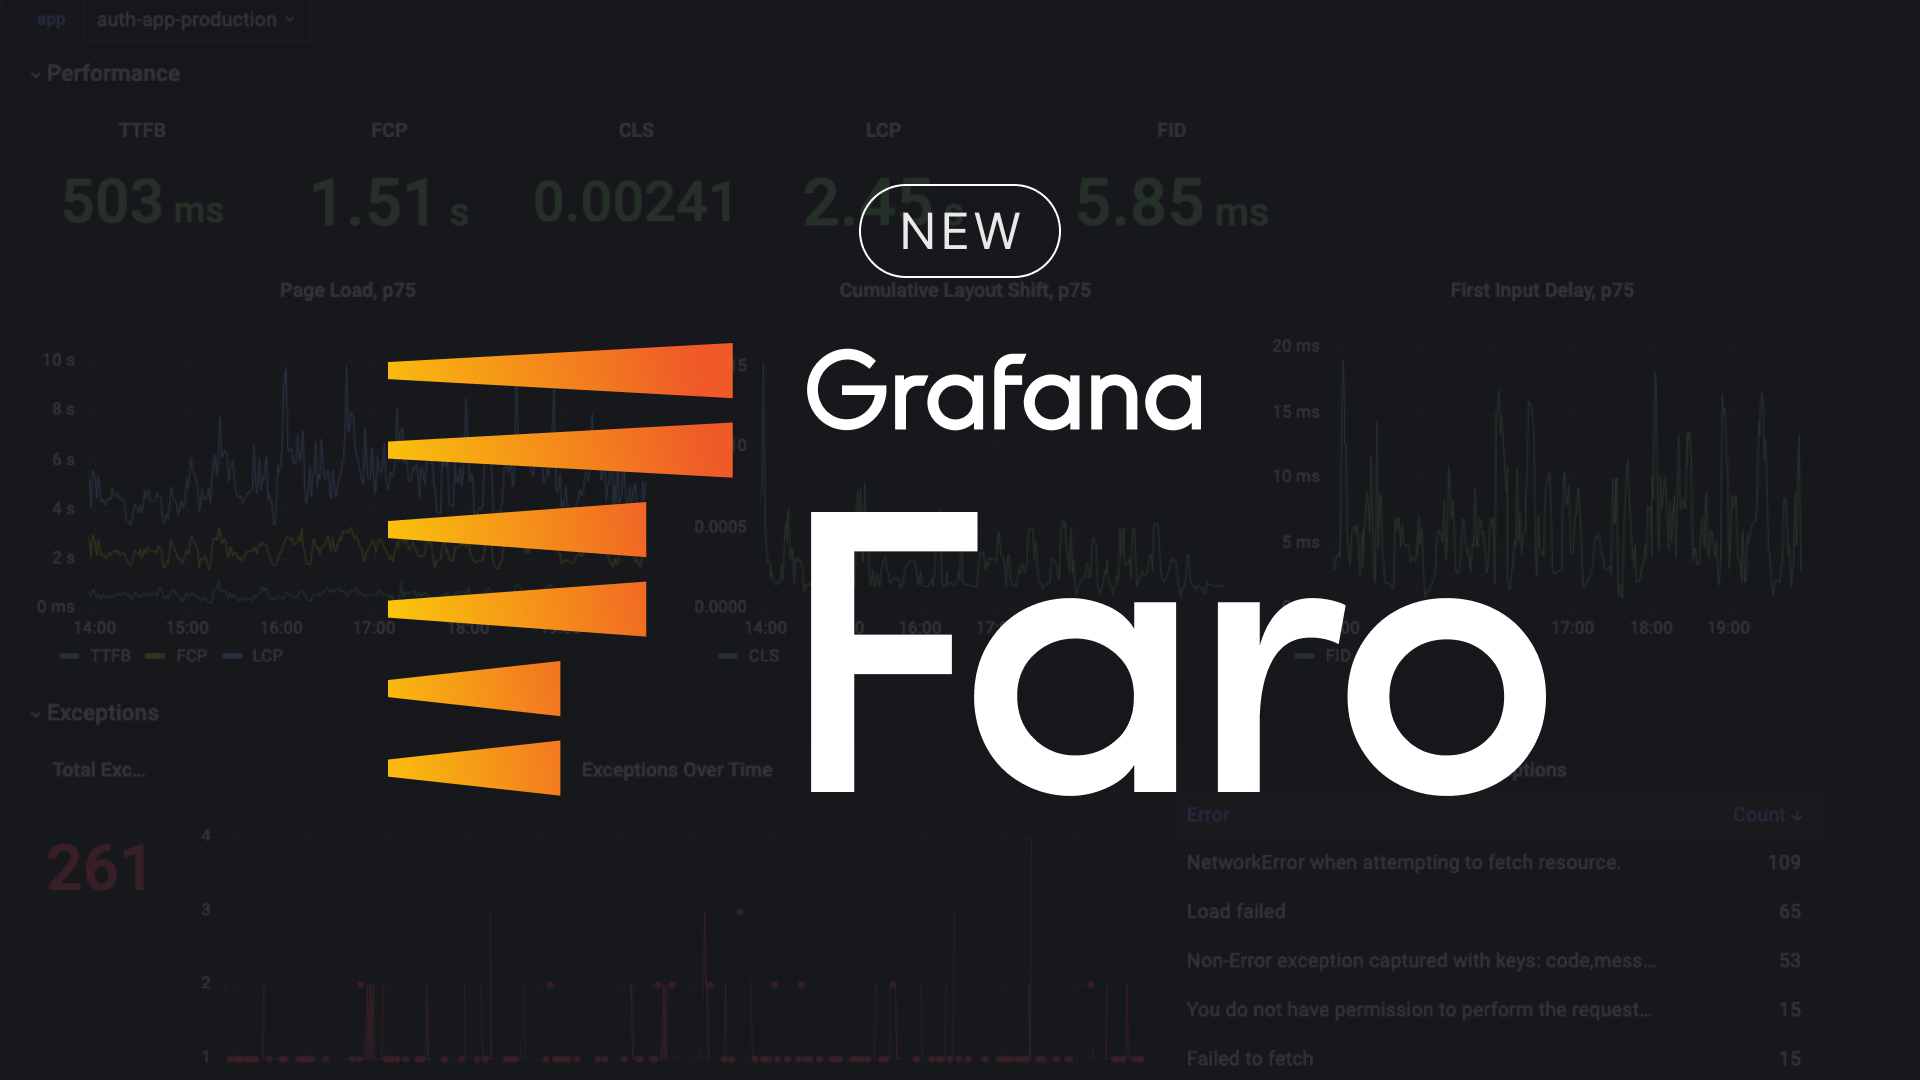
Also announced at ObservabilityCON, Grafana Faro is an open source project for frontend application observability. It captures observability signals, which can then be correlated with backend and infrastructure data for seamless, full-stack observability. Here’s what you need to know about Faro:
- Easy to embed frontend application observability with just two lines of code.
- Includes a highly configurable javascript web SDK to instrument the code that runs in your user’s browser.
- Saves the data to Loki and Tempo where it can be integrated with the rest of your data for full-stack observability.
Interested in hearing more? You can watch the ObservabilityCON keynote on demand or read the announcement blog post as well as the Grafana Faro web page.
Grafana Labs’ open source contributions to OTel, Prometheus, and more
We believe in a “big tent” philosophy, which means we prioritize interoperability with the wider open source observability ecosystem. And for our engineers, that means going beyond the Grafana Labs repos. “Aside from our projects, we’re also involved in other communities that work on projects that are in the inner orbit of Grafana Labs,” Dutt said. Here’s a quick glance at how we have enhanced other open source projects.
OpenTelemetry
- Launched an OpenTelemetry endpoint in the Grafana Cloud so that users can send OpenTelemetry data directly to the Grafana Cloud.
Learn more on our OpenTelemetry OSS page.
Prometheus
- Added out-of-order ingestion support to the TSDB.
- Designed and implemented native histograms.
- Contributed various memory optimizations, including 50% memory reduction in some cases.
- Speed up in WAL replay.
- Grafana Labs’ engineers Fabian Stäber, Josh Abreu Mesa, and Bryan Boreham were added to the Prometheus team.
OpenCost
- Contributed a fix for query start-end time alignment that, in our case, was degrading our Grafana Mimir SLO.
- Joined the OpenCost community meetings.
Grafanistas also contributed to the Terraform provider for Grafana (268 commits, 181 issues closed, 21 releases, but who’s counting?) and introduced support for Grafana Cloud, Grafana OnCall, and Grafana Alerting. There was also the Flagger K6 Webhook, Jsonnet language server, VScode Jsonnet extension.
We want to hear from you about your observability practice! Fill out our short and easy observability survey. All responses will be kept anonymous, and you’ll be helping the community get a better understanding of the state of observability.


