How to build a Formula 1 real-time analytics stack with Azure Data Explorer and Grafana Cloud
For Formula 1, speed is about more than just how fast you go around the track. It’s also about having data at your fingertips in real time to make critical improvements before, during, and after the race.
“Formula 1 is one of the most fascinating data-driven sports,” said Anshul Sharma, Senior Product Manager at Microsoft. “It’s so competitive that even one tenth-second advantage can change the outcome of the race.”
Sharma works on the team responsible for Azure Data Explorer (ADX), a big data telemetry analytics service, and he recently talked about the role of analytics in F1 at GrafanaCONline. In his session, “Formula 1 telemetry analysis with Microsoft Azure Data Explorer (ADX) and Grafana,” Sharma showed how race teams can make sense of telemetry data through a combination of ADX’s powerful analytics engine with Grafana’s advanced observability dashboards.

Chasing the checkered flag with data-driven decisions
An F1 car has 300 sensors that generate 1.1 million telemetry data points per second. That data is transmitted from the cars to the pits, and with 20 cars on a circuit at a given time, that translates to 160 TB of data being generated each race. These teams then use that data to design, test, and optimize changes that could lead to better outcomes.
For example, a sensor could detect an issue with the breaks or the driver could flag some issues with steering, which kicks off some in-race analysis that then leads to corrections to the car. They also use analytics tools and machine learning platforms to find relationships between data points and compare performances so they can make necessary tweaks before the next race.
“Data is extremely important to the sport, and [it’s] at the heart of what these teams do,” Sharma said.
How to solve F1 telemetry analysis with ADX and Grafana Cloud
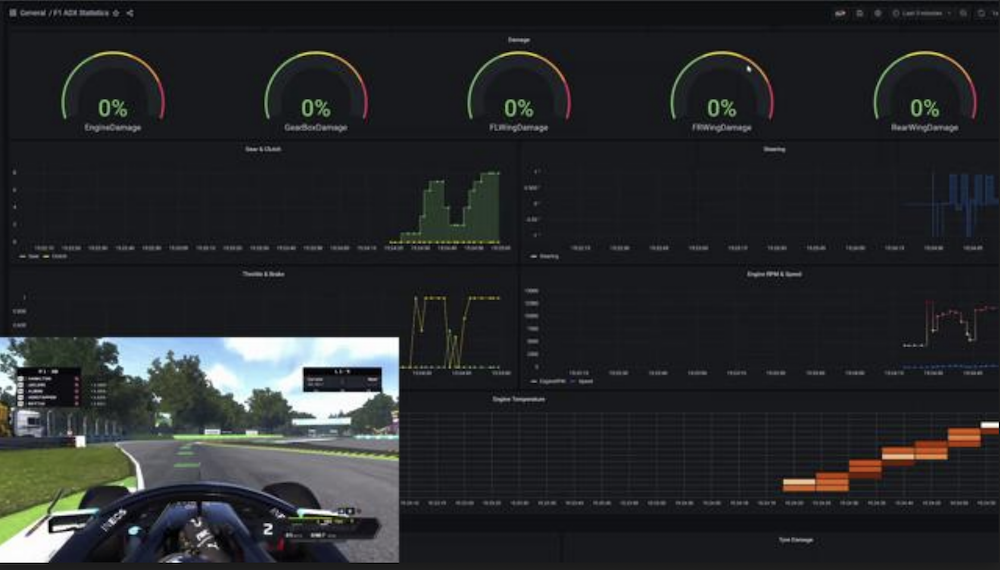
In his talk, Sharma put attendees in the shoes of an F1 team manager via a simulated race in an F1 video game. During the brief demo, the self-professed “video game junkie” shared a recording of himself racing the digital course, along with telemetry analysis visualized in Grafana Cloud.

As he went around the digital course, dashboards provided real-time data on things like tire wear, overall damage, engine temperature, RPMs, and speed. This analytics architecture he demoed could be used to visualize feedback, compare performances, and provide a reliability check to ensure everything runs smoothly.
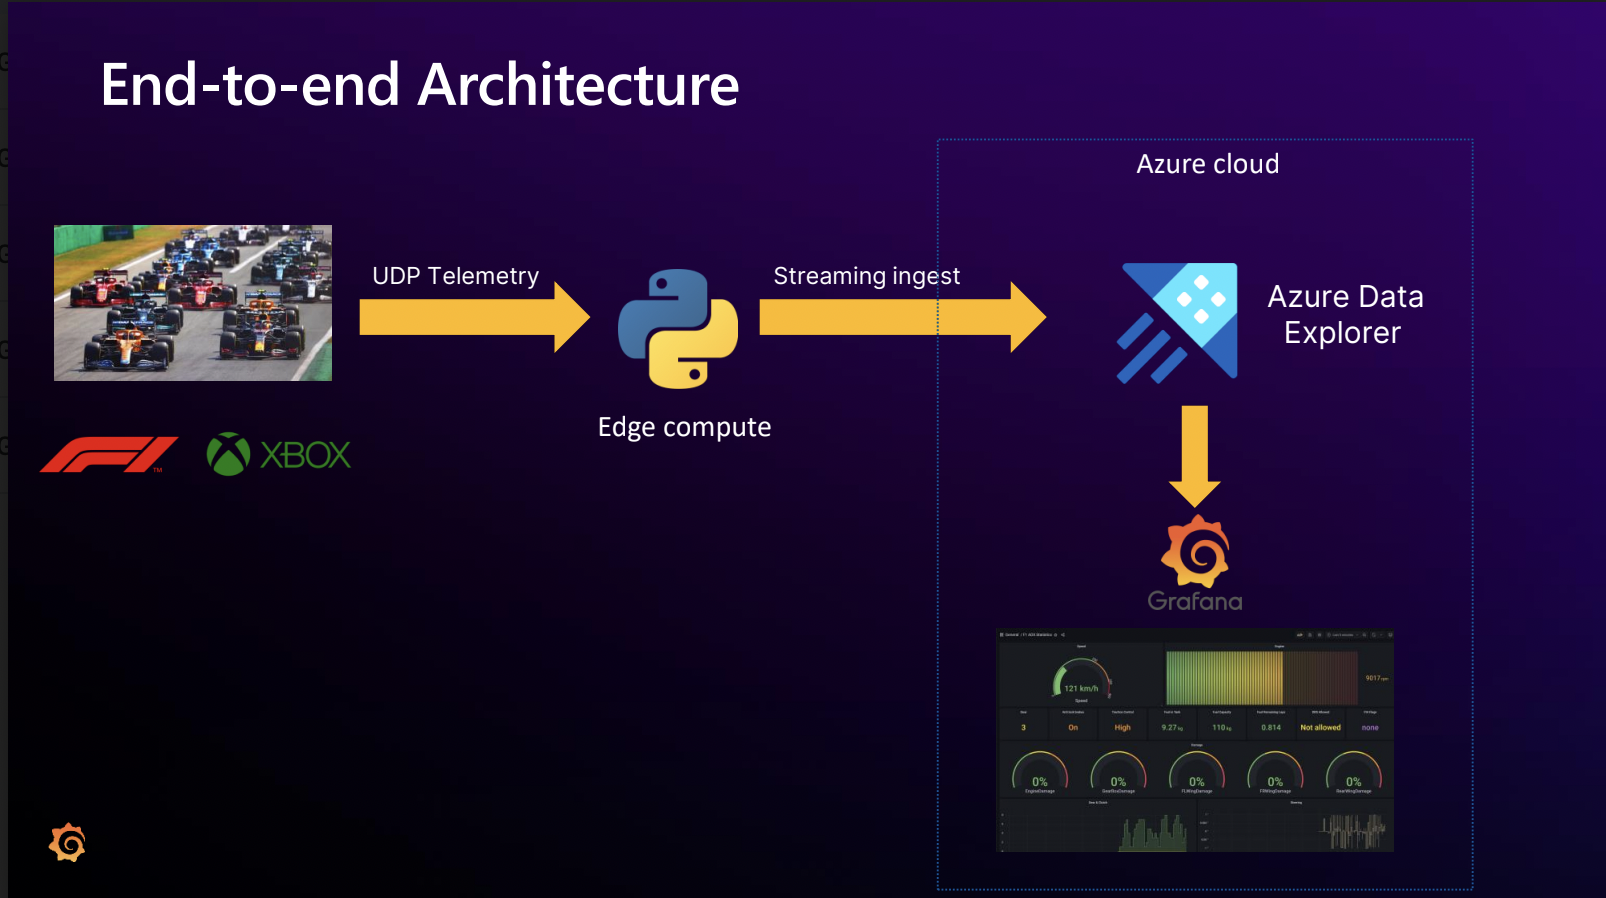
Sharma then walked through the near real-time analytics stack he used to achieve this. As you can see from the diagram below, a continuous stream of telemetry data generated by his local Xbox is sent to an edge compute node, where it’s ready by Python code.

The data is then passed and uploaded to ADX, which acts as the analytics platform. Finally, the data is sent to Grafana, which displays the real-time data from the car and race statistics.
ADX supports high volume, velocity, and variance — structured, semi-structured, and free text data. It’s optimized for interactive, ad hoc queries at petabyte scale, which makes it a great fit for this use case. They pair ADX with Grafana for several reasons:
- A first-class ADX plugin. You can use the ADX plugin to connect and visualize data seamlessly so you don’t have to write code or bridges; you just use a connector to configure based on credentials.
- Built-in dashboard components. Speed gauges, bar gauges, and more are closely aligned with how car engineers would visualize stats, so it’s easy for them to jump right in.
- Millisecond refresh rate. This supports the near real time experience analysis that is crucial to these teams. Grafana Cloud was also deployed in the same Azure region as ADX to lessen any latency concerns.
- High availability. Because Grafana Cloud is available via the Azure marketplace as a managed Grafana service, teams can trust the systems will remain available without having to worry about handling the scaling and other operational tasks.
To get the data out of ADX, Sharma used the Grafana query editor’s query builder mode, which helps define queries graphically. He noted that the query editor provides several options you can incorporate, such as parameters, conditions, filters, and more.
“It’s basically a guided wizard that allows you to build your query even if you don’t know the underlying KQL [Kusto Query Language],” he said. “It’s very important and very useful if you’re new to ADX.”
This same architecture could support other use cases, including retail, finance, and many more, Sharma said.
“The idea of near-real-time analytics and [the potential use cases supported by] combining Azure Data Explorer with Grafana as the visualization is far beyond what we spoke about today.”
Check out Sharma’s full GrafanaCONline session on demand now. You’ll learn how this stack could help your business, and you’ll get to see some of the Grafana dashboards he created that could help F1 teams improve their race performance.


