How Banco Itaú tracks 1.5B daily metrics on-prem and in AWS with Grafana and observability
Brazil’s Banco Itaú is the largest bank in Latin America, so when performance and uptime issues impact its applications, the reverberations can be massive.
“It can impact the whole economy of Brazil. It can damage other banks’ business too,” Ana Paula Genari Martin, SRE manager at Banco Itaú, said in her recent ObservabilityCON talk.
And keeping those applications running is no small feat, considering the size of their digital operations. Banco Itaú has roughly 16,000 technology employees working across 1,840 multidisciplinary teams, including 15,000 engineers working on multiple stacks. They also ingest 1.5 billion metrics per day across on-premises data centers and AWS.
Of course, no stack or team is perfect. Incidents will occur, and the SREs and operations and applications teams need to respond quickly. Or, as Martin put it jokingly, “Failure happens. Because of that, I have a job to do.” And no single team could possibly manage all that risk, which is why Banco Itaú built an observability platform that is delivered as a service to empower the entire business to respond to issues faster.
“My goal and my team’s goal is to enable the teams that are delivering value or customer-facing to leverage their ability to be resilient and achieve excellence during a crisis,” Martin said.

How to use Grafana to solve a puzzle with 1.5 billion pieces
Banco Itaú has been a pioneer in this space, having been the first bank in Brazil to build a webpage and digital presence. “We believe that technology is the thing that will help us keep our customers happy, loving us, and keeping this relationship really straight,” Martin said.
That forward-thinking mentality has translated to a large infrastructure footprint that generates huge amounts of data. They have approximately 2,000 AWS accounts, as well as nearly 13,000 on-premises hosts, and they ingest more than 1.5 billion metric samples every day through Prometheus.
To keep tabs on all those resources, they use Thanos, Prometheus, and Grafana for metrics; Splunk for logs; Yaeger for tracing; and AppDynamics for application performance monitoring. They also incorporate chaos engineering in production to better guard against future issues.

And while Banco Itaú has a 50-person team handling operations, that’s not enough to deal with the flood of tickets that could come from such a massive organization. That’s why they built an observability platform as a service, so everyone had access to the information.
“It’s important to us that people can use this as a service because we won’t be able to attend to everyone if they just open lots of tickets every time they want to build a dashboard, or change an alarm or alert,” Martin said.
To support this journey, they built a huge library of documentation so users are empowered to handle these tasks themselves. There’s also a question-and-answer site similar to Stack Overflow where users can submit questions that are reviewed by engineers on Martin’s team. If questions arise repeatedly, the solutions are then added to the documentation.
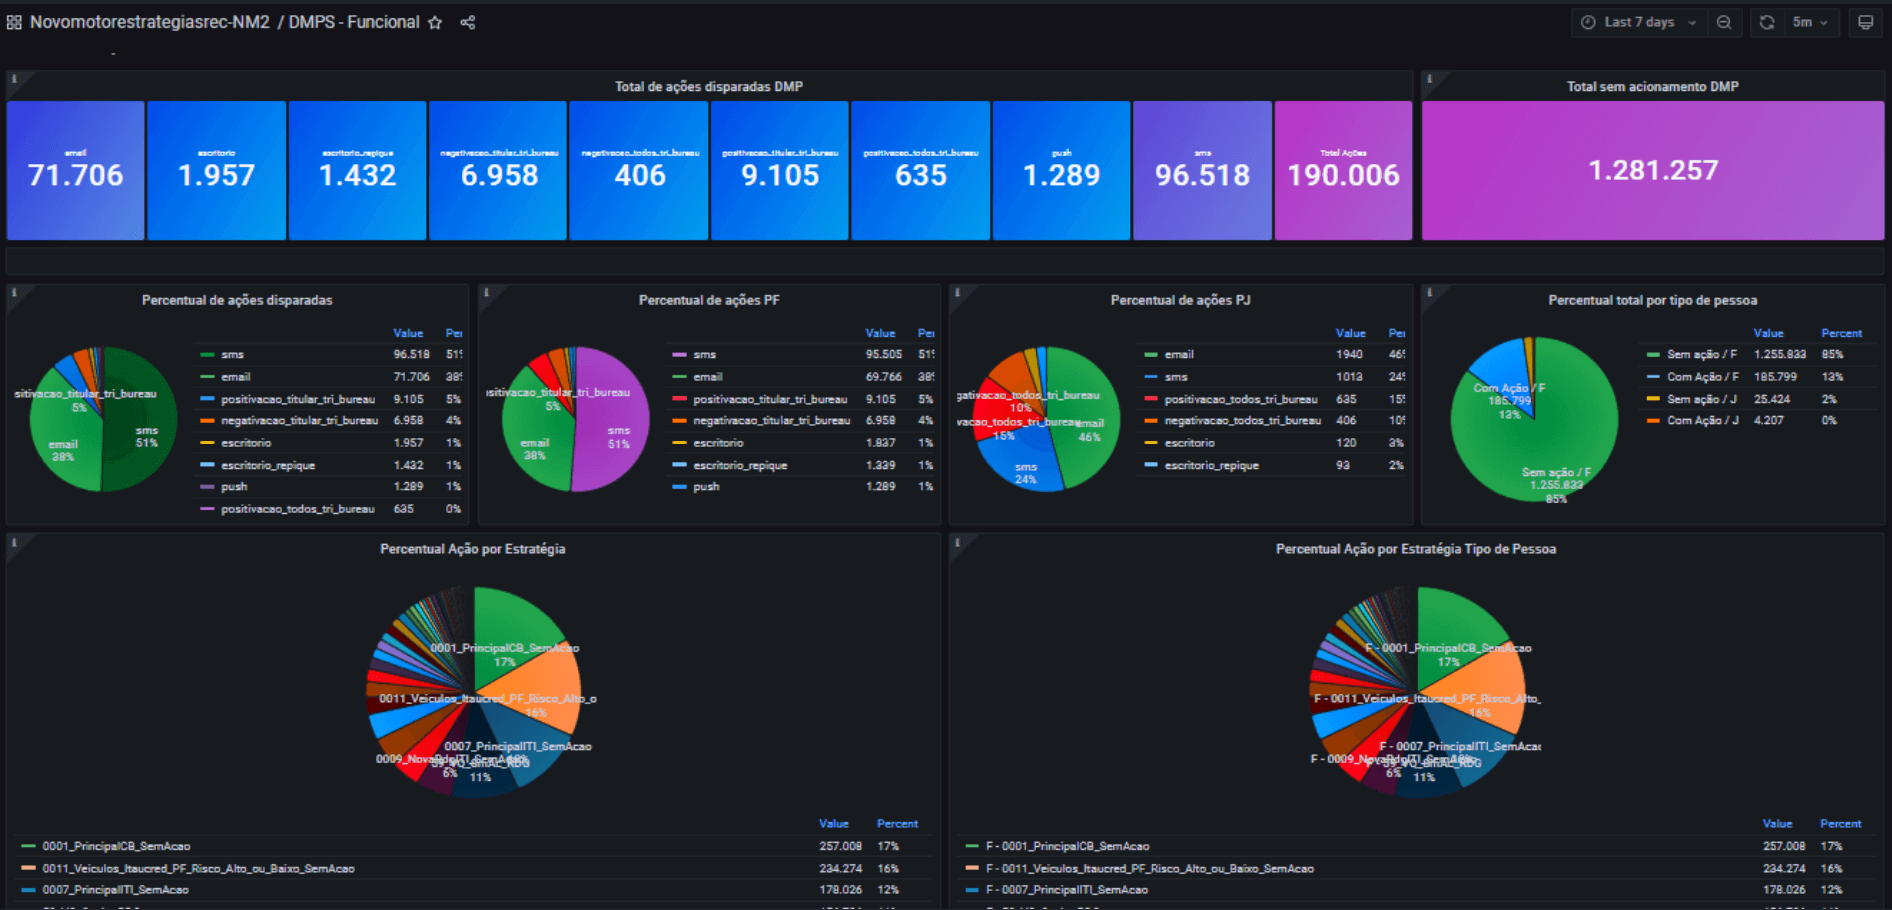
Today, they have more than 500 Grafana organizations and approximately 4,500 dashboards to help visualize data and improve observability. There are limits on who can edit those dashboards, but anyone within the company can view or share them to get better insights.
“We’re using Grafana to understand what’s happening, make sense of it, and react during an incident,” Martin said.
Managing the move to AWS, and what comes next
Grafana has been a key part of Banco Itaú’s adoption of AWS. The bank intends to move half of its on-premises infrastructure to the cloud by the end of the year, including transitioning away from legacy mainframes, to better serve changing customer needs. They’re using Grafana to monitor their digital channels hosted in the cloud.
“Our customers are [going] digital,” Martin said. “No one goes to the office anymore, they use smartphones or bank online, so it’s important we have good performance.”
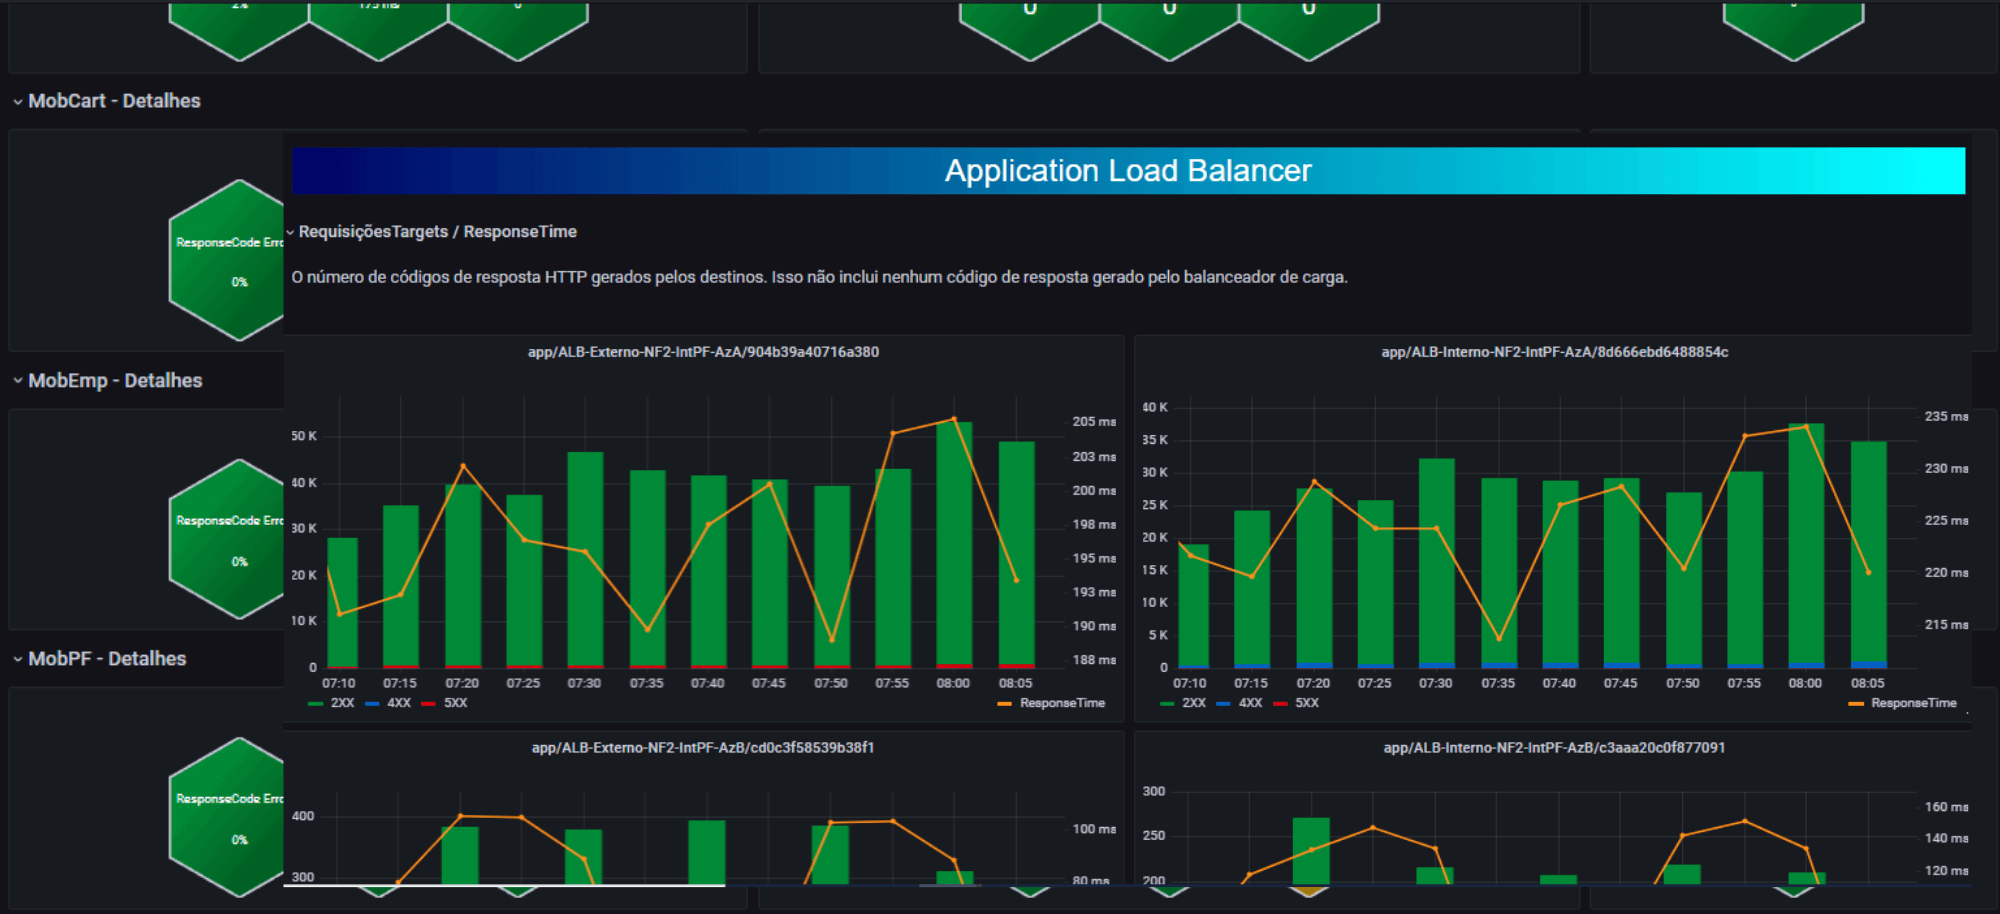
Early on in the move, there was an internal AWS sub-release that impacted their digital operations, so the two juggernauts have developed a system to avoid those types of incidents in the future. They set up traffic light dashboards in Grafana that provide a high-level overview of performance on critical infrastructure components, including AWS Auto Scaling, Elastic Load Balancing, and AWS Global Accelerator.
“If AWS makes a change in any of these pieces, they can come and see on this dashboard or even receive an alert [from Alertmanager] … so they can be warned if something they do impacts Banco Itaú,” Martin said. “We collaborate so we can respond really fast if something goes down or if we’re interfering in each other’s business.”
If one of those lights isn’t green, users can click on it to get additional details. For example, with Application Load Balancer, they can click on the corresponding traffic light icon in Grafana to get more details and better understand the behavior inside their environment.

They’re also going higher up the stack, monitoring their AWS-hosted applications and business metrics to ensure customers are able to follow the journey as expected. For teams that are further along in their observability journey, they can marry their expertise in user behavior with the signals from Grafana to more easily identify potential customer problems.
Going forward, Banco Itaú is looking to adopt SLIs and SLOs to follow SRE best practices. They also plan to build a single pane of glass in Grafana so the team isn’t constantly switching between tools for logs, metrics, tracing and incident response.
As part of those consolidation efforts, they’re also looking at a hybrid approach for logs, with the potential to add Grafana Loki to the mix. And while they rely heavily on Thanos, Martin said it does have some challenges, so they’re looking at Grafana Mimir to supplement their Prometheus storage needs.
Check out the full Banco Itaú talk on demand to find out more about how they manage site reliability and performance at scale. And there’s plenty more ObservabilityCON content to explore, including news about Grafana Labs’ latest open source projects and sessions led by experts from JPMorgan Chase, Wells Fargo, Adobe, and more!


