Introducing the Cilium Enterprise integration in Grafana Cloud for Kubernetes network monitoring
The shift toward building modern applications as a collection of API-driven services has many benefits, but let’s be honest, simplified monitoring and troubleshooting is not one of them. In a world where a single “click” by a user may result in dozens, or even hundreds, of API calls under the hood, any fault, over-capacity, or latency in the underlying connectivity can (and often will) negatively impact application behavior in ways that can be devilishly difficult to detect and root cause.
This leaves application and Kubernetes platform teams in a challenging place: Connectivity observability is more critical than ever, but achieving it is more difficult than ever.
Last month, Grafana Labs announced a strategic partnership with Isovalent, the creators of Cilium, to meet this challenge head on. Together we are making it easier to gain deep insights into the connectivity, security, and performance of the applications running on Kubernetes by introducing the Cilium Enterprise integration on Grafana Cloud.
Why Cilium Enterprise and Grafana Cloud?
Cilium is an open source project that delivers eBPF-powered networking, security, and observability for cloud native environments such as Kubernetes and other container orchestration platforms.
Cilium allows you to apply and monitor policies for L3, L4, and L7 network flows in your stack so you can observe and block traffic, along with applying network policies based on labels.
It’s a super flexible approach that is powered by eBPF, a revolutionary new Linux kernel technology co-maintained upstream by Isovalent. Rather than leveraging legacy kernel network functionality like iptables, Cilium was built using an eBPF-based approach, which enables a highly efficient and powerful connectivity and security fabric that has observability built in as a first-class citizen. Cilium runs a single agent within the cluster and an operator and instruments everything on an application level.
Isovalent Cilium Enterprise is the hardened, enterprise-grade offering from Isovalent, which provides additional features for enterprise use cases and scale. This integration is intended for use with Isovalent Cilium Enterprise, and does not support Cilium open source software.
With the Isovalent Cilium Enterprise integration for Grafana Cloud, the data from a Cilium Enterprise deployment can be funneled to Grafana Cloud, where multiple user personas can benefit from the dashboards, metrics, and alerts that come packaged in the solution. System administrators who care about the base cluster can get information on Kubernetes events that are occuring, see the current status of the cluster(s) under observation as well as data on network usage. DevOps teams can aggregate information that they can then use to troubleshoot their applications. There are networking engineers who can dive into more detail than system administrators might want to, as well as SREs and the Dev Sec Ops orgs who can come away with a deeper understanding of their applications and how they abide by existing security policies.
Grafana dashboards for Cilium Enterprise
The new Cilium Enterprise integration in Grafana Cloud makes it easy for teams to get started with monitoring and maintaining their Kubernetes networking layer. The integration comes with four prebuilt dashboards that help you drill down and extract meaningful insights, ranging from a broad overview of your Kubernetes cluster down to specific network traces between pods.
Cilium overview dashboard
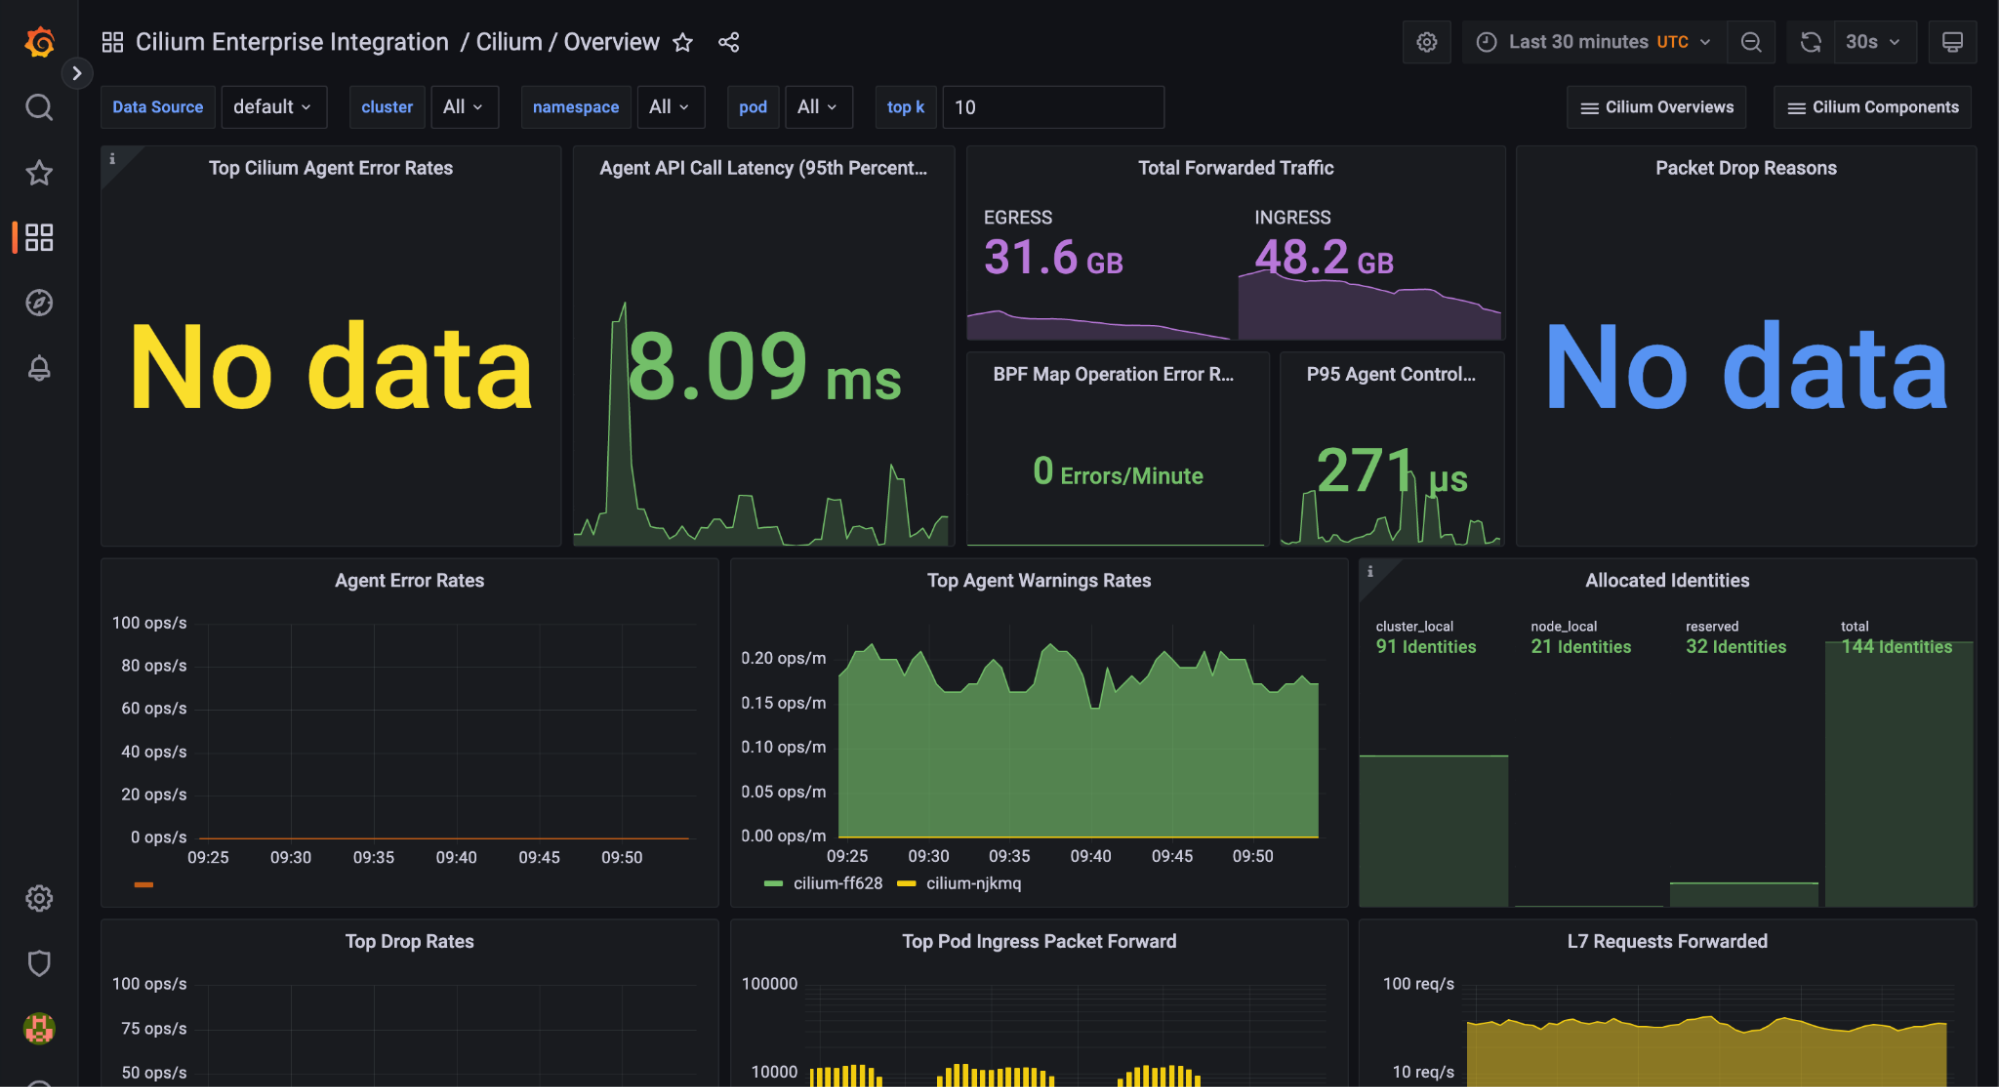
The Cilium overview dashboard shows general cluster status and information such as errors, API latency for the Cilium Agent, and total amount of traffic — a little bit of everything for everyone.

The dashboard includes data on Kubernetes events recorded and consumed as well as BPF map operations for traffic agent controller runs. There’s also networking information represented in the dashboard, such as L7 requests, Ingress packages, drop rates, and more.
Hubble overview dashboard
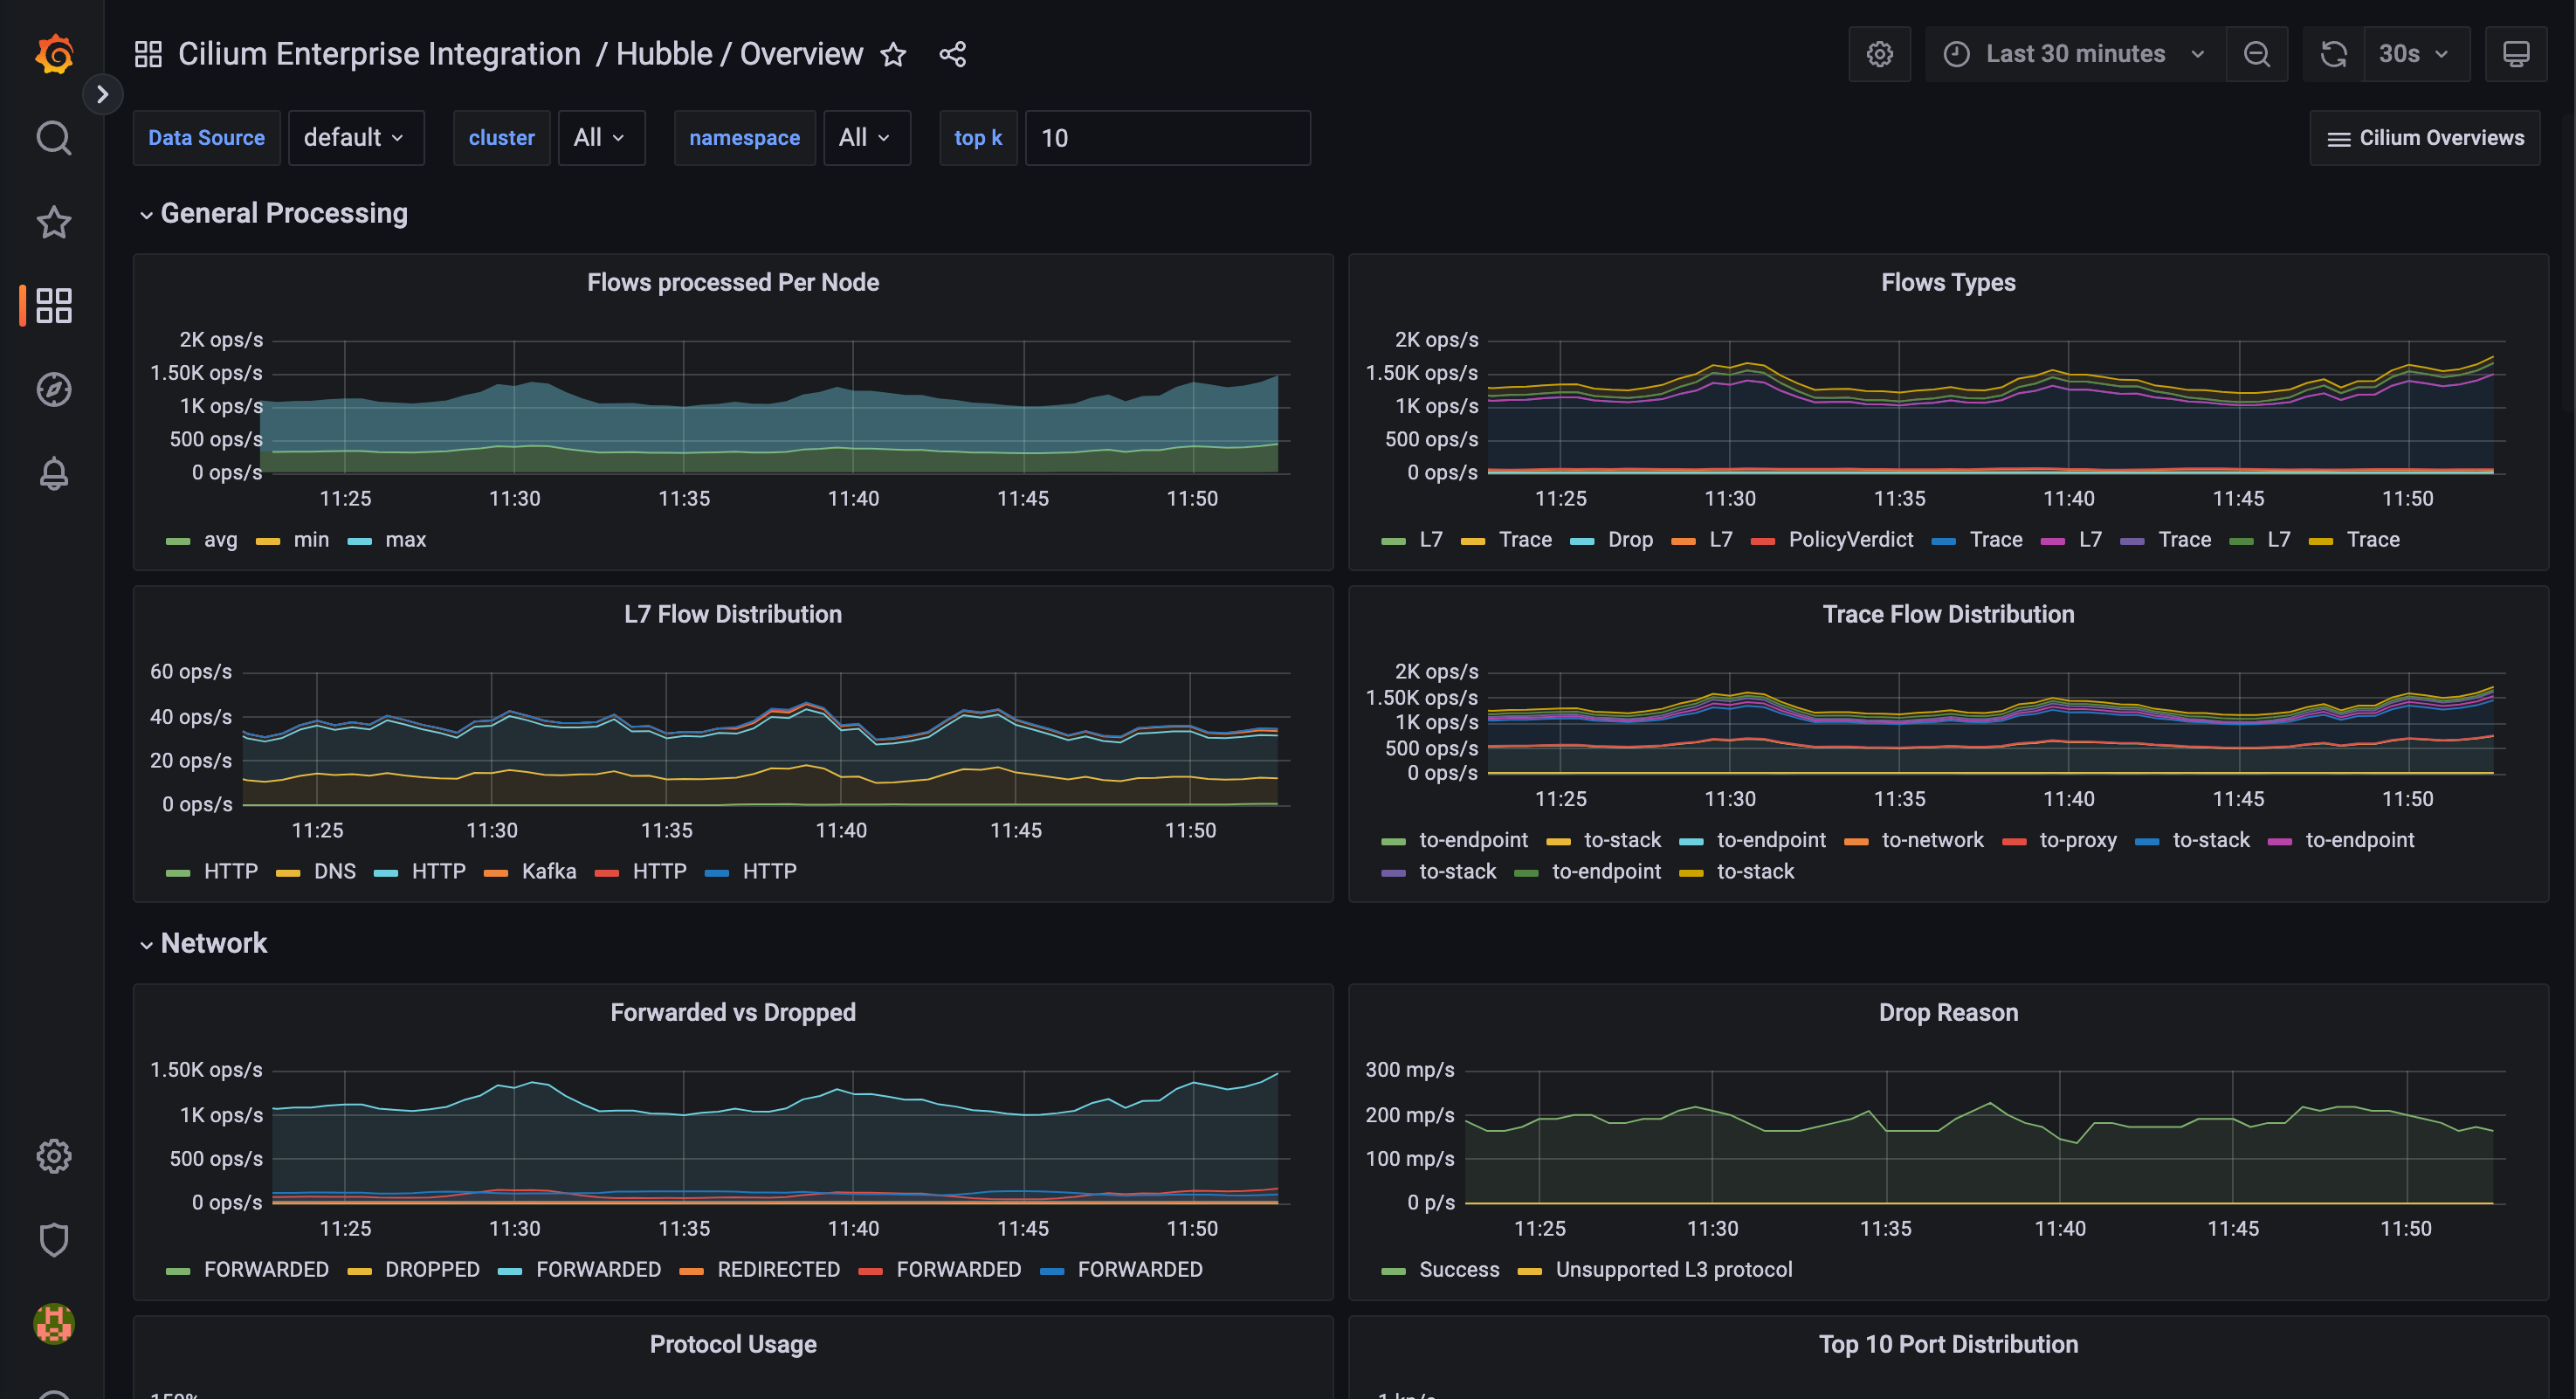
Hubble is a fully distributed networking and security observability platform for cloud native workloads that runs on top of Cilium. It provides detailed data on the network flows within your cluster, including how many flows are happening in the cluster, flow types, and flow distribution traces. With more than 21 different visualizations within this prebuilt Grafana dashboard, you can drill down into a network policy and also dive into a wide variety of visualizations of HTTP metrics.
You’ll ultimately collect system-level information about your Kubernetes cluster, about its networking, and about various components — all in a standard Prometheus format that can be scraped with the Grafana Agent.

There is also an additional visualization to help users who leverage Hubble Timescape, an observability and analytics platform to store and query all the observability data that Cilium and Hubble are able to collect. This dashboard helps with meta monitoring the Timescape application itself, tracking how well it performs. (Note: Hubble Timescape is only available on the enterprise version of Hubble.)
Cilium operator overview dashboard
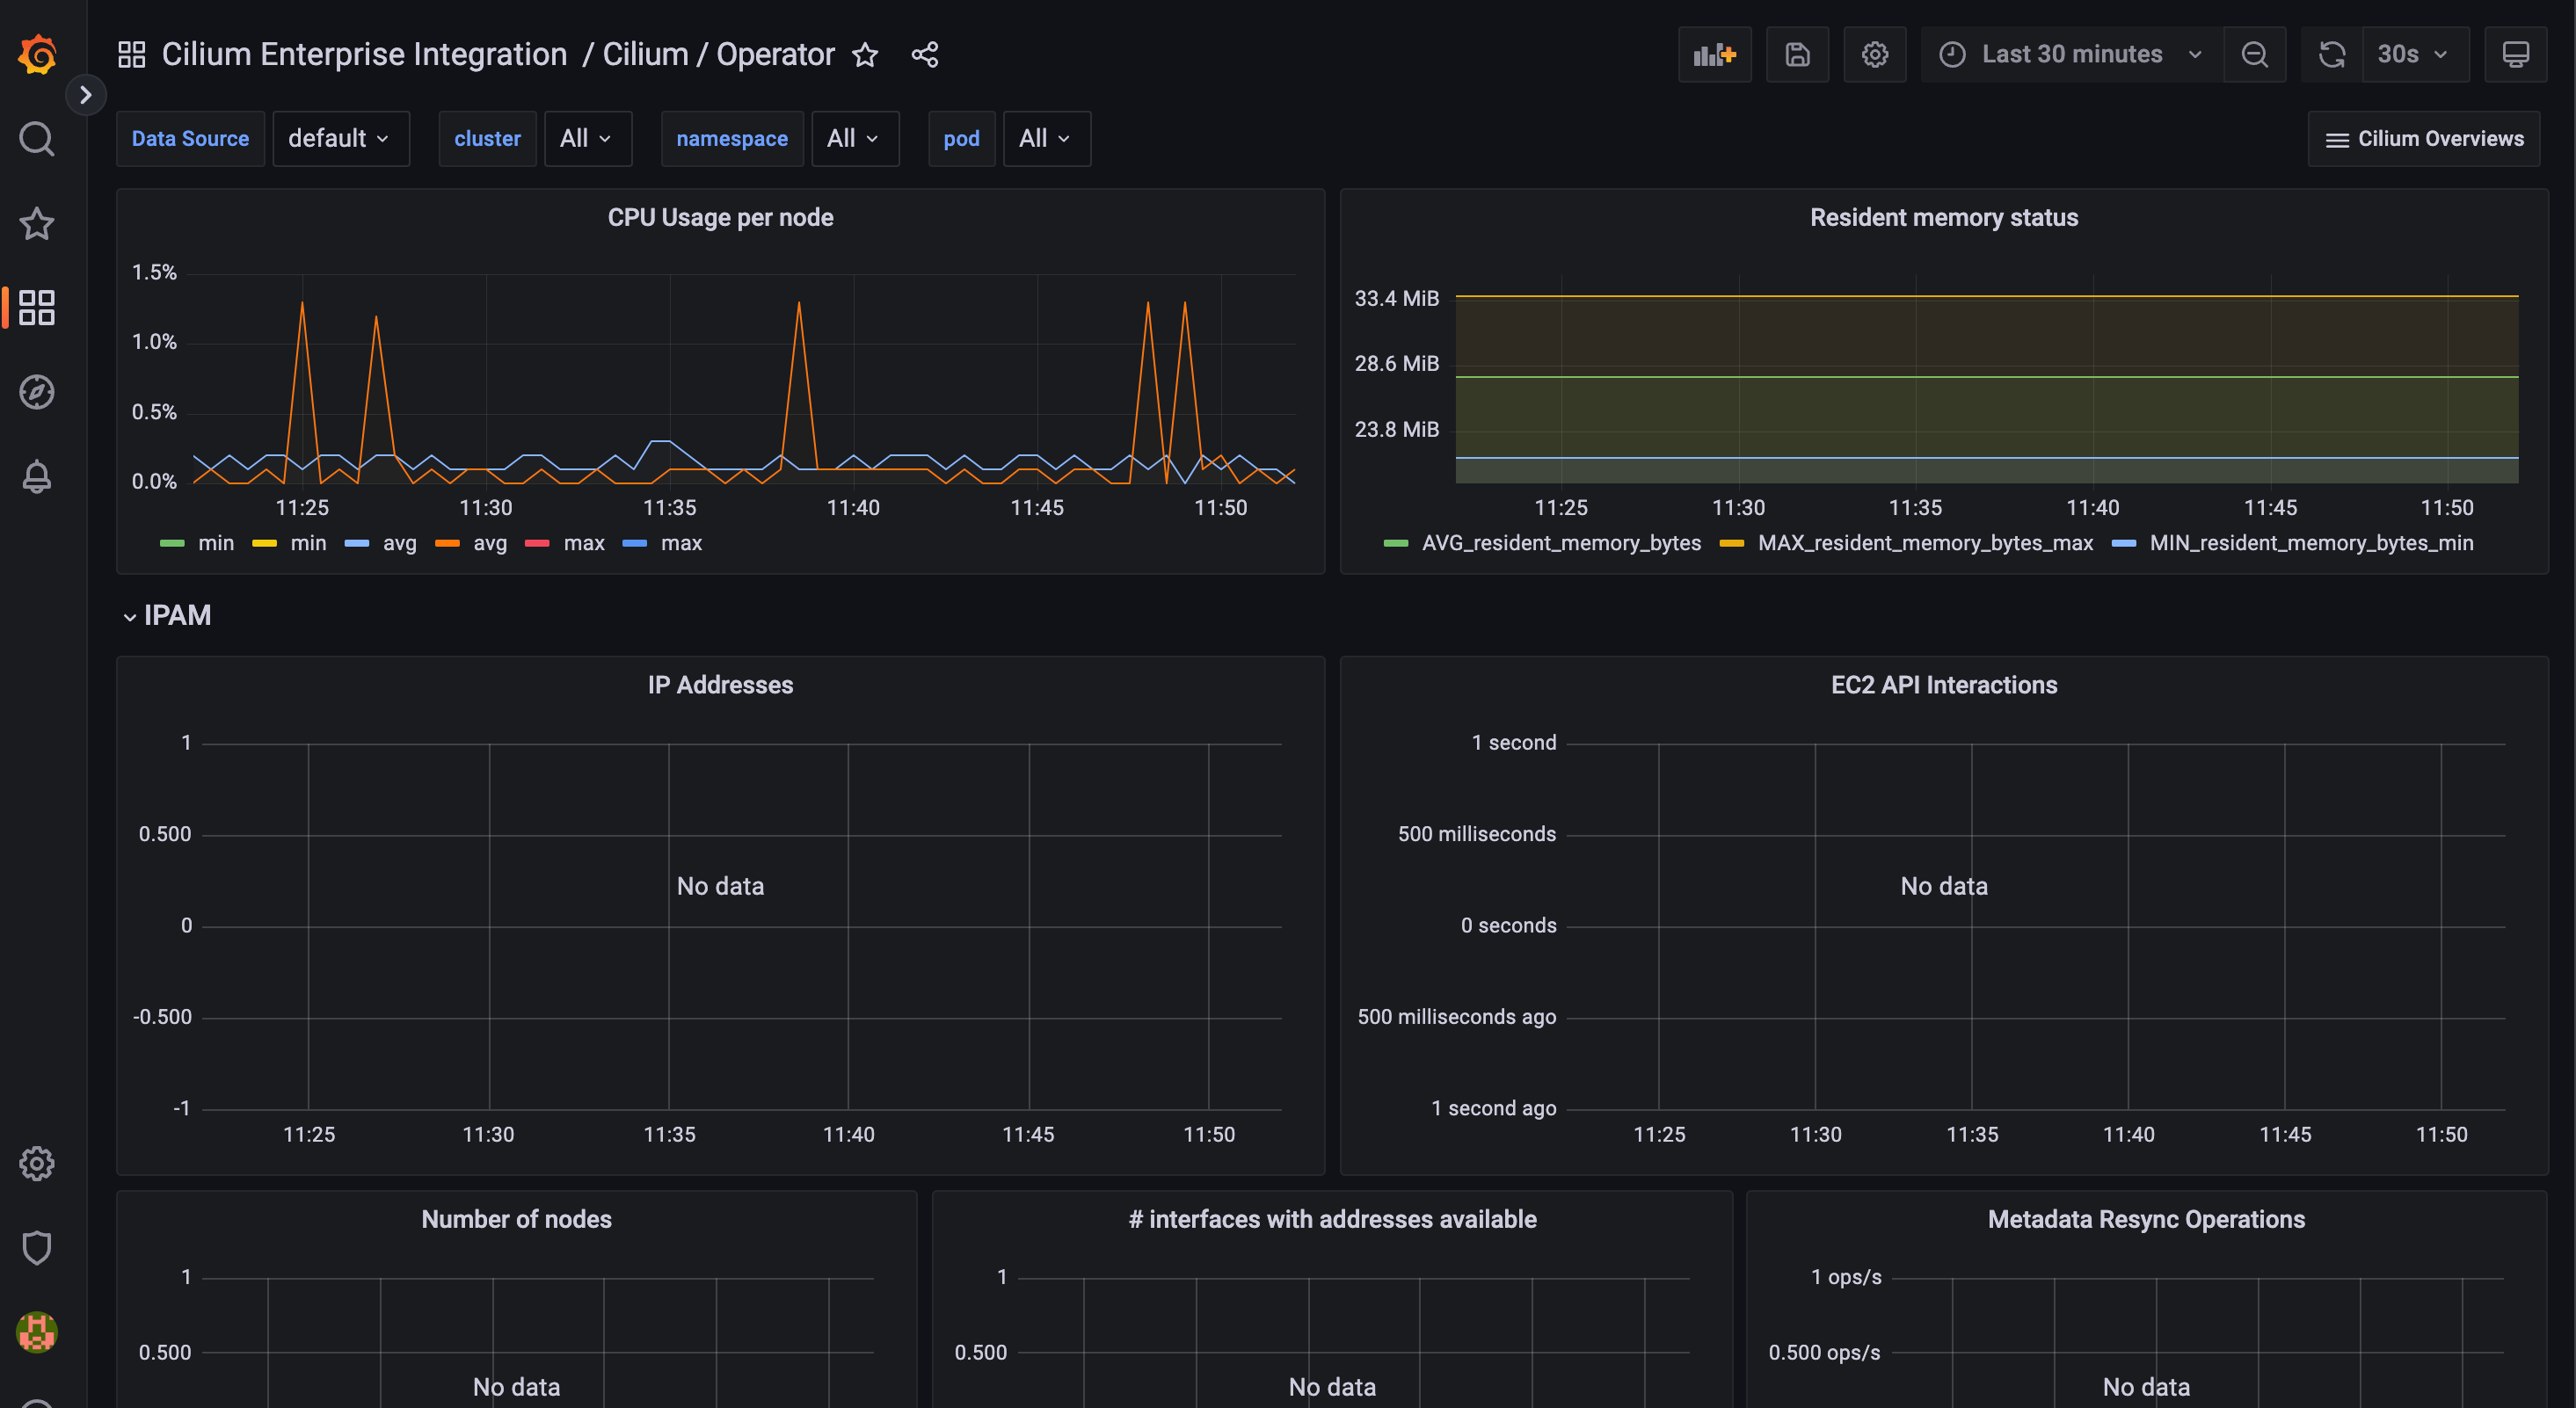
We offer support for monitoring the overall state of your Cilium Enterprise deployment with the Cilium operator overview dashboard, which helps track the resource utilization of the operator.

Cilium Agent overview dashboard
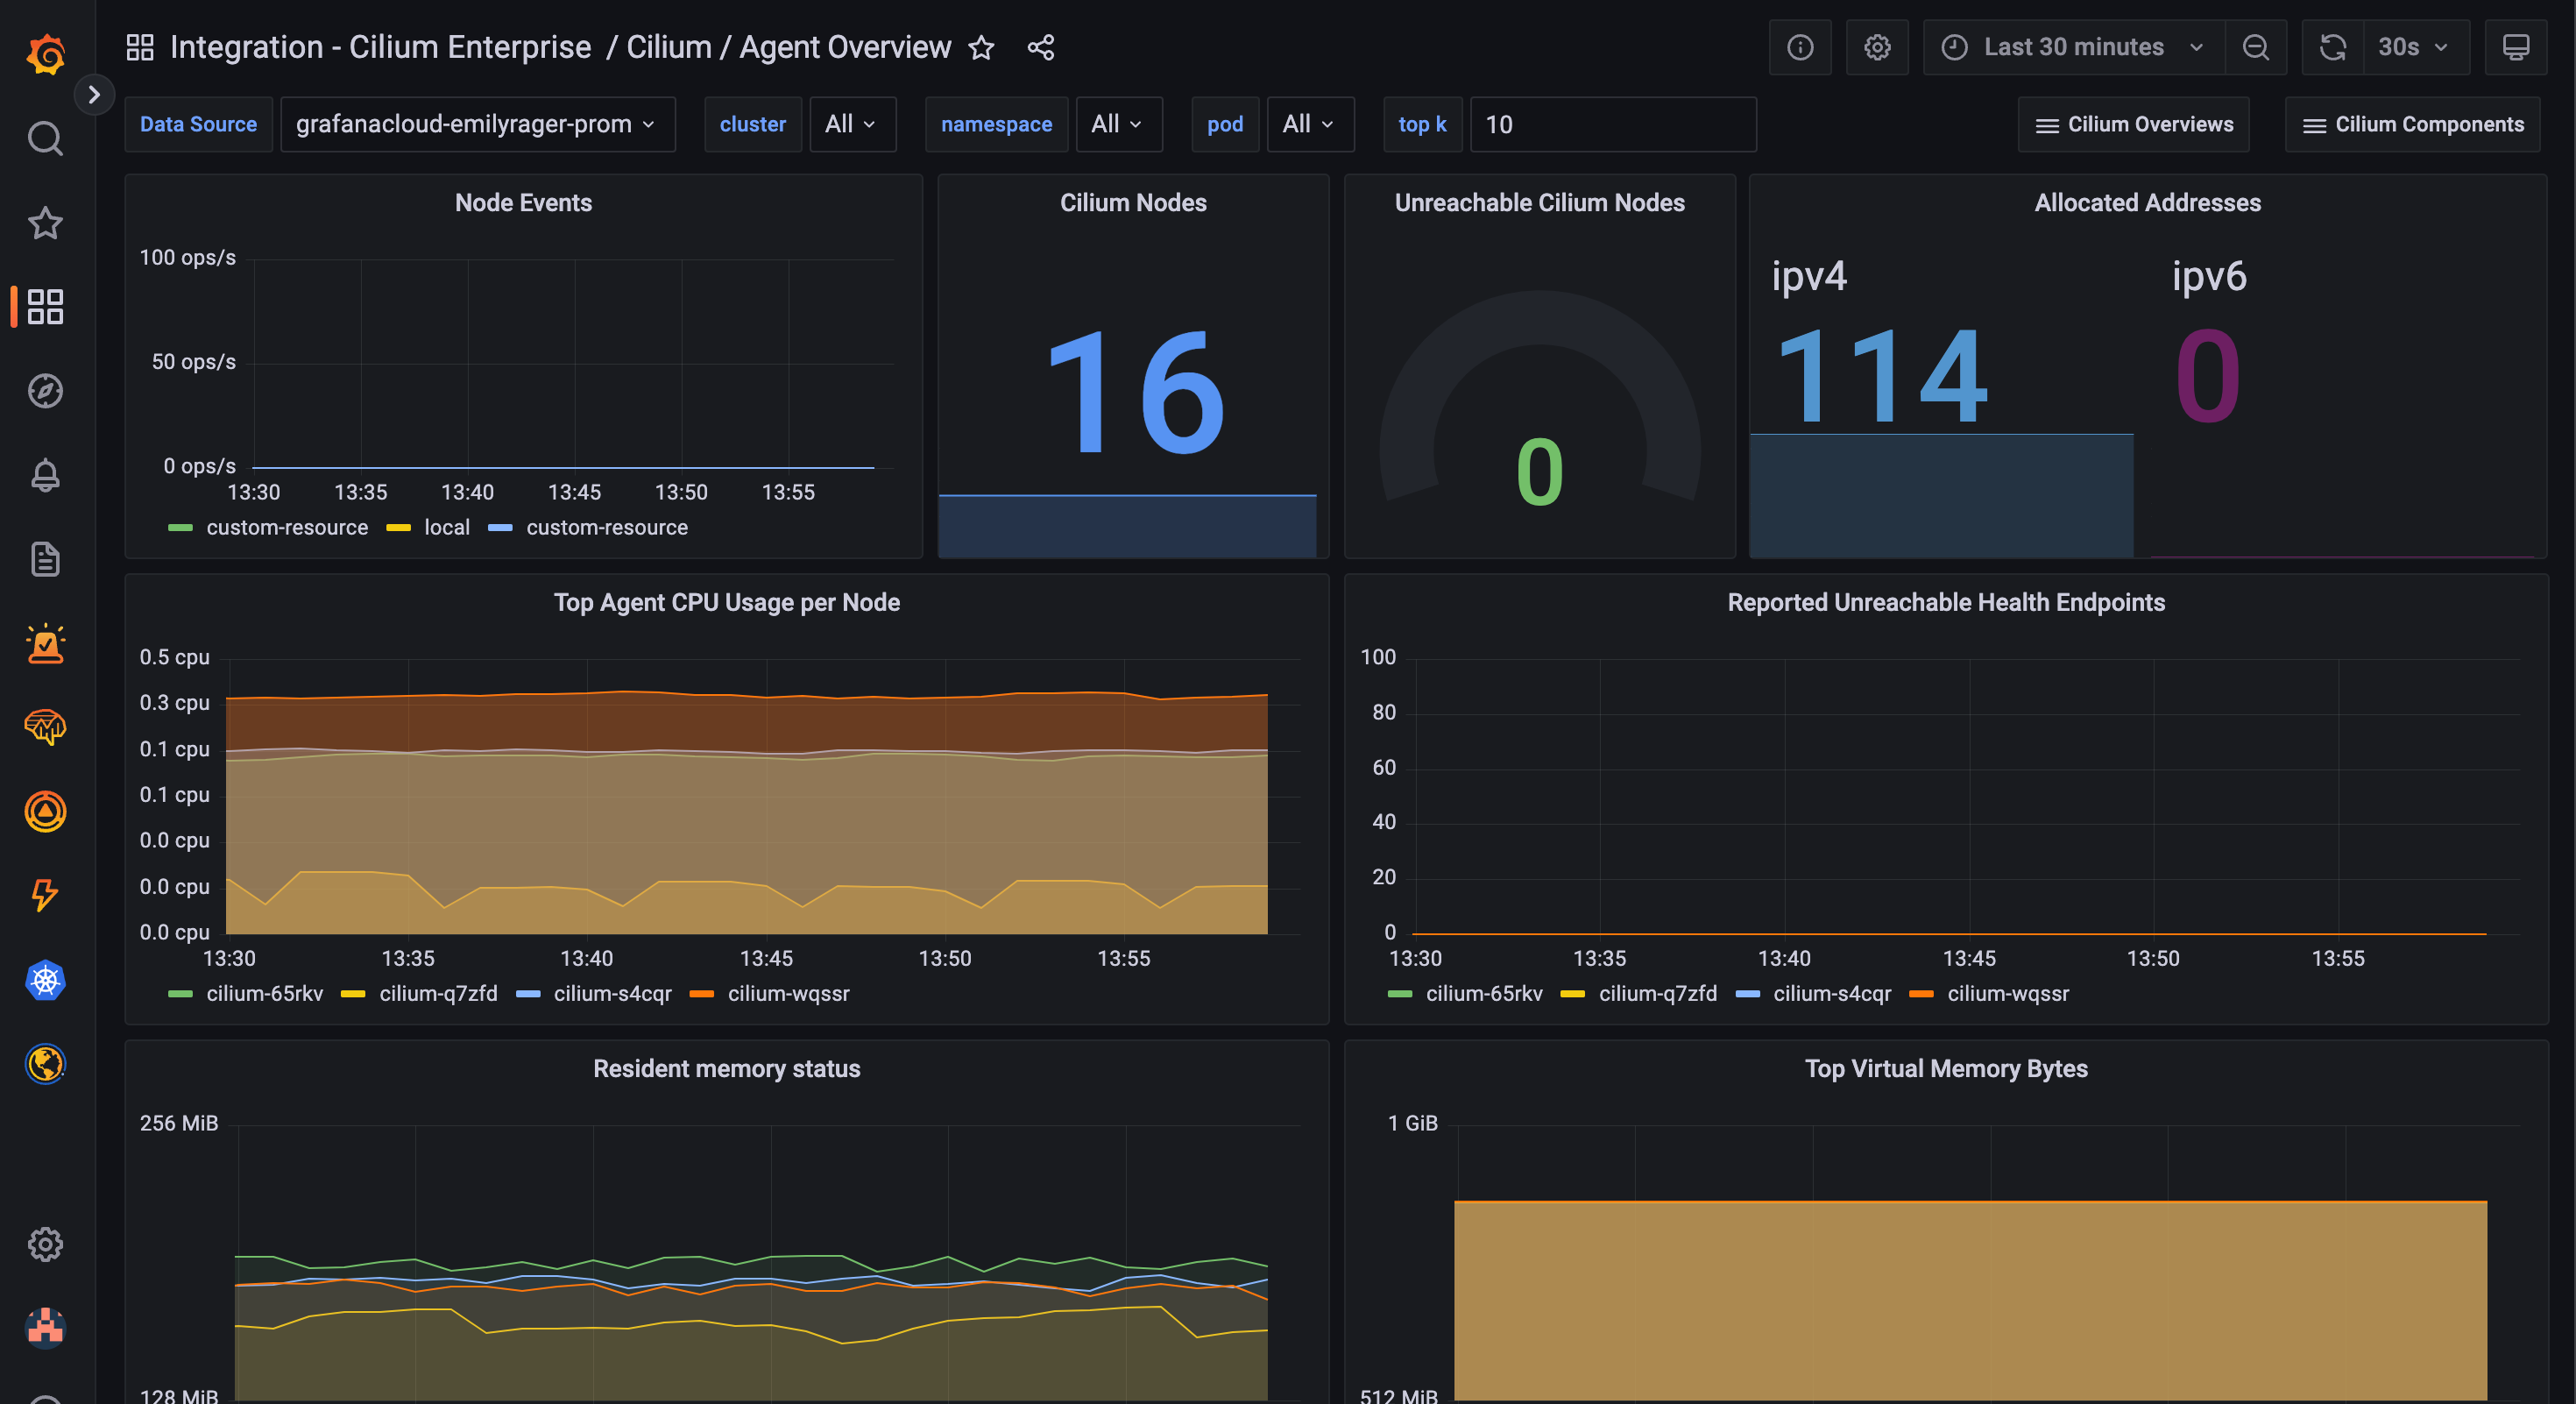
One of the most popular Grafana dashboards in the Cilium Enterprise integration is the Cilium Agent overview dashboard, which allows for meta monitoring your Cilium Enterprise deployment.
The Kubernetes-related panels meanwhile monitor more of the Kubernetes state than the default Kubernetes deployment and allow you to see the events that are being received and consumed as well as the API server calls that are being made or if any of them are dropped.

Grafana alerts for monitoring Cilium Enterprise
In the Cilium Enterprise integration for Grafana Cloud, there are 17 alerting rules that were curated and created specifically by Isovalent, the company behind Cilium, to help you monitor your Cilium Enterprise deployment. The alerts monitor core Cilium components that relate to the Cilium Agent and the state of the Kubernetes clusters. They range from tracking warnings to monitoring critical data points such as endpoint errors (when API calls to Cilium endpoints API are failing due to server errors or to the Cilium Agent encountering a high drop rate due to network policy rules), so you can ensure that your policies aren’t blocking the Cilium system from observing itself.
There are also alerts for when endpoints are in an invalid state as well as for how many API calls are being updated and whether or not they’re failing. In addition, for tracking identities, there is an alert available that warns you when you are approaching the limit to the number of identities you can have per node.
Learn more about Cilium Enterprise in Grafana Cloud
To get started, check out the Cilium Enterprise integration documentation and the Cilium Enterprise solutions page. If you give the integration a try, let us know what you think! You can reach out to the team in the #Integrations channel of the Grafana Labs Community Slack.
Grafana Cloud is the easiest way to get started with metrics, logs, traces, and dashboards. We have a generous forever-free tier and plans for every use case. Sign up for free now!


