How to correlate performance testing and distributed tracing to proactively improve reliability
Update: Grafana k6 load and performance testing is now available natively in Grafana Cloud. Existing k6 Cloud customers will not be impacted; they will be migrated to the new experience at a later date. Get started with Grafana Cloud k6 →
At ObservabilityCON, we announced our first step towards launching a native integration between Grafana k6 load testing and Grafana Tempo tracing (k6 x Tempo) in Grafana Cloud. We created k6 x Tempo to help dev, testing, and operation teams analyze their performance test results more effectively and proactively improve the reliability of their business-critical applications.
The challenges in understanding and acting on performance test results
Reliability is important. End users care about the services they use being reliable as it’s directly linked to the quality of service they are getting. Sadly, being reliable is no easy task. Also, reliability is journey, not a destination, so companies are at different stages depending on their maturity.
One practice you can adopt to improve your reliability is performance testing.
We at Grafana Labs maintain Grafana k6, a cutting-edge, open-source, performance testing tool built for and by developers that makes the process of building and maintaining your test suite easy and efficient. However, analyzing the results from a performance test is not always a pleasant experience. Oftentimes it is daunting, error-prone, and time consuming.
We have been working hard on k6 Cloud, our SaaS offering, to make this analysis process as smooth and seamless as possible with the addition of new features and tools, such as Performance Insights, that significantly reduce the time it takes to understand what’s happening under the hood.
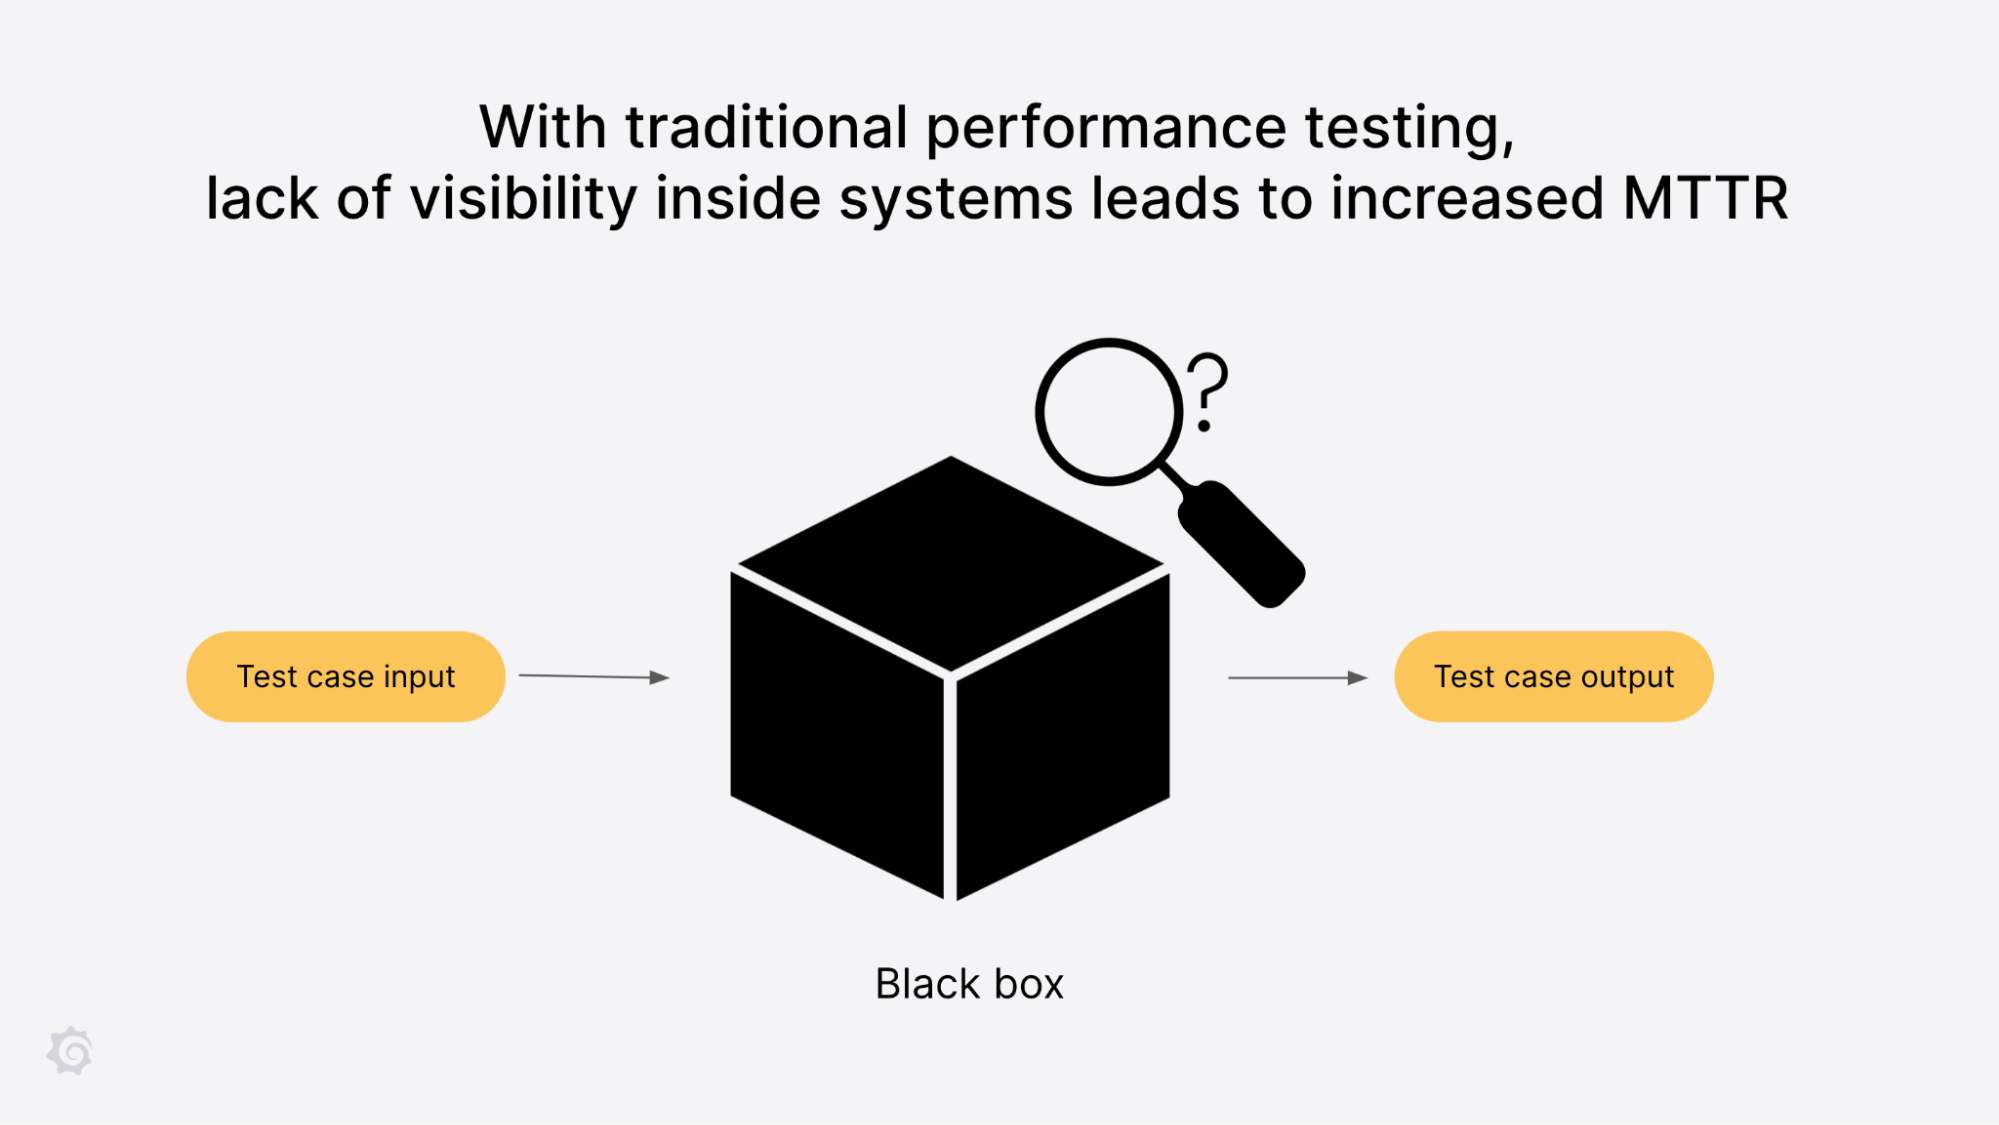
Still, a few problems persist. There has been a wall that separates what your performance testing tool sees and what happened internally to the systems being tested. In order to understand what happened, you have to jump between multiple tools, correlate things in the air, and throw a bit of imagination and magic into the mix. Also, over the past few years, it has become more and more challenging to analyze test results with internal complexity skyrocketing, both from a technical (e.g., microservices and distributed systems) and organizational standpoint (e.g. more smaller-sized agile teams).

That’s why we built k6 x Tempo, an industry-first integration between distributed tracing and performance testing.
Introducing k6 x Tempo
Built natively into Grafana Cloud, the open, composable observability platform, k6 x Tempo closes the gap between black box data from performance testing and the internal white box data of the system under test. The integration generates useful aggregations, correlations, and actionable insights from users’ tracing data to help them understand their performance tests and reduce MTTR, ultimately preventing reliability problems from impacting end users.
Correlate k6 test run data and server-side tracing data for effective root cause analysis
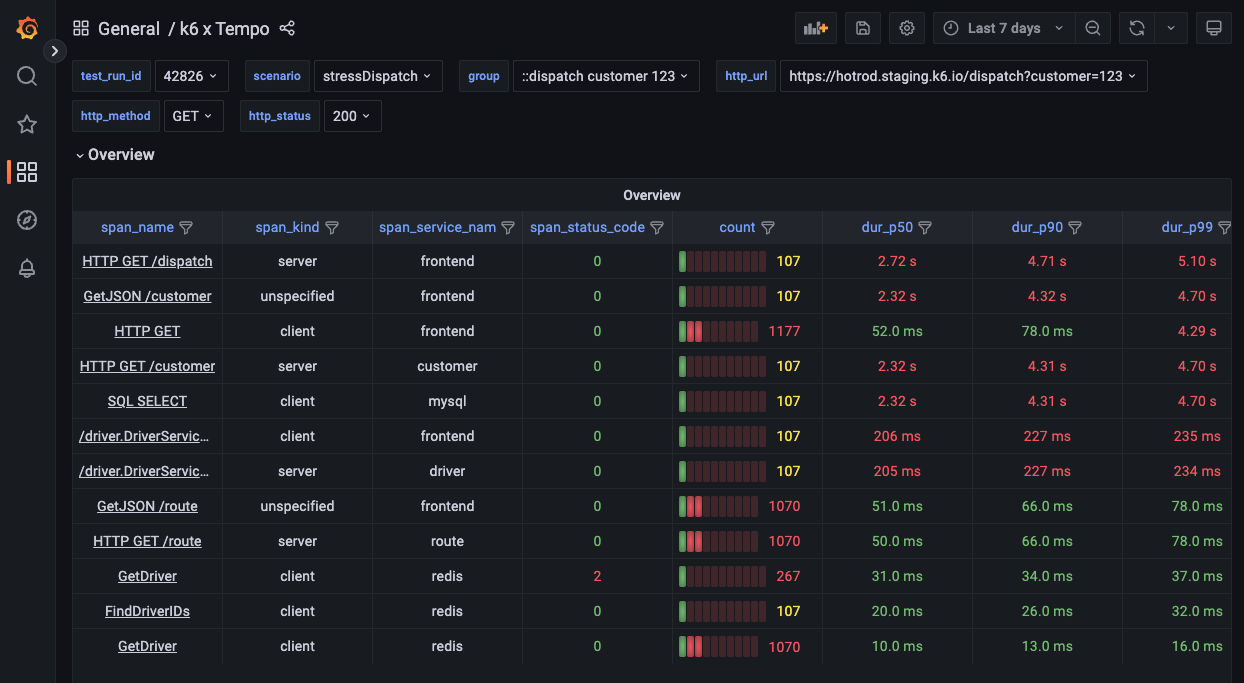
k6 x Tempo works by having k6 start traces during the performance test and propagate them downwards to users’ backend services. The tracing data is then correlated with k6 test run data (e.g. test ID, test scenario, test group, and HTTP request) so users can understand how their services and operations behaved during the whole test run. For example, users can easily pinpoint if some internal operation, such as a database call, took too much time or started failing during X part of their test under Y amount of traffic volume.

Generate useful metrics from tracing data to accelerate anomaly detection
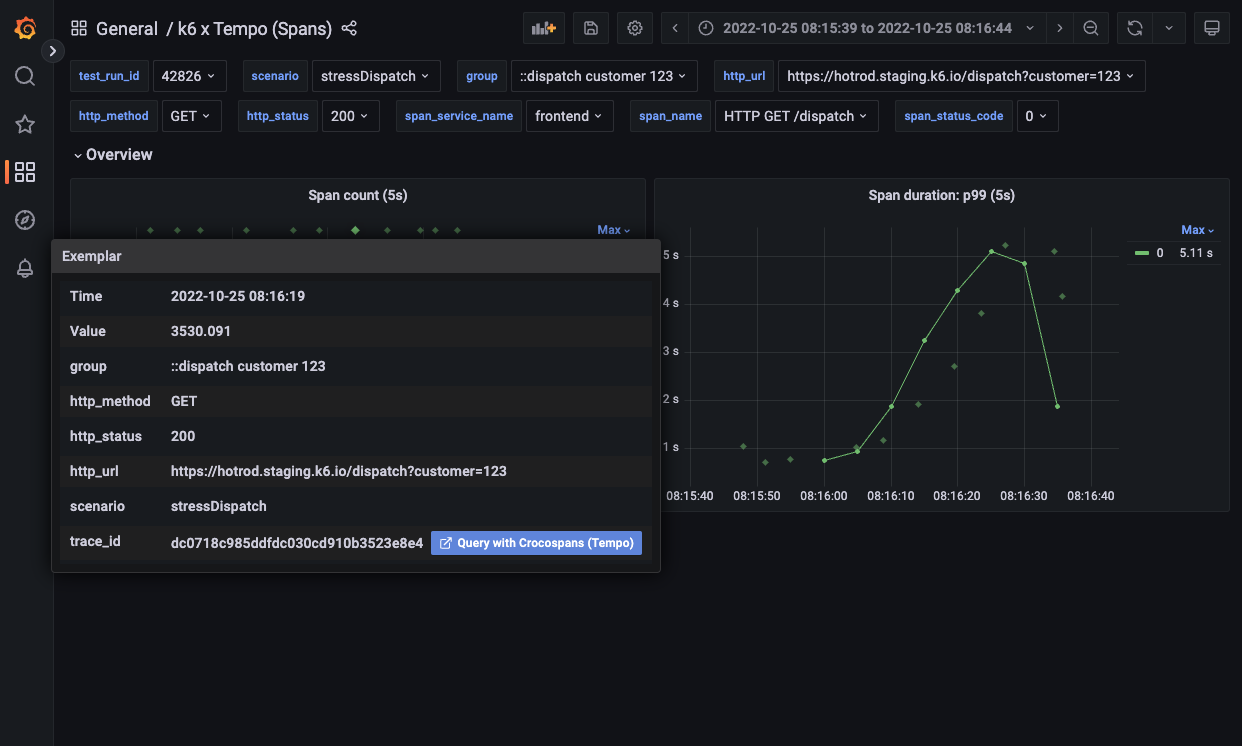
The collected tracing data is aggregated to generate real-time metrics such as frequency of calls, error rates, and percentile latencies that help users narrow their search space and quickly spot anomalous behavior. Further, users can query these trace-based metrics with PromQL or use the attached exemplars to jump from the metrics to a relevant trace to perform a root cause analysis, leading to quick resolutions to performance issues.

Join the k6 x Tempo private beta program
We are initially releasing k6 x Tempo as a private beta for existing Grafana Cloud Traces and Grafana k6 Cloud customers to gain more feedback from our community of users. A handful of early adopters will be selected to participate in a two-month beta program, during which they will complete a proof of concept on the integration with hands-on support from the Grafana Labs team.
If you are interested in participating, please fill out the k6 x Tempo private beta program form to help us understand your use case. Don’t worry; if you are not selected, we will be sure to notify you when the integration moves to a public beta. Thank you for your interest in k6 x Tempo!
Grafana Cloud is the easiest way to get started with metrics, logs, traces, and dashboards. We have a generous free forever tier and plans for every use case. Sign up for free now!


