ObservabilityCON 2022: A guide to new OSS projects, LGTM stack updates, and more from Grafana Labs
ObservabilityCON 2022 is taking place today with a host of exciting announcements, from new OSS projects, partnerships, and integrations to the latest easy-to-use features in the Grafana LGTM stack.
“As an OSS company, we prioritize interoperability. The big tent is at the heart of everything we do, and Grafana is at the heart of the wider ecosystem,” says Grafana Labs Co-founder and CEO Raj Dutt. “In addition, we’re always innovating at the company … There’s always more in the big tent that we will be launching.”
ObservabilityCON marks the beginning of a bigger observability story at Grafana Labs with the introduction of continuous profiling and frontend application observability as well as the joint partnership with Isovalent to observe the health and performance of the network connectivity layer. We are also reaffirming our commitment to open source and spotlighting the latest features we developed to make our core Grafana LGTM stack (Loki for logs, Grafana for visualization, Tempo for traces, Mimir for metrics) more effective, more efficient, and easier to use than ever.
Grafana Phlare for continuous profiling
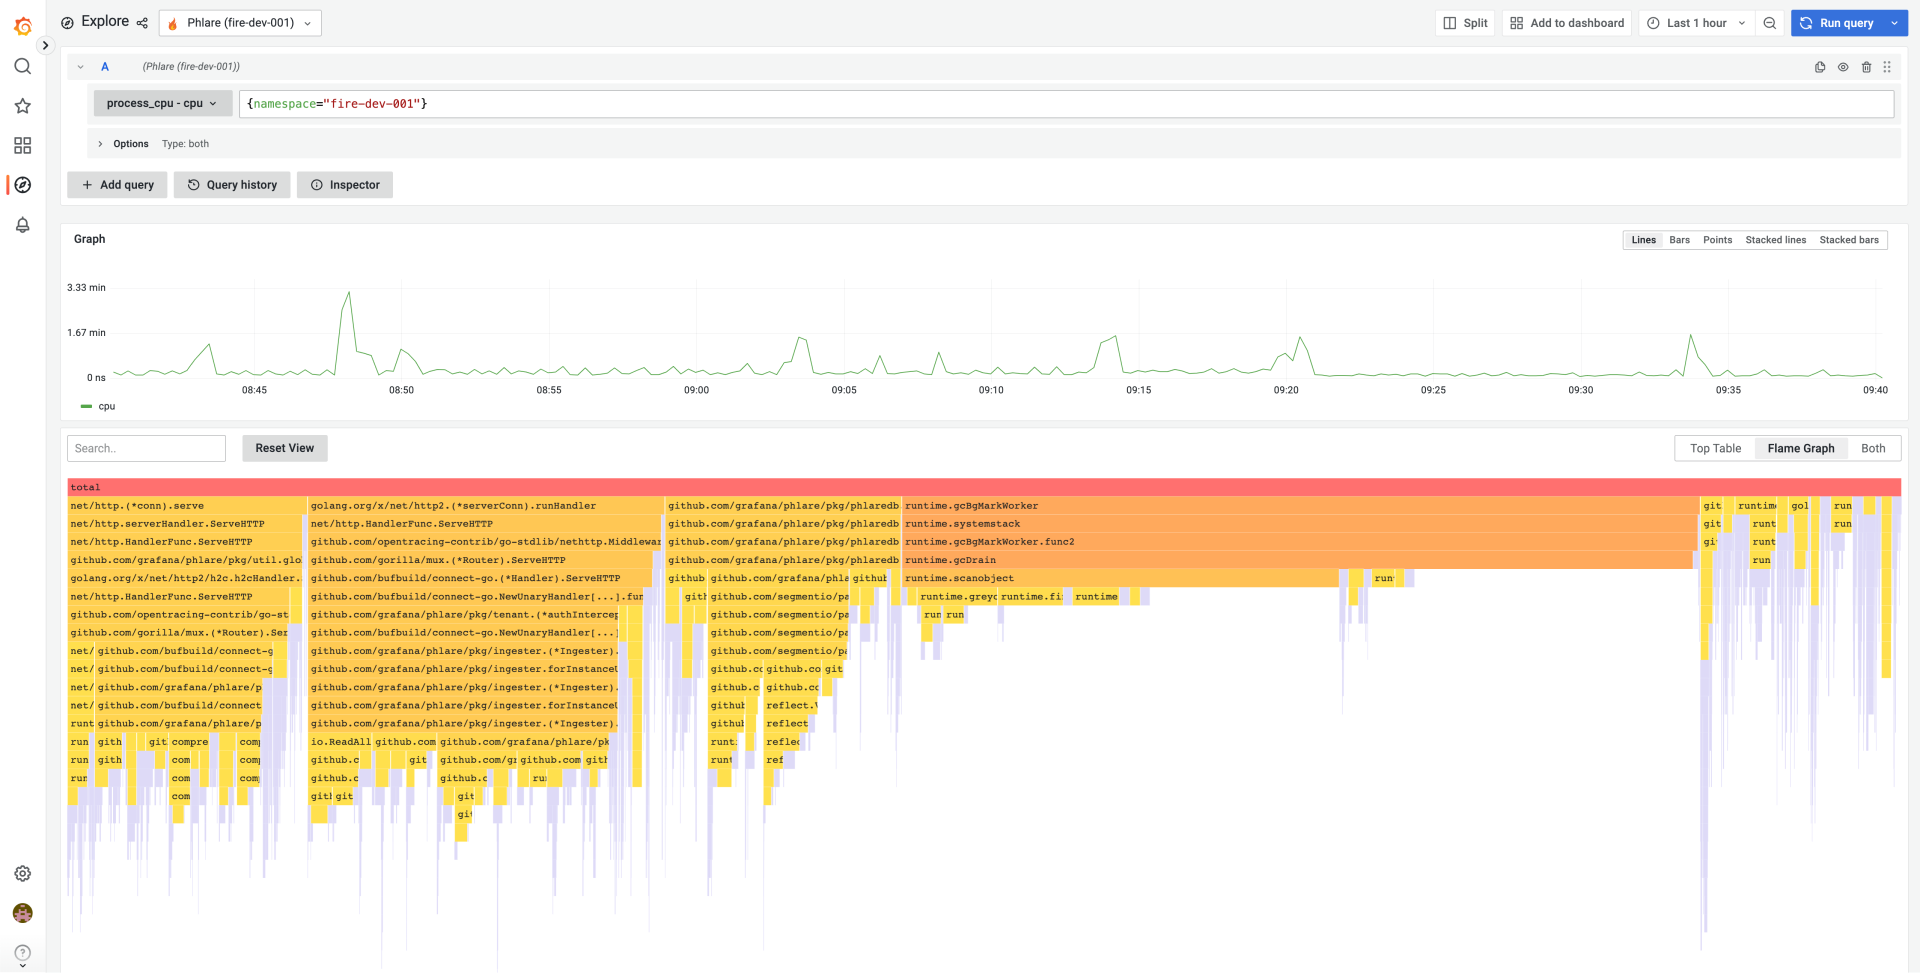
At the end of the keynote, the Grafana Labs team made the repo public for Grafana Phlare: a new open source backend for continuous profiling data. We are excited to share this horizontally scalable, highly available database — along with a new flame graph panel for visualizing profiling data in Grafana — to help the open source community use continuous profiling to understand application performance and optimize infrastructure spend. Grafana Phlare natively integrates with Grafana, making it possible for you to visualize your profiling data alongside your metrics, logs, and traces, and get a comprehensive view of your entire stack.
To learn more, read our Grafana Phlare announcement blog post.

Grafana Faro for frontend application observability
Let’s say you operate an e-commerce site and you want to make sure that your customers can access it during a large event such as Black Friday, when the traffic may spike by 100x. You already use Grafana to monitor your infrastructure and OpenTelemetry for your APIs. But what about the frontend, the actual part of your system that your customers are using?
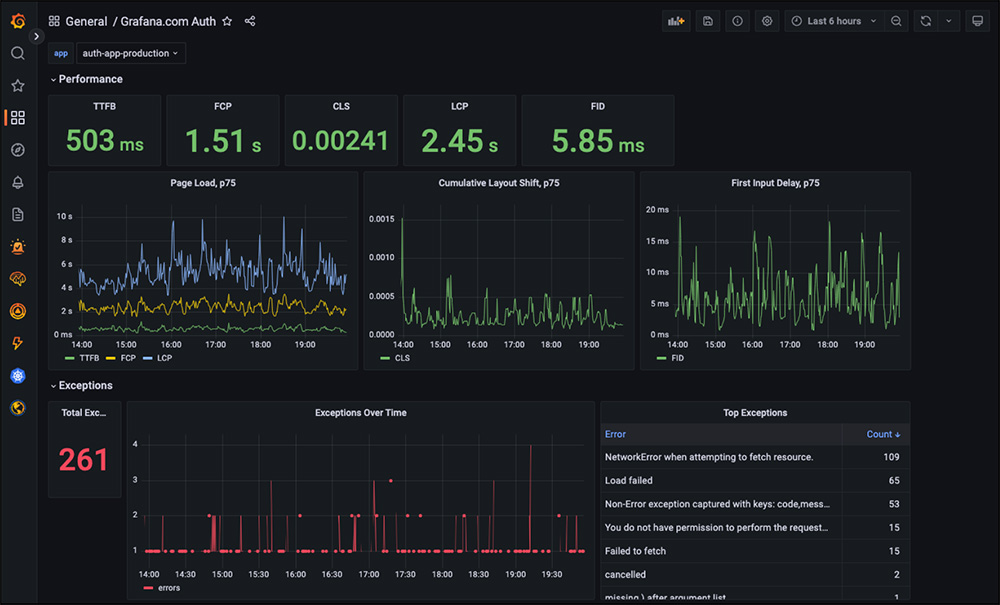
That’s where Grafana Faro comes in. You can use our new open source web SDK to instrument frontend JavaScript applications to collect real user monitoring (RUM) data: performance metrics, logs, exceptions, events, and traces. Faro can be set up to forward the data to the Grafana Agent (with app agent receiver integration enabled), and the frontend telemetry can then be correlated with backend and infrastructure data for seamless, full-stack observability in Grafana.
The easiest way to get started with Grafana Faro is with the new fully managed Frontend Application Observability service in Grafana Cloud. We are currently offering access to Frontend Application Observability in a private beta program before it will be available to all Grafana Cloud users in the coming months.
To learn more, read our Grafana Faro announcement post.

Cilium integration in Grafana Cloud
On the heels of KubeCon + CloudNativeCon North America in Detroit, where Grafana Labs announced a strategic partnership with Isovalent, the creators of Cilium, the Grafana Labs team proudly announced the roll out of the Cilium Enterprise integration for Grafana Cloud, which lets you easily monitor the health of your Cilium deployment with turnkey metrics and dashboards included.
The goal of this partnership is to make it easy for platform and application teams to gain deep insights into the connectivity, security, and performance of the applications running on Kubernetes by leveraging the Grafana observability stack. This collaboration between Grafana Labs and Isovalent is only a few months old, and while this new integration is a big step forward for both teams, we are just scratching the surface of what is possible.
To learn more, read our Cilium + Grafana partnership blog post.

Grafana LGTM stack: all the latest updates

New in Grafana Loki for logs
Improved logs storage and query performance coming in Grafana Loki 2.7: We’ve redesigned Grafana Loki’s index, replacing a bespoke format with a design based on Prometheus’s TSDB. This new format, which will be available in the upcoming Grafana Loki 2.7 release, takes up 75% less space on disk, can be accessed more efficiently, and enables further parallelized query execution. Loki can now scan log lines at up to 400GB/second at peak — that’s 4x faster than before.
These improvements will also be rolled out in Grafana Enterprise Logs (GEL) 1.6 as well as Grafana Cloud Logs, both of which are powered by Grafana Loki.
Export logs from Grafana Cloud: Some Grafana Cloud users need to keep logs for years after they’re generated, often for compliance reasons. At ObservabilityCON, we previewed an upcoming feature in Grafana Cloud that allows you to ship your logs to an object storage bucket you own in AWS, Microsoft Azure, or Google Cloud Platform for long-term storage, and then query it using LogCLI or by running your own Grafana Loki instance, with no additional cost to re-ingest the data to Grafana Cloud.
We are inviting customers to take part in a private beta program to export logs from Grafana Cloud.
New in Grafana Tempo for traces
TraceQL comes to Tempo 2.0: During the keynote, we introduced TraceQL, the new query language for traces that will be rolled out in the upcoming Tempo 2.0 release. Tempo previously let you find traces by leveraging tools like logs and exemplars, or by attributes like service name. With TraceQL, you’ll have a more powerful, flexible way to pinpoint the traces you need to answer questions about your system. Plus TraceQL is modeled on PromQL and LogQL, which makes adoption easier if you are already familiar with those languages.
New Grafana k6 performance testing and Grafana Tempo integration (k6 x Tempo): Performance testing provides high-level insights about how a system behaves from the outside, but it’s challenging to get further understanding of the test results and troubleshoot failed tests due to lack of visibility inside the system. Built natively in Grafana Cloud, k6 x Tempo bridges the gap, generating useful aggregations from your tracing data and correlating them with Grafana k6 test run data to help you understand performance test results and reduce MTTR, ultimately preventing reliability problems from impacting end users.
We are initially releasing the k6 x Tempo as a private beta for existing Grafana Cloud Traces and Grafana k6 Cloud customers to gain more feedback from our community. During the two-month beta program, users will complete a proof of concept on the integration with hands-on support from the Grafana Labs team.

New in Grafana Mimir for metrics
One backend for all metrics: Grafana Mimir, which was launched in March 2022 with native support for Prometheus metrics, now also enables ingestion of Influx, Datadog, Graphite, and OpenTelemetry metrics. With this development, Grafana Labs leans into the “big tent” philosophy by providing an agent-agnostic backend that allows organizations to ingest data from as many sources as possible while leveraging a single query language, PromQL.
Metrics cardinality management: As businesses scale, transition to cloud native architectures, and adopt Prometheus and Kubernetes, SREs and centralized observability teams are seeing metrics time series grow at an alarming rate. Grafana Cloud is tackling this problem with a new metrics offering, now in private beta, in Grafana Cloud that can help manage the growth of metrics and cardinality. The data-driven adaptive approach aggregates low-value metrics into lower cardinality versions of themselves at ingestion, leaving only metrics that add value in your environment.
If you are interested in learning more, please complete the metrics cardinality management private beta form.
New in Grafana Incident Response and Management (IRM)
You can now detect, respond, and learn from your incidents with the Grafana Cloud Incident Response and Management (IRM) suite, which includes Grafana Alerting, Grafana OnCall, and Grafana Incident.
Grafana Incident became GA in September, and we are happy to reveal a new search function that gives you the ability to search previous incidents. Tightly coupled with Incident is Grafana OnCall, an easy-to-use on-call management tool that now has email notifications and a new web-based scheduling UI. In Grafana Alerting — which allows you to create, manage, and take action on your alerts in a single, consolidated view — there are now easier out-of-the-box templates, and we rolled out the ability to create alerts via Terraform.
Altogether, the tools in Grafana Cloud IRM work to simplify the incident workflow to help you focus on managing incidents, not your tools.
For all the latest updates from ObservabilityCON 2022, follow Grafana Labs on Twitter or join the Grafana Labs Community Slack.


