Introducing Grafana Faro, an open source project for frontend application observability
Today, during the ObservabilityCon 2022 keynote session, we announced a new open source project for frontend application observability, Grafana Faro. The project is launching with a highly configurable web SDK that instruments web applications to capture observability signals. This frontend telemetry can then be correlated with backend and infrastructure data for seamless, full-stack observability.
There’s supposed to be a video here, but for some reason there isn’t. Either we entered the id wrong (oops!), or Vimeo is down. If it’s the latter, we’d expect they’ll be back up and running soon. In the meantime, check out our blog!
Why Faro, why now?
Modern browser frontends are complex. We moved from simple inline scripts to complex single page applications that involve a ton of components and optimizations — and deploy them to our users’ browsers. We don’t have visibility into whether there are errors or if the app performs well. And how can you fix something that you’re not tracking?
Here’s where Faro comes into play!
What is Grafana Faro?
When we began developing our approach to frontend application observability, we started in the same way many of our projects do: with open source. Grafana Faro is an open source project that enables you to collect data about the health of the frontend of your web applications.
Let’s assume the following scenario: You operate a web shop and you want to make sure that your customers can access it during a large event such as Black Friday, when the traffic may spike by 100x.
You are already using Grafana to monitor your infrastructure and OpenTelemetry to monitor your APIs. But what about the frontend, the actual part of your system that your customers are using?
Grafana Faro provides an open source JavaScript library, the Grafana Faro Web SDK, which you can add to your frontend application. It will automatically begin to collect logs, errors, and performance metrics (such as web vitals), add metadata so it’s easy to find the useful entries, and forward it to the Grafana Agent (with app agent receiver integration enabled), which can then send this data to Prometheus, Grafana Loki, or Grafana Tempo.

Faro also offers an event API that can be used to capture user events and re-create the journeys that your customers are taking through your application. This is very useful when you want to understand how your users are interacting with your application and how they are using it.
But that’s not all! The Grafana Faro Web SDK comes baked with a lot of useful features:
- Set up in seconds with just two lines of code
- Lightweight
- Automatic instrumentation that captures errors, logs, and performance metrics
- Pre-configured tracing system based on OpenTelemetry with automatic instrumentations
- Easy-to-use API for manual instrumentation
- Fully customizable and extensible
For more information, check out the documentation for configuring and getting started with the Grafana Faro Web SDK.
Frontend Application Observability in Grafana Cloud, powered by Faro
We then wanted to make real user monitoring easier than ever, which is why we are working on rolling out a Frontend Application Observability service powered by Grafana Faro on Grafana Cloud, our fully managed observability offering.

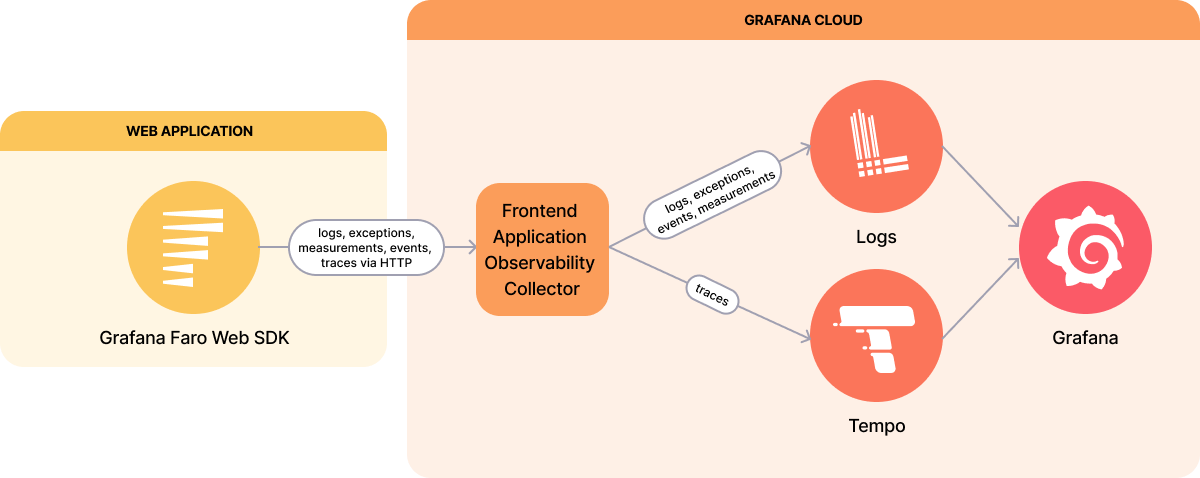
The mechanism is pretty simple: Once set up, the Grafana Faro Web SDK sends data to the Frontend Application Observability Collector in Grafana Cloud, where it is processed and saved as logs and traces that can then be analyzed in your Grafana Cloud instance.
The new Frontend Application Observability service, now in private beta, will be available for all Grafana Cloud users so you don’t have to worry about the infrastructure or the security. You can focus on developing your application and the data that you want to collect.
Join the Grafana Cloud Frontend Application Observability private beta
Interested in trying out our hosted service for real user monitoring now? Sign up for the Frontend Application Observability private beta program.
We will let you know if you have been selected for the program. If you are not selected, don’t worry; we will be sure to notify you when the integration moves to a public beta.
After you have been given access to the private beta, setting up Grafana Faro is very easy:
- Register your application URLs in your Grafana Cloud stack
- Add the Grafana Faro Web SDK to your application
- Enjoy the benefits of Grafana Faro in Grafana Coud!
Learn more about Grafana Faro
We’re committed to contributing to the open source community, putting our engineering and operational knowledge behind making an easy-to-use frontend monitoring solution.
Try out Grafana Faro today and to learn more, check out our Grafana Faro documentation.


