Announcing Grafana Phlare, the open source database for continuous profiling at massive scale
At ObservabilityCON in New York City today, we announced a new open source backend for continuous profiling data: Grafana Phlare. We are excited to share this horizontally scalable, highly available database with the open source community — along with a new flame graph panel for visualizing profiling data in Grafana — to help you use continuous profiling to understand your application performance and optimize your infrastructure spend.
There’s supposed to be a video here, but for some reason there isn’t. Either we entered the id wrong (oops!), or Vimeo is down. If it’s the latter, we’d expect they’ll be back up and running soon. In the meantime, check out our blog!
What is continuous profiling?
The concept is a valuable one: Profiling helps you understand the resource usage of your program, which in turn helps you optimize its performance and cost. The shift to distributed, cloud native architecture, however, has made this more complex, creating the need for continuous profiling, in which information about resource usage is automatically collected at regular intervals across an entire compute infrastructure, then compressed and stored as time series data. This allows you to visualize changes over time and zoom in on profiles that match a period of interest — for example, where CPU time was spent during its period of highest utilization.
For the value it brings, continuous profiling has been dubbed the fourth pillar of observability (after metrics, logs, and traces).
At Grafana Labs, we started looking at using continuous profiling to understand the performance of the software we use to power Grafana Cloud, including Grafana Loki, Grafana Mimir, Grafana Tempo, and Grafana. If we’re paged about a slow query in Mimir, for example, we might use profiling to understand where in the Mimir codebase that query spent the most time. If we’re seeing Grafana repeatedly crash due to out-of-memory errors, we’ll take a look at a memory profile to look at what object was consuming the most memory right before the crash.

While there are open source projects for storing and querying continuous profiling data, after some investigation, we struggled to find one that met the scaling, reliability, and performance requirements needed to support continuous profiling at the level Grafana Labs requires. During a company-wide hackathon, a group of engineers led a project that showed how valuable profiling data could be when connected with metrics, logs, and traces, further adding to our eagerness to roll out continuous profiling across all our environments.
So we decided to get to work creating a database for continuous profiling telemetry, based on the design principles that have made our other open source observability backends, Loki, Tempo, and Mimir, so successful: horizontally scalable architecture and use of object storage.
Open source is at the heart of Grafana Labs, and we wanted to share what we were building and learning with the community.
Introducing Grafana Phlare for continuous profiling data
Grafana Phlare provides horizontally scalable, highly available, long-term storage and querying of profiling data. It’s easy to install with just one binary and no additional dependencies, just like Prometheus. Because Phlare uses object storage (Amazon S3, Google Cloud Storage, Azure Blob Storage, OpenStack Swift, and any S3-compatible object storage), you can store all the history you need without breaking the bank. Its native multi-tenancy and isolation feature set make it possible to run one database for multiple independent teams or business units.
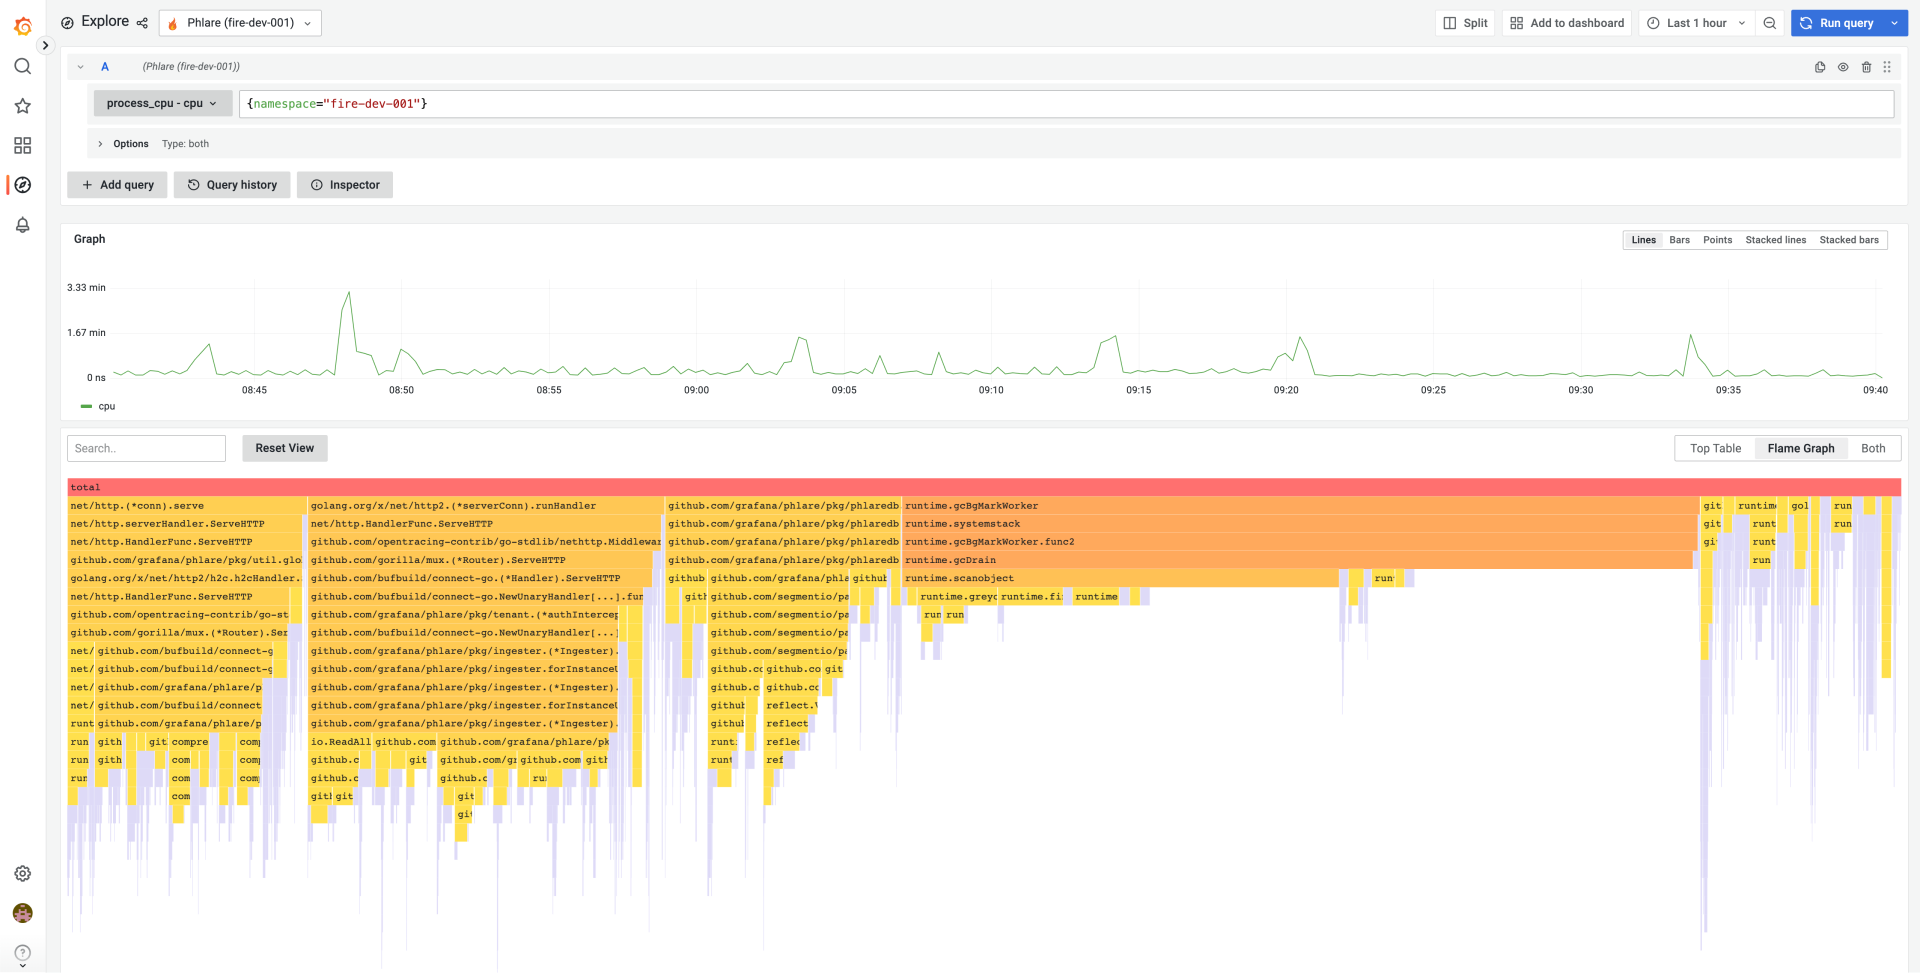
Phlare natively integrates with Grafana, making it possible for you to visualize your profiling data alongside your metrics, logs, and traces, and get a comprehensive view of your entire stack. We have also added a flame graph panel to Grafana, which allows you to build dashboards that display profiling data next to data from any of the hundreds of disparate data sources that can be visualized in Grafana.

By making it possible for you to visualize your data alongside every other data source you rely on, we believe we are massively increasing the usefulness of your profiling data.
This is, at its core, our big tent philosophy: We want you to be able to bring together all the data you need, no matter where it lives. So we’re excited to announce that in addition to releasing a Grafana data source plugin for Phlare, we’re also releasing a Grafana data source plugin for Parca, another open source profiling database. Both can leverage Grafana’s new flame graph panel as part of the Explore and dashboarding experiences in Grafana. With these two data sources, plus the existing Pyroscope plugin in Grafana, the continuous profiling community can now visualize profiling data from three different profiling databases in Grafana. As the adoption of continuous profiling continues to grow, we intend to add new panel and visualization types beyond the flame graph to help users more easily slice and dice their profiling data.
What’s next for Grafana Phlare?
Now that Grafana Phlare has been released, we are eager to hear how you’re using continuous profiling and what you’d like to see next. On our end, we’re actively improving Phlare’s query path so users can query profiles further back in time and extending the Grafana Agent to collect and send profiles to Phlare. We’re also making it possible to enable profiling without the need to instrument your applications by leveraging technologies like eBPF.
We’re excited to keep contributing to the open source community, and putting our engineering and operational knowledge behind making continuous profiling work for you as the fourth pillar of observability.
Try out Grafana Phlare, learn how to get started with our Grafana Phlare documentation, and let us know what you think! You can open an issue in the Phlare Github repo, join the conversation on the #phlare channel on the Grafana Labs Community Slack, or join us for our first community call on Nov. 8 at 17:00 UTC.


