
Grafana and Cilium: Deep eBPF-powered observability for Kubernetes and cloud native infrastructure
Dan Wendlandt, co-founder and CEO of Isovalent, is a longtime contributor to and leader of open source communities. Dan helped start and lead community and product strategy at Nicira, the company that built Open vSwitch (OVS) and drove much of the software-defined networking movement, which became the foundation for VMware NSX after Nicira was acquired. Dan co-founded Isovalent along with Thomas Graf, Linux kernel developer and co-creator of Cilium, on the vision that eBPF was the critical innovation that would help Linux networking and security make the leap to the age of microservices and Kubernetes.
Today, Grafana Labs announced a strategic partnership with Isovalent, the creators of Cilium, to make it easy for platform and application teams to gain deep insights into the connectivity, security, and performance of the applications running on Kubernetes by leveraging the Grafana open source observability stack. Grafana Labs’ recent participation in Isovalent’s Series B funding round kicked off some joint engineering initiatives, and we are excited to share more about why we decided to partner, as well as some of the early results of this collaboration.
Both companies have a shared belief in the critical role of connectivity observability in the age of modern API-driven applications, and in the importance of building thriving open source communities to more effectively engage with and learn from end users and ecosystem partners.
In this blog, we’ll focus specifically on observing the health and performance of connectivity between cloud native applications. We’ll talk about why gaining rich connectivity observability for modern cloud native workloads has traditionally been extremely challenging, and how eBPF, an exciting new innovation in the Linux kernel led by the Isovalent team, has enabled a fundamentally better approach. We’ll talk about how the eBPF-powered Cilium project has risen to become the new de facto standard for secure and observable connectivity within Kubernetes environments and dig into several concrete examples of how the combination of Cilium’s rich connectivity observability data with Grafana Labs’ LGTM (Loki for logs, Grafana for visualization, Tempo for traces, Mimir for metrics) open source observability stack represents a major step forward in capability and simplicity for application owners and Kubernetes platform teams. Let’s get started!
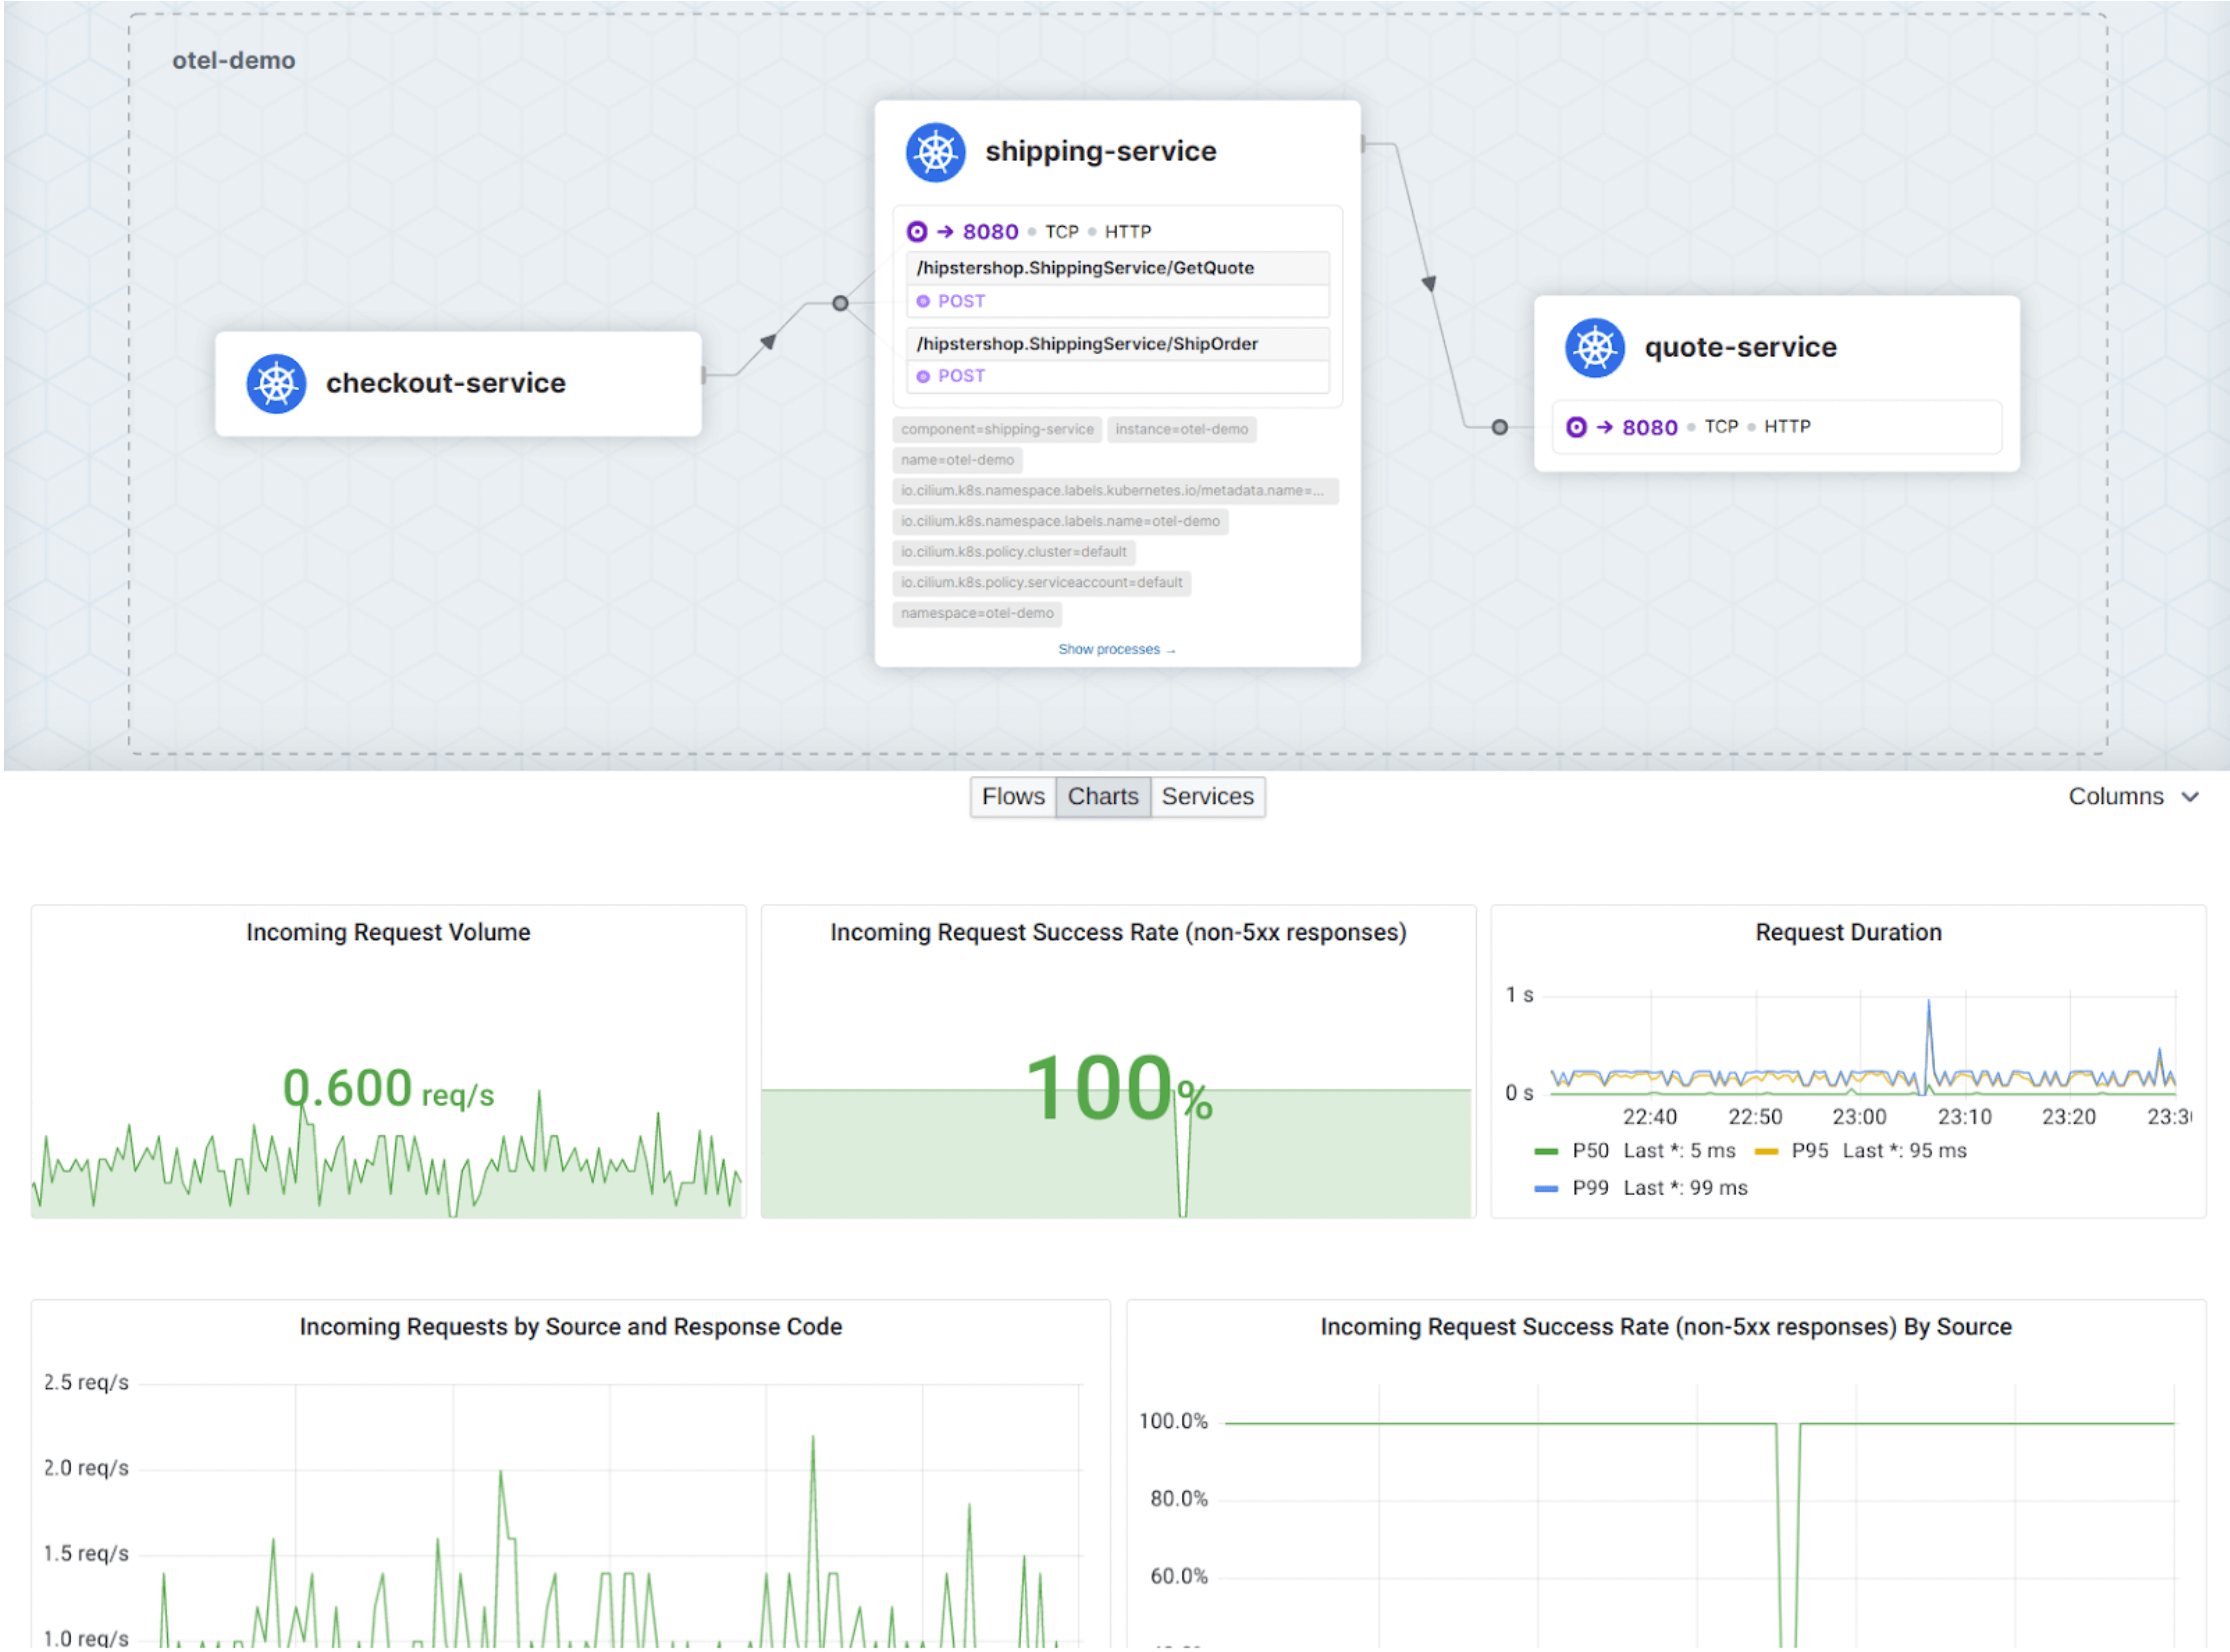
The problem: Connectivity observability for applications on Kubernetes
The shift toward building modern applications as a collection of API-driven services has many benefits, but let’s be honest, simplified monitoring and troubleshooting is not one of them. In a world where a single “click” by a user may result in dozens, or even hundreds, of API calls under the hood, any fault, over-capacity, or latency in the underlying connectivity can (and often will) negatively impact application behavior in ways that can be devilishly difficult to detect and root cause.
Confounding the problem, modern infrastructure platforms like Kubernetes dynamically schedule different replicas of each service as containers across a large multi-tenant cluster of Linux machines. This architecture makes it extremely difficult to pinpoint exactly where a workload experiencing a connectivity issue may be running at a given point in time, and even if the node is identified, the multi-tenant nature of containers also means that application developers no longer have direct access to low-level network counters and tools (e.g., netstat, tcpdump) that may have been available as a stop-gap in VM-based infrastructure.
This leaves application and Kubernetes platform teams in a challenging place: Connectivity observability is more critical than ever, but achieving it is more difficult than ever.
Comprehensive connectivity observability: Why is this so hard?
We see our customers grappling with this challenge every day. There are two key aspects to why achieving deep observability into the health and performance of connectivity between applications running in Kubernetes is a particularly difficult problem.
Challenge #1: Connectivity is layered (the “finger-pointing problem”)
A common scenario we hear is that an app team has received user-level reports of application failures or slowness, and they believe the underlying network is to blame. The platform team sees no signs of a problem in the infrastructure components they manage and suggests that the issue may be at the app layer. Or perhaps it might be an issue with the underlying physical or cloud provider network. What to do next? This is the classic “finger-pointing problem.”

At the heart of this challenge is that network connectivity is designed as a set of “layers,” formally referred to as the “OSI networking model.” While the details of the model are not critical, you’ve likely heard network-savvy colleagues talk about “Layer 2” (Ethernet), “Layer 3” (IP), “Layer 4” (TCP), and “Layer 7” (API protocols like HTTP). The critical insight here is that an explicit goal of each layer is to abstract away the details of the layers below it. This is great when things are working, but it also means that layering intentionally hides faults at lower layers from the higher layers.
The end result is that comprehensive connectivity observability simply cannot be achieved by observing only a single layer, nor can it be done simply from the application itself (which only has visibility into the highest L7 layer). Comprehensive connectivity observability must see all layers and be able to correlate across them.
Challenge #2: Application identity (the “signal-to-noise problem”)
Even a moderately sized multi-tenant Kubernetes cluster can easily be running thousands of different services, each with multiple service replicas scheduled across hundreds of Linux worker nodes (and large-scale clusters can get much bigger). As a result, the underlying connectivity is extremely “noisy” for someone just trying to observe the connectivity of a single application.
In the “olden days” of static applications servers run as physical nodes or VMs on dedicated VLANs and subnets, the IP address or subnet of a workload was often a long-term meaningful way to identify a specific application. This meant that IP-based network logs or counters could be analyzed to make meaningful statements about the behavior of an application. But with modern infrastructure platforms like Kubernetes, containerized workloads are constantly created and destroyed and as a result, these platforms treat IP addresses as ephemeral identifiers not tied to application identity. And even outside the Kubernetes cluster, when application developers use external APIs from cloud providers (e.g., AWS) or other third parties (e.g., Twilio), the IP addresses associated with these destinations often vary from one connection attempt to another, making it hard to interpret using IP-based logs.
The takeaway here is that for connectivity observability of modern applications, IPs are not meaningful identifiers for either the source or destination of a connection. All observability must be done in the context of a long-term meaningful “service identity.” For workloads running in Kubernetes, this service identity can be derived from the metadata labels associated with each application (e.g., namespace=tenant-jobs, service=core-api). For services outside of Kubernetes, we don’t have clean label metadata, but the DNS name resolved to access the external service (e.g., api.twilio.com or mybucket.s3.aws.amazon.com) is often the best form of service identity available.
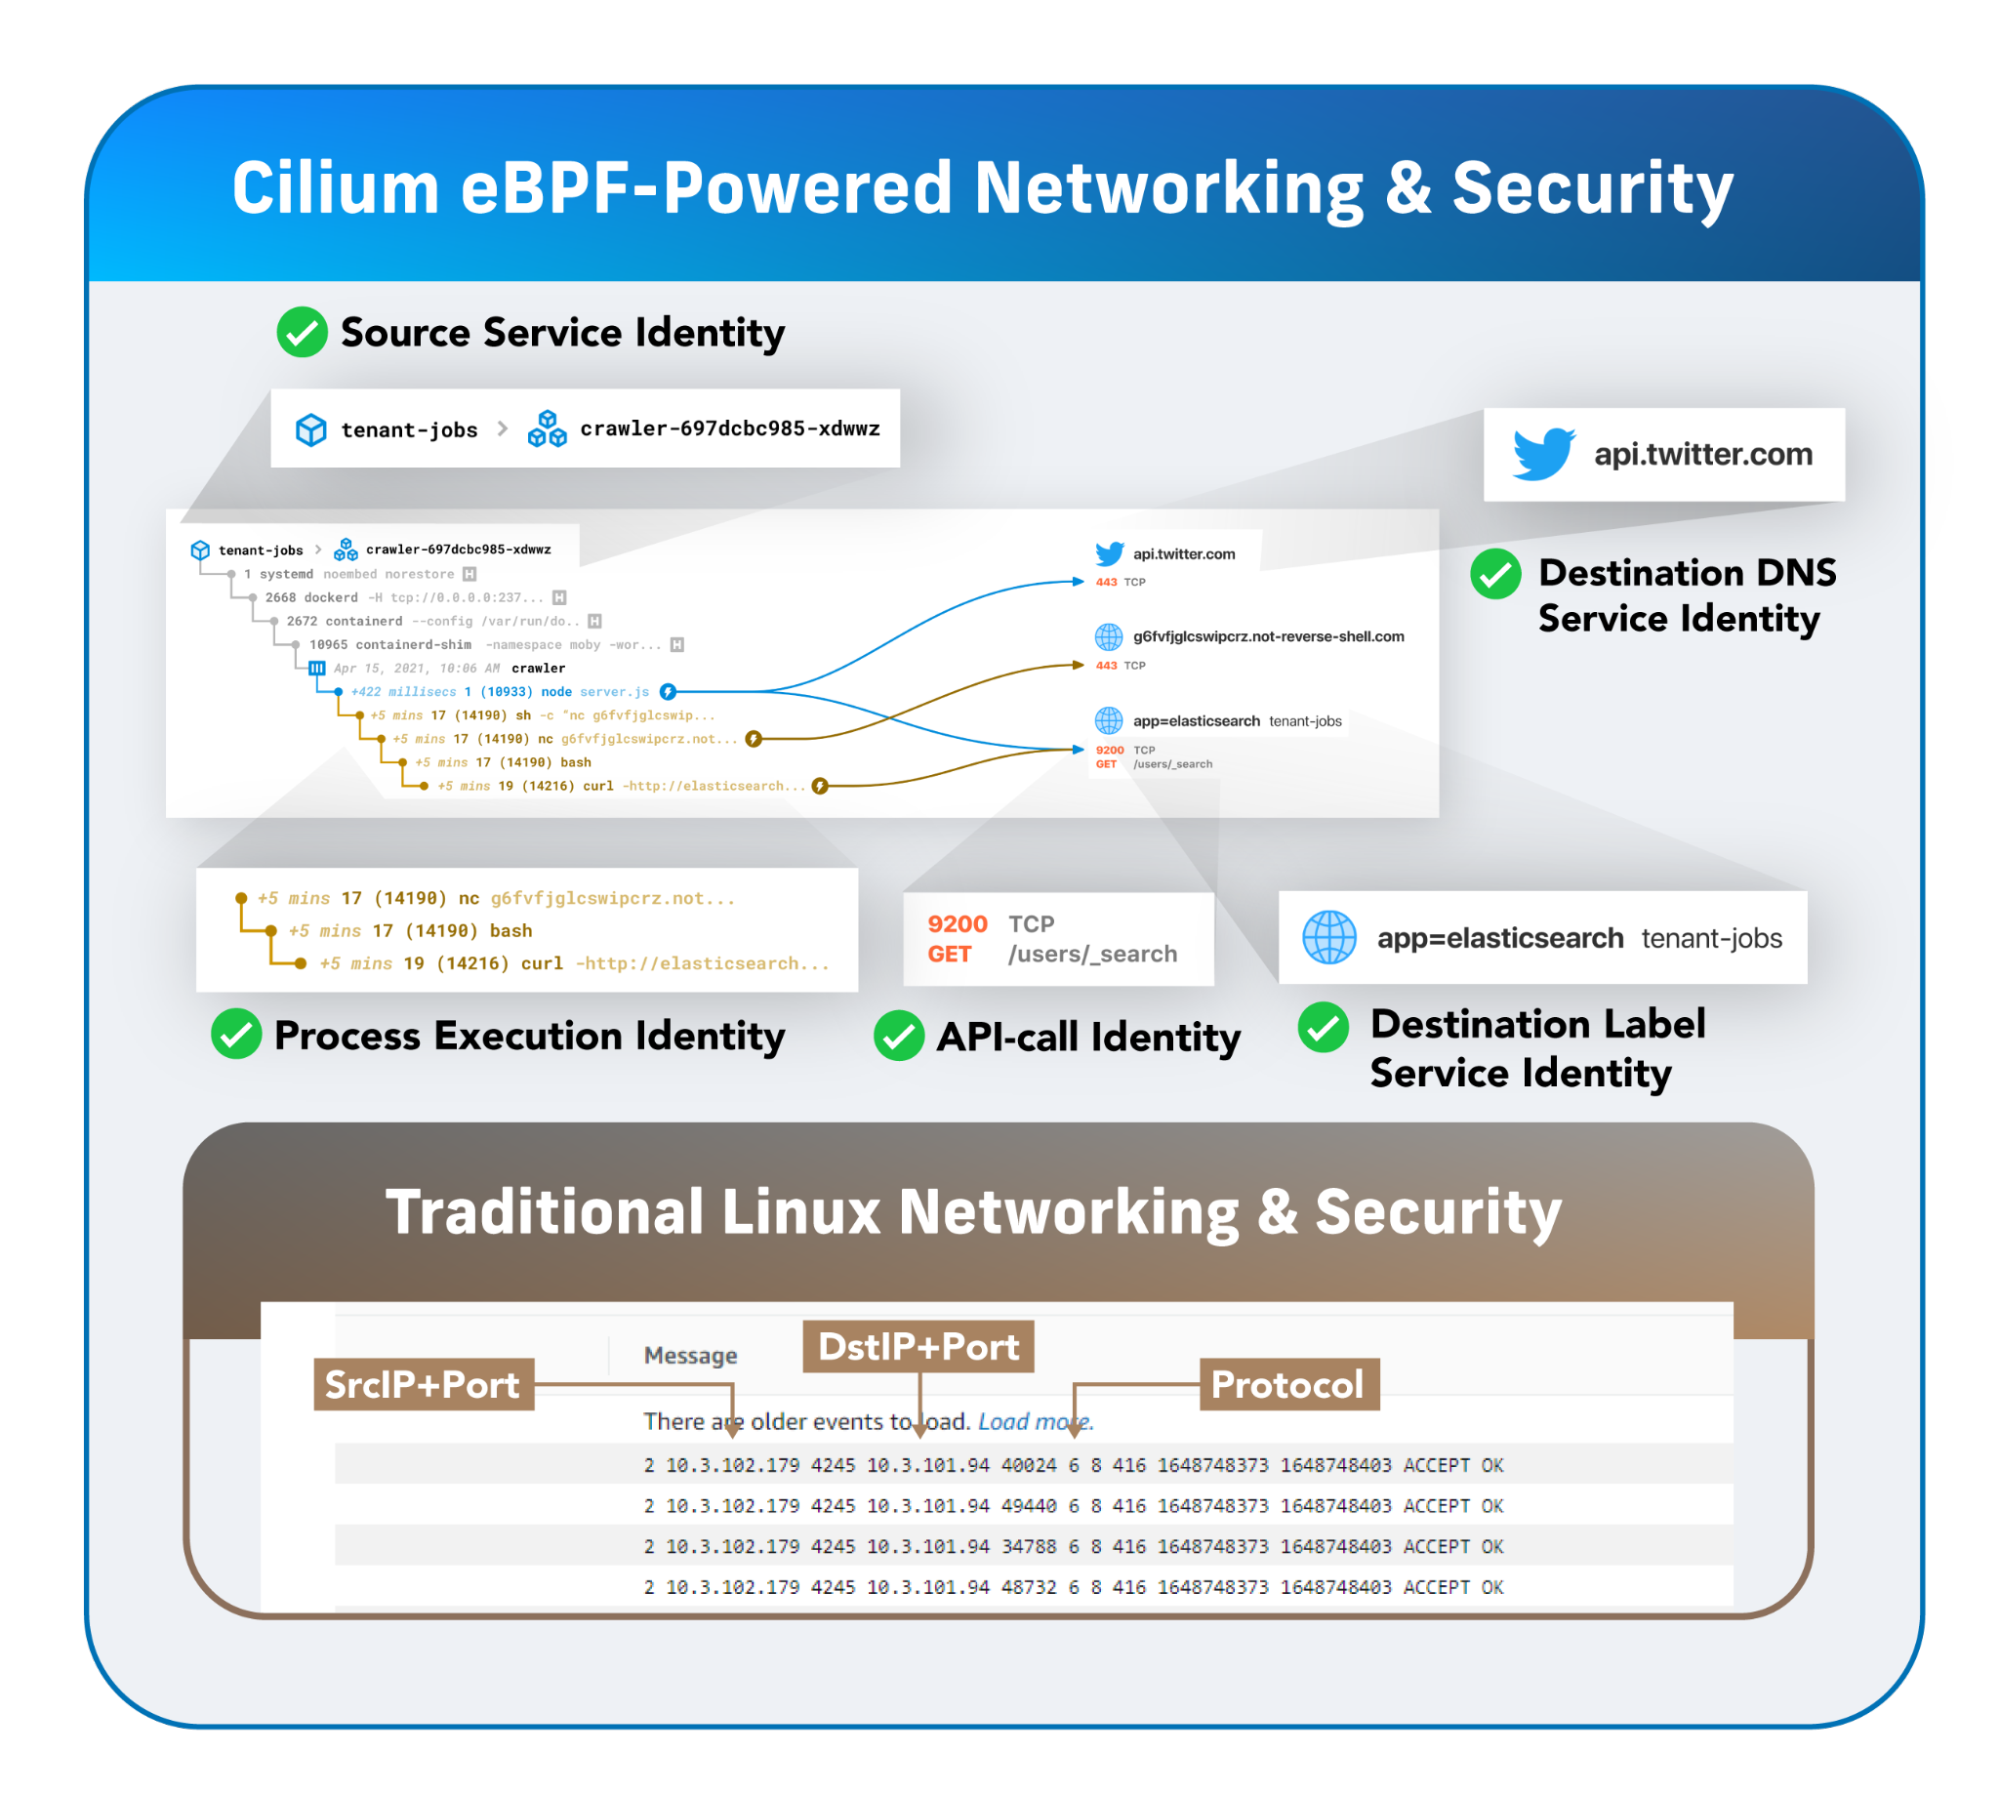
Where existing mechanisms fall short
With both the “finger-pointing problem” and “signal-to-noise problem” in mind, we can more easily understand where existing mechanisms for observing connectivity fall short.
- Traditional network monitoring devices are limited on multiple fronts. As centralized devices, they quickly become bottlenecks, and their observability typically lacks a meaningful notion of service identity for the source and destination of connections.
- Cloud provider network flow logs (e.g., VPC flow logs) are not a centralized bottleneck, but are limited to network-level visibility and so lack both service identity and API-layer visibility. They are also tied to the underlying infrastructure and thus are not consistent across cloud providers.
- Linux host statistics contain some data about network faults, but in a Kubernetes cluster the OS on its own can’t distinguish between the multiple service identities running as containers on that node. Additionally, the OS lacks an understanding of the service identity of remote destinations, and has no visibility at the API layer.
- Modifying application code to emit metrics, logs, or traces for each connection can provide meaningful application- and API-layer visibility, but has no visibility into faults or bottlenecks that happen at the network layer (i.e., TCP, IP, or Ethernet layers), nor does it have service identity for incoming connections. Visibility at this layer also requires updating application code, which may be cumbersome at best, or next to impossible with third-party software and third-party API SDKs.
- Sidecar-based service meshes like Istio promise rich API-layer observability without modifying application code, but come at a high cost in terms of resource consumption, performance impact, and operational complexity. Service meshes have limited visibility for connections to/from “outside” the mesh, and because the proxy operates only at the API layer, sidecar-based services meshes also lack visibility into faults or bottlenecks at the network layer.
Enter eBPF & Cilium: Service identity-aware network and API-layer observability with no application changes
eBPF is a revolutionary new Linux kernel technology co-maintained upstream by Isovalent. eBPF is now supported in all mainstream Linux distributions and provides a safe, efficient way to inject additional kernel-level intelligence as “eBPF programs” that execute non-disruptively whenever applications invoke standard Linux OS functionality for network access, file access, program execution, and more.
Rather than leveraging legacy kernel network functionality like iptables, Cilium was built using an eBPF-native approach, which enables a highly efficient and powerful connectivity and security fabric that has observability built in as a first-class citizen. As a result, Cilium has been selected by leading enterprises and telcos, and is now the default within Kubernetes offerings from Google Cloud, AWS, and Microsoft Azure. Last year, Cilium was donated to the Cloud Native Computing Foundation (CNCF), the open source foundation that also hosts the Kubernetes community, by Isovalent.
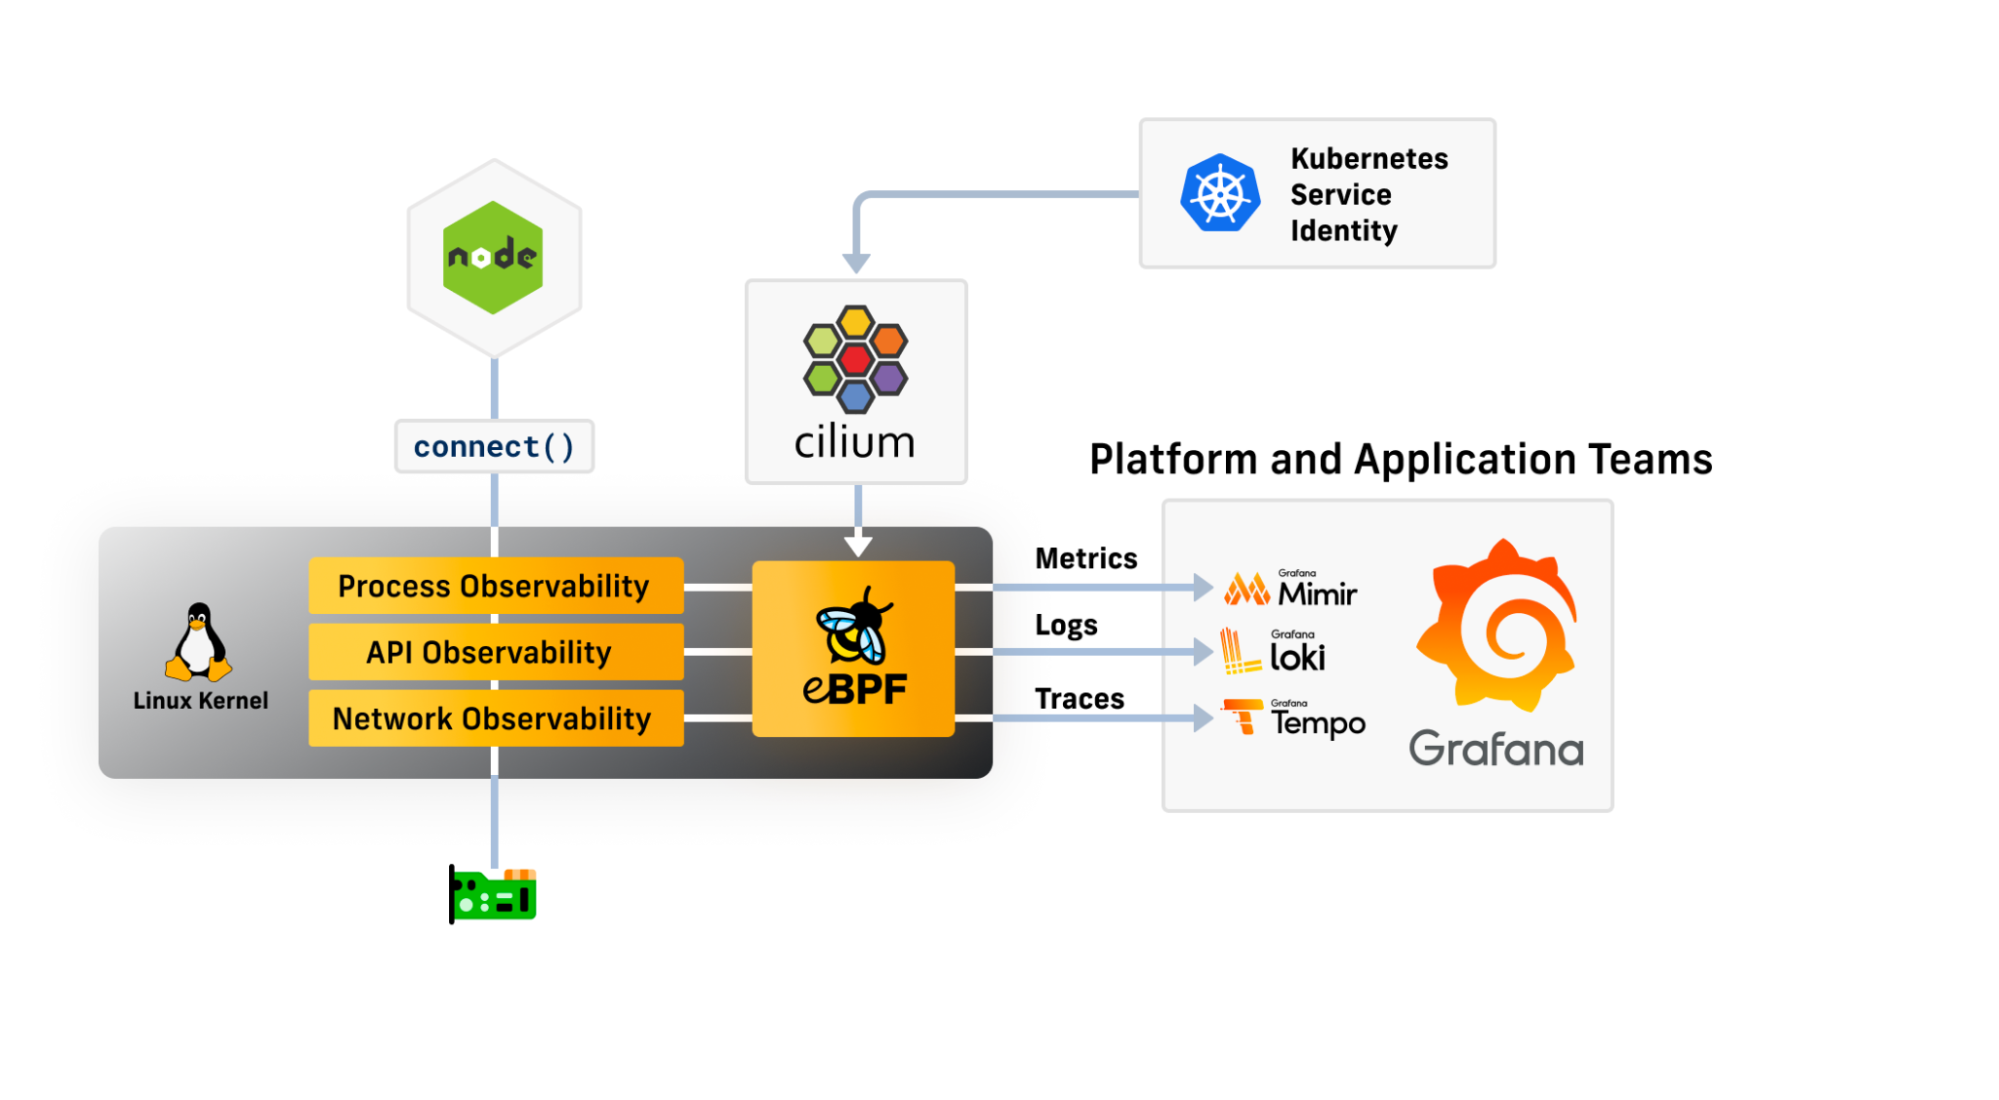
Cilium leverages eBPF to ensure that all connectivity observability data is associated not only with the IP addresses, but also with the higher-level service identity of applications on both sides of a network connection. And because eBPF operates at the Linux kernel layer, this added observability does not require any changes to applications themselves or the use of heavyweight and complex sidecar proxies. Instead, Cilium inserts transparently beneath existing workloads, scaling horizontally within a Kubernetes cluster as it grows.
Cilium generates a rich stream of service-identity-aware connectivity metrics and events, which makes backend observability like the Grafana LGTM stack or Grafana Cloud the natural complement to Cilium’s robust connectivity observability capabilities. Below we walk through three concrete examples of how this powerful combination can help solve common challenges faced when a Kubernetes platform team interacts with the teams running applications on their platform to monitor or troubleshoot the health of connectivity.
Example #1: HTTP Golden Signals metrics, no app changes or sidecars required
Three key metrics for understanding the health of HTTP (i.e., API layer) connectivity, often referred to as “HTTP Golden Signals,” are:
- HTTP Request Rate
- HTTP Request Latency
- HTTP Request Response Codes / Errors
Cilium is capable of extracting this data without any changes to the application, and aggregates the corresponding metrics not based on IPs (which are meaningless in a Kubernetes environment) but with long-term, meaningful service identity.
Returning to our “finger-pointing problem,” if an application team is experiencing a fault in their application connectivity, these HTTP Golden Signals can clearly highlight whether the root cause is at the API layer (i.e., something the application team needs to deal with themselves) or at a lower layer in the network stack (i.e., something where they need to get the infrastructure team involved).
And returning to the “signal-vs.-noise problem,” the fact that metrics are all tagged with meaningful service identity makes it easy for either the platform or application team to use Grafana filtering to ignore the vast amounts of observability information related to other apps and quickly zero in on only the services tagged with their team name, or even a specific service, without having to understand where that containers for this service are or were running.
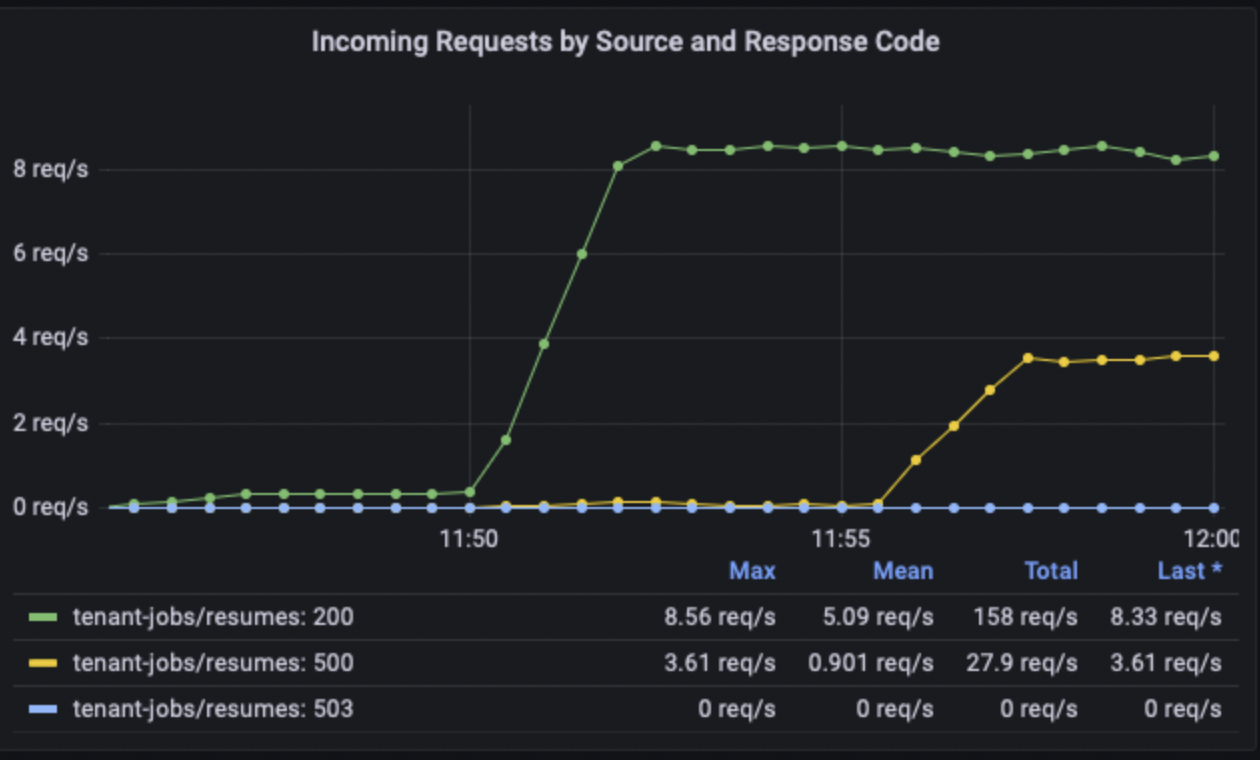
For example, the Grafana dashboard below shows the error codes for all inbound connections to a specific “core-api” application service in the “tenant-jobs” namespace. We can easily see that it is only being accessed by one other service, “resumes,” and that while connectivity was initially healthy, around 11:55 service connectivity began to experience a partial API-layer issue as indicated by the increase in HTTP 500 error codes. This is a clear indicator of an API-layer issue that must be resolved by the application team operating the specific “core-api” and “resumes” services.
Example #2: Detecting transient network layer issues
But faults can also exist at any layer of the network stack. When connectivity issues arise with non-API layer components of the networking stack (e.g., DNS failures, firewalling drops, network latency / congestion, etc.), the application team typically has very limited ability to clearly identify that an underlying network issue even occurred, much less to clearly indicate whom to contact in order to mitigate the issue.
Consider an application where users reported slow performance and application-layer timeouts for a brief window several hours ago. Application logs show no obvious issues, and CPU load for the application was not abnormally high. Might a network issue be to blame?
Isovalent extended Cilium to use kernel-level observability in the enterprise offering to extract what might be deemed “TCP Golden Signals”:
- TCP layer bytes sent / received
- TCP layer retransmissions to measure network layer loss / congestion
- TCP “round-trip-time” to indicate network layer latency
As with the previous example, the service-identity metadata associated with the metrics allows an application or platform team to quickly hone in on network layer signals specific to the application in question. In the example below, we see that a specific “notifications” service in the “tenant-jobs” namespace experienced increased TCP retransmissions (i.e., network layer packet loss), but only while communicating externally with api.twilio.com. Given the time window of the errors matches the time of the reported application issue, the app team might confirm via the Twilio service status page that there was a known service interruption in that window, and safely determine that the issue was external to their application code.

Example #3: Identifying problematic API requests with transparent tracing
The automatically extracted network and API layer observability data described above can also be used to enable multi-hop network tracing in combination with an application that propagates standard tracing identifiers via HTTP headers.
Large volumes of HTTP tracing data on its own can easily become overwhelming. It is the equivalent of a “haystack” that is all needles, without any indication of which needle is the one that will help you solve the problem. To help address this, Grafana supports a powerful concept called “exemplars,” which when used in conjunction with metrics can help you identify which traces are likely to provide more detailed insight into a broader trend you observe in the metrics.
For example, returning to the same app from Example #1, imagine our “core-api” service is now showing a spike in request latency after an upgrade to a more recent version. This is visible with with the following chart:
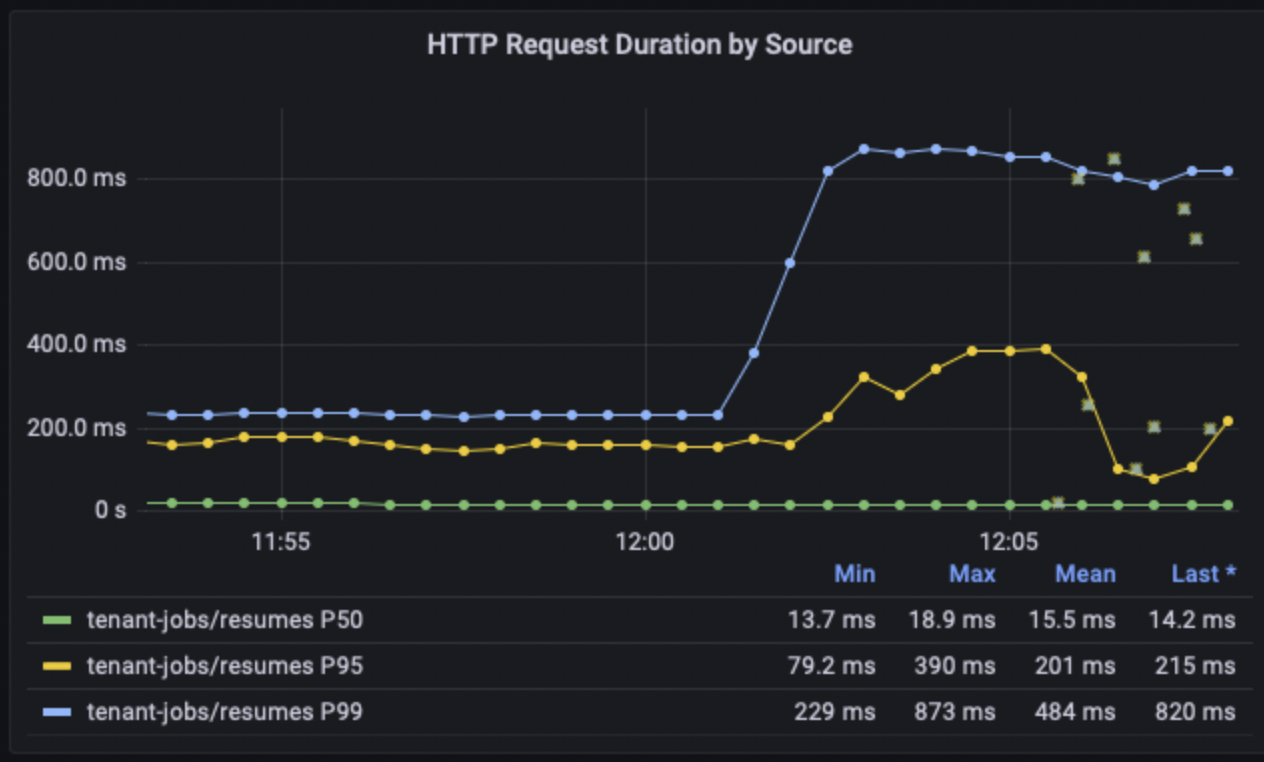
Note the small green boxes on the chart, which are Grafana “exemplars” for individual HTTP requests between the “resumes” service and “core-api.” Clicking on an individual exemplar with a high latency value results in a window that provides the option to Query with Tempo, the LGTM stack component for querying and visualizing traces.

Clicking this button then takes the user to the full trace details in Tempo, which in this case indicates that underlying failures and retries are the likely cause of the higher latency:

What’s next? Much, much more!
We hope these examples were useful and that you’re as excited as we are about eBPF, Cilium, and how the combination of these technologies with Grafana Labs’ LGTM stack and Grafana Cloud can make the lives of application and platform teams easier.
This collaboration between Grafana Labs and Isovalent is only a few months old, and we are just scratching the surface of what is possible. Expect more blogs with additional use cases and news about further integrations with Grafana Cloud in the coming weeks and months. In addition to exploring more connectivity observability use cases, we’ll also dig into how the LGTM stack combined with Cilium Tetragon (Isovalent’s open source security observability project) can provide deep runtime and network security observability for forensics, threat detection, and compliance monitoring.
If you’d like to try out some of the examples we discussed above on your own, we encourage you to check out this hands-on demo, which uses Kind to run a small Kubernetes cluster, Cilium, Grafana, Prometheus, and Grafana Tempo on your laptop. If you have questions or ideas, we encourage you to join the conversation in the #grafana channel on the Cilium Slack.
Are you interested in getting more information about using Cilium and Grafana at enterprise scale? Request early access to the Cilium Enterprise and Grafana integration.


