Get better insights from industrial IoT data with Grafana
Varland Plating has been in the electroplating business since 1946. At their industrial job shop in Cincinnati, Ohio, they perform complex electrochemical treatments on steel, brass, and copper manufactured parts to create everything from corrosion-resistant building materials to decorative metals.
The Varland team aims to turn around each job in three to five days. In order to deliver quality products at that high level of service, they need to track and visualize metrics — temperature, pH levels, electrical current levels, and more — across every step of the electroplating process. While their Opto22 programmable logic controllers deliver everything they need to run the actual process of electroplating, they had very limited data visualization capabilities, which hindered Varland’s ability to to make better, data-driven business decisions.

In his recent GrafanaCONline talk titled “Modernizing industrial IoT monitoring with Grafana visualization,” Varland Plating VP of Technology Toby Varland shared how their industrial electroplating shop transitioned to a Telegraf-InfluxDB-Grafana (TIG) stack for their industrial IoT monitoring needs. He also discussed how they’ve transformed their ability to analyze and visualize each datapoint created in the shop by using Grafana as their primary visualization platform.
‘There are almost no barriers to entry’ in Grafana
With Varland’s legacy Opto22 system, there was just one piece of software managing the collection, logging, and visualization of data coming from room-sized machines involved in fairly complicated processes with many different variables. Since that software wasn’t really designed to be a monitoring tool, it required considerable configuration to produce limited telemetry.
By setting up a TIG stack (Telegraf for data collection, InfluxDB for storage, and Grafana for contextualizing and displaying data), Varland created a system that is much more automated and provides a better, customizable visualization experience. Varland chose Grafana, in part, because it was so easy to get started.
“There are almost no barriers to entry for this,” said Varland, who adds that the open source version of Grafana takes minimal compute power and can be up and running within 10 minutes. The best part? He saw the value right away. “I was amazed in about an hour,” said Varland. “There’s almost nothing standing in the way of getting started.”

Optimizing automation with high-impact Grafana dashboards
With their updated architecture, everything is optimized to run on separate, specialized components. It’s all designed for multiple simultaneous remote client connections, and, most importantly, they can create any type of visualization they need with Grafana.
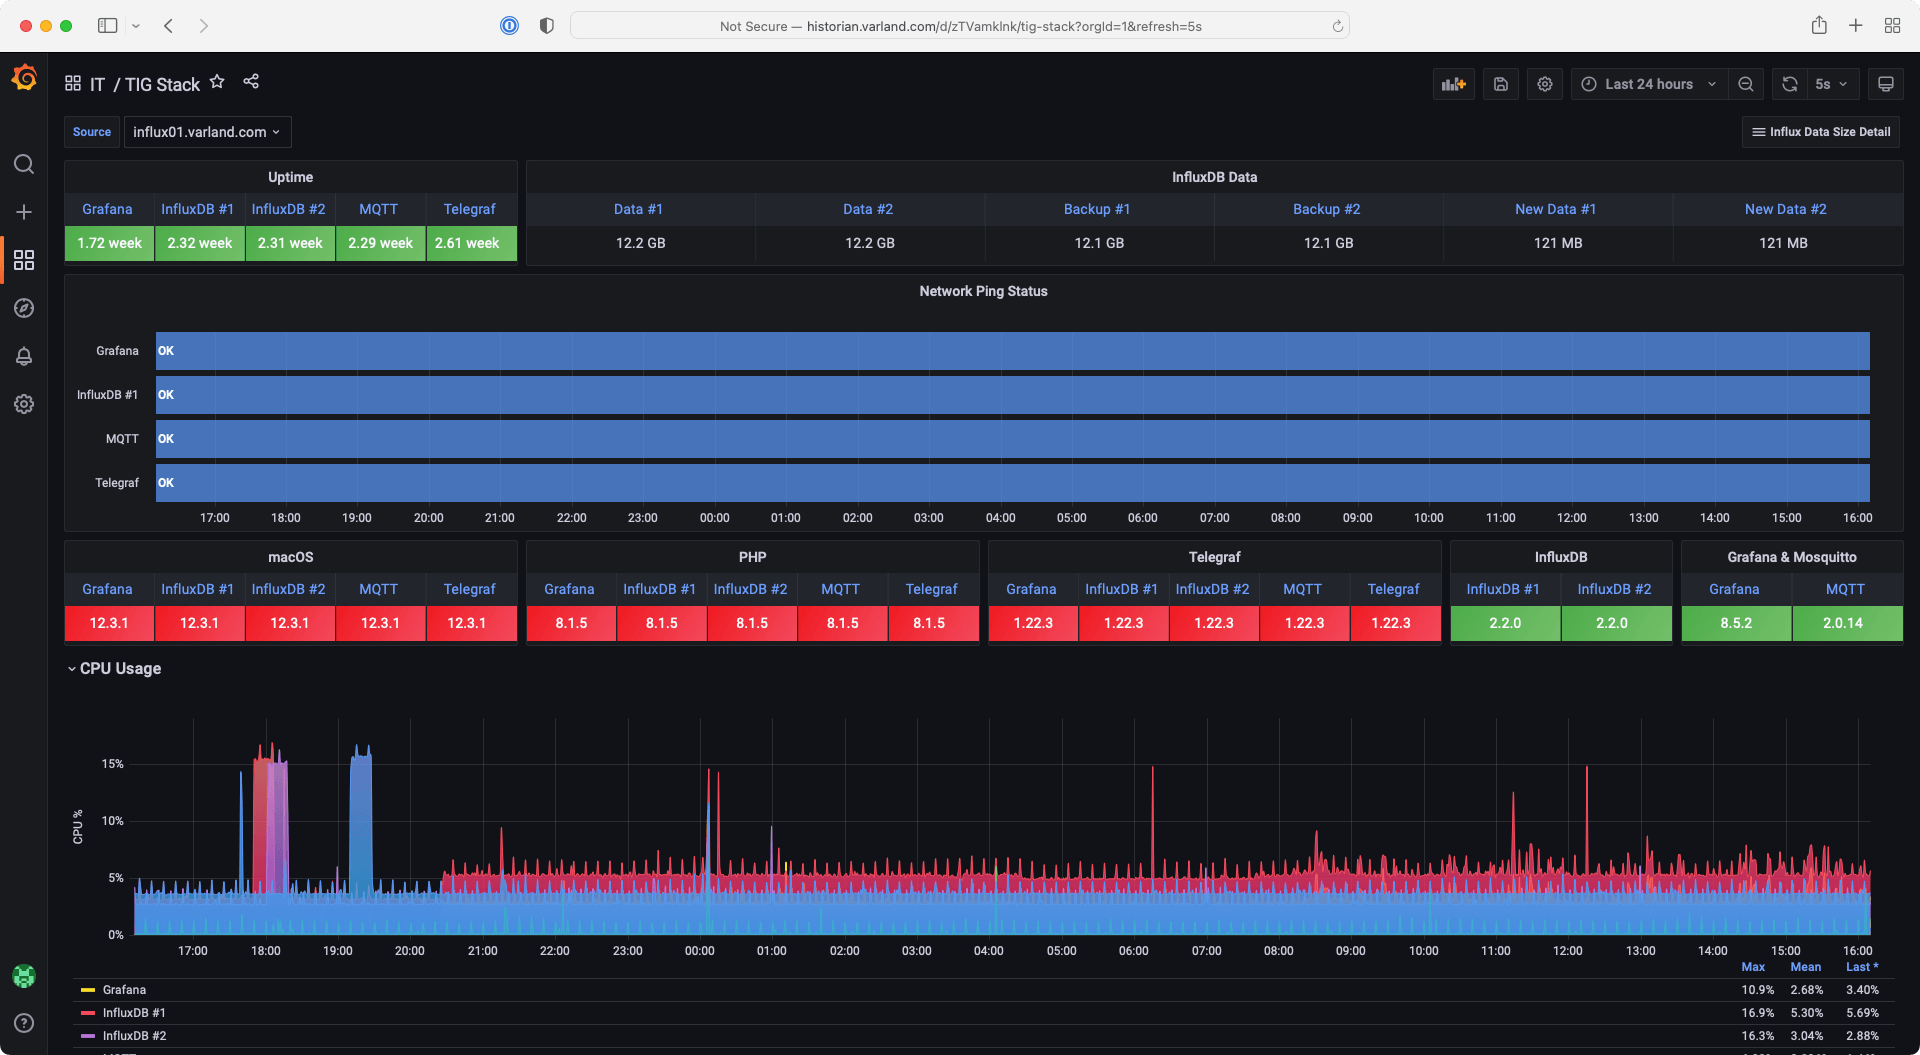
“Whatever you can dream of you can probably find. And if not, there’s a bunch of resources for how to build it,” said Varland. With Grafana, the team can create visualizations that use histograms, graphs, and tables to display key metrics all at once. Varland uses everything from state timelines to color-coded line graphs to visualize key statistics and share metrics across the company.

Varland is also able to aggregate and analyze data more robustly now. Grafana provides query options and customizations so the team can create visualizations that suit their data best. They can also look at values across much bigger ranges of data to provide better insights.
Overall, the transition from their legacy solution to a TIG stack — with Grafana as the primary visualization platform — has transformed the way Varland Plating monitors and uses data to make better business decisions. “Grafana has been a real godsend for my company,” said Varland. “We are a small company, so we don’t have a limitless budget for this sort of thing. Grafana has really filled a need for us.”
Watch the full session to see more of Varland Plating’s industrial IoT monitoring dashboards and hear how they utilize templates and variables to quickly create visualizations. All our sessions from GrafanaCONline 2022 are now available on demand.


