5 key benefits of Kubernetes monitoring
Kubernetes made it much easier to deploy and scale containerized applications, but it also introduced new challenges for IT teams trying to keep tabs on these newly distributed systems.
Ops teams need proper visibility into their Kubernetes clusters so they can track performance metrics, audit changes to deployed environments, and retrieve logs that help debug application crashes. And while Kubernetes monitoring calls for different tools and techniques than older iterations of infrastructure monitoring, the goal is still the same — ensure systems are running properly and respond quickly when problems arise.
In this blog, we’ll highlight the biggest benefits of Kubernetes monitoring. We’ll also discuss why Kubernetes Monitoring in Grafana Cloud can help you achieve those benefits much more efficiently.
5 benefits of Kubernetes monitoring
Production applications need to be monitored so you can detect errors, optimize resource usage, and manage costs. Kubernetes is no different: Monitoring is often the difference between an effective cluster and one that’s underused and performs poorly.
1. Real-time alerts and early error detection
Proactively monitoring your Kubernetes clusters helps you detect errors early, before they affect your users. Log files, traces, and performance metrics provide visibility into what’s happening in your cluster, giving you advance warning of usage spikes and increasing error rates. Real-time alerts can inform you as soon as problems begin, avoiding awkward conversations that can result when users are the first to find an issue. This reduces service restoration time, which protects your brand’s reputation.
2. Better workload management and optimization
Comprehensive monitoring facilitates better workload management and more optimal use of your resources. Monitoring your Kubernetes cluster could reveal there’s too much resource contention, or uneven application pod distribution across your nodes. Simple scheduling adjustments such as setting affinities and anti-affinities can significantly enhance performance and reliability, but you’ll miss these opportunities without insights into real-world cluster usage.
3. Easier troubleshooting
Monitoring offers assistance when you’re troubleshooting problems. Accessing logs from your application and Kubernetes components is often the best way to discover reproduction steps and work towards discovering root causes. Without a monitoring solution, you’d have to hypothesize probable sources of issues, then use trial and error to test fixes. This increases the workload for developers, especially newcomers who are unfamiliar with the system. Being able to pinpoint problems earlier minimizes downtime and encourages everyone to contribute.
4. Real-time cost visibility
Kubernetes bill shock is real. Auto-scaling architectures let you adapt in real-time to changing demand, but this can also create rapidly spiraling costs. Monitoring is essential so you can view the number of nodes, load balancers, and persistent volumes that are currently deployed in your cloud account. Each of these objects will usually incur a separate cost from your provider.
5. Powerful insights
Kubernetes monitoring can yield unique insights that highlight opportunities to enhance your service. Beyond simple performance metrics, monitoring helps reveal how users interact with your application, which can inform future product decisions. Data from components such as ingress controllers will reveal the endpoints that are called the most, as well as the amount of data flowing through your infrastructure. This information provides a starting point when looking for features that need further expansion, either due to active engagement or low use because of poor discoverability.
Try Kubernetes Monitoring in Grafana Cloud today
Clearly, there are many reasons to monitor your Kubernetes clusters. However, getting these benefits can be incredibly arduous when it’s done manually. It also raises the likelihood of errors, which can unknowingly escalate problems.
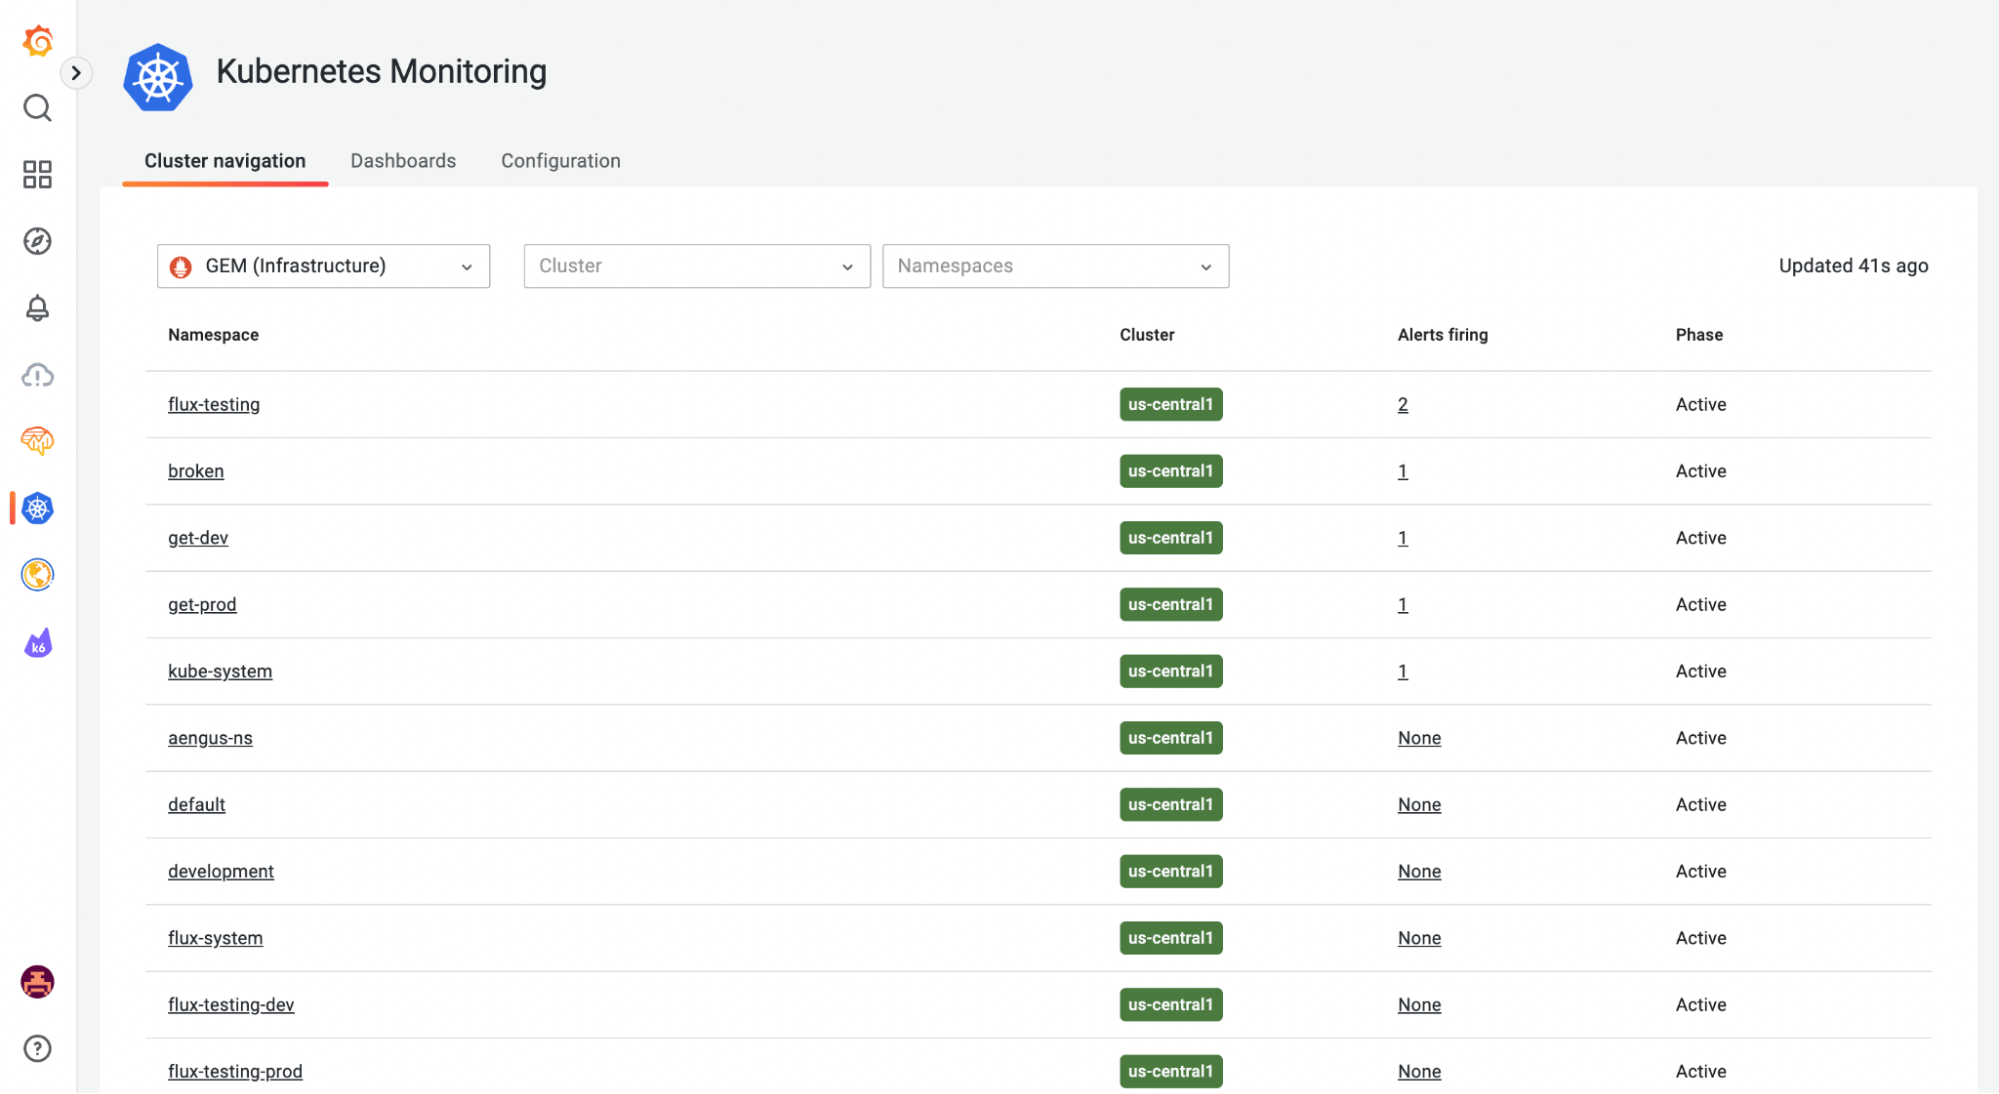
This is why we recently introduced Kubernetes Monitoring in Grafana Cloud, which handles many of those manual difficulties for you so you can focus on getting the most out of your Kubernetes monitoring. Whether you’re an SRE, application developer, or DevOps administrator, Kubernetes Monitoring in Grafana Cloud makes it easier to troubleshoot incidents, roll out changes, and maintain servers.

Kubernetes Monitoring is available to all Grafana Cloud users, including those on the generous free tier. To get started, all you have to do is enable the integration in your Grafana Cloud account and install the Grafana Agent onto your clusters. Within minutes, Kube-state metrics will be shipped to Prometheus and Grafana, and users will have access to all their Kubernetes metrics, logs, and events, as well as prebuilt dashboards and alerts.

To learn more, check out our Intro to Kubernetes monitoring guide.
If you’re interested in exploring how Kubernetes Monitoring in Grafana Cloud can help your organization, go to our Kubernetes solutions page, read our related Kubernetes Monitoring documentation, or watch our webinar “Kubernetes monitoring out-of-the-box with Grafana Cloud” on demand.
If you’re not already using Grafana Cloud — the easiest way to get started with observability — sign up now for a free 14-day trial of Grafana Cloud Pro, with unlimited metrics, logs, traces, and users, long-term retention, and access to one Enterprise plugin.
James Walker is the founder of Heron Web, a UK-based software development studio providing bespoke solutions for SMEs. He’s experienced in delivering custom software using engineering workflows built around modern DevOps methodologies. James is also a freelance technical writer and has written extensively about the software development lifecycle, current industry trends, and DevOps concepts and technologies.


