How Grafana helps Green City Solutions combat air pollution
Liang Wu is Co-founder and CIO at Green City Solutions, with a background in business administration and media informatics.
During my occupational stays in China, I experienced the impact of bad air quality and discovered the benefits of clean air in hotspot areas. As a TedX speaker and member of the World Policy Forum, I believe it is our responsibility to raise our voices for the necessary changes to our environmental challenges and act accordingly. And I am convinced that nature-based solutions can play an essential role to contribute to our well-being.
Thus, I co-founded Green City Solutions, a biotech startup based in Bestensee, Germany, that combines one of the oldest land plants, moss, with the latest IoT technology to combat air pollution and heat islands in urban spaces.
With the help of sensors, intelligent ventilation, irrigation, and software, Green City Solutions can make the natural cleaning power of living moss usable and measurable. The central elements within all our products are the active moss filters that demonstrably clean and cool the city air as well as Grafana to visualize the continuous stream of data we collect and to monitor our company’s moss farm and operations in the field.
Capturing dust and data: How moss improves air quality
Mosses are tough plants that can survive drought and other harsh conditions. They’re also environmentally efficient because they bind and metabolize fine dust and other air pollutants and turn them into biomass. In addition, mosses cool the surrounding air by evaporating water on their enormous leaf surface.

But to use the plant’s full potential to purify the air, we needed to determine not only the best-performing moss species. We also had to identify the perfect conditions to help these plants grow, filter pollutants, and cool the air. By maintaining an ideal, consistent range of humidity, mosses are kept in an active metabolic state, which increases their ability to bind air pollutants and convert them into biomass.
Green City Solutions creates those optimal conditions with the help of different sensors and IoT technology deployed within our biofilters as well as at test sites, throughout our moss farm, and across various hotspots across Europe. The data is then monitored in near real-time to make sure the irrigation and ventilation of our city air filters are working in balance with the moss health and filter performance.
Visualizing an ‘invisible problem’ with Grafana dashboards
The challenge, however, is collecting the data from all these different sources and databases and visualizing them in a unified way so various departments can understand the correlations between their work and access all the information they need.
We pair image recognition methods and proper data labeling to enhance long-term data analysis. Those efforts, in combination with machine learning, help to further optimize performance and resource efficiency.
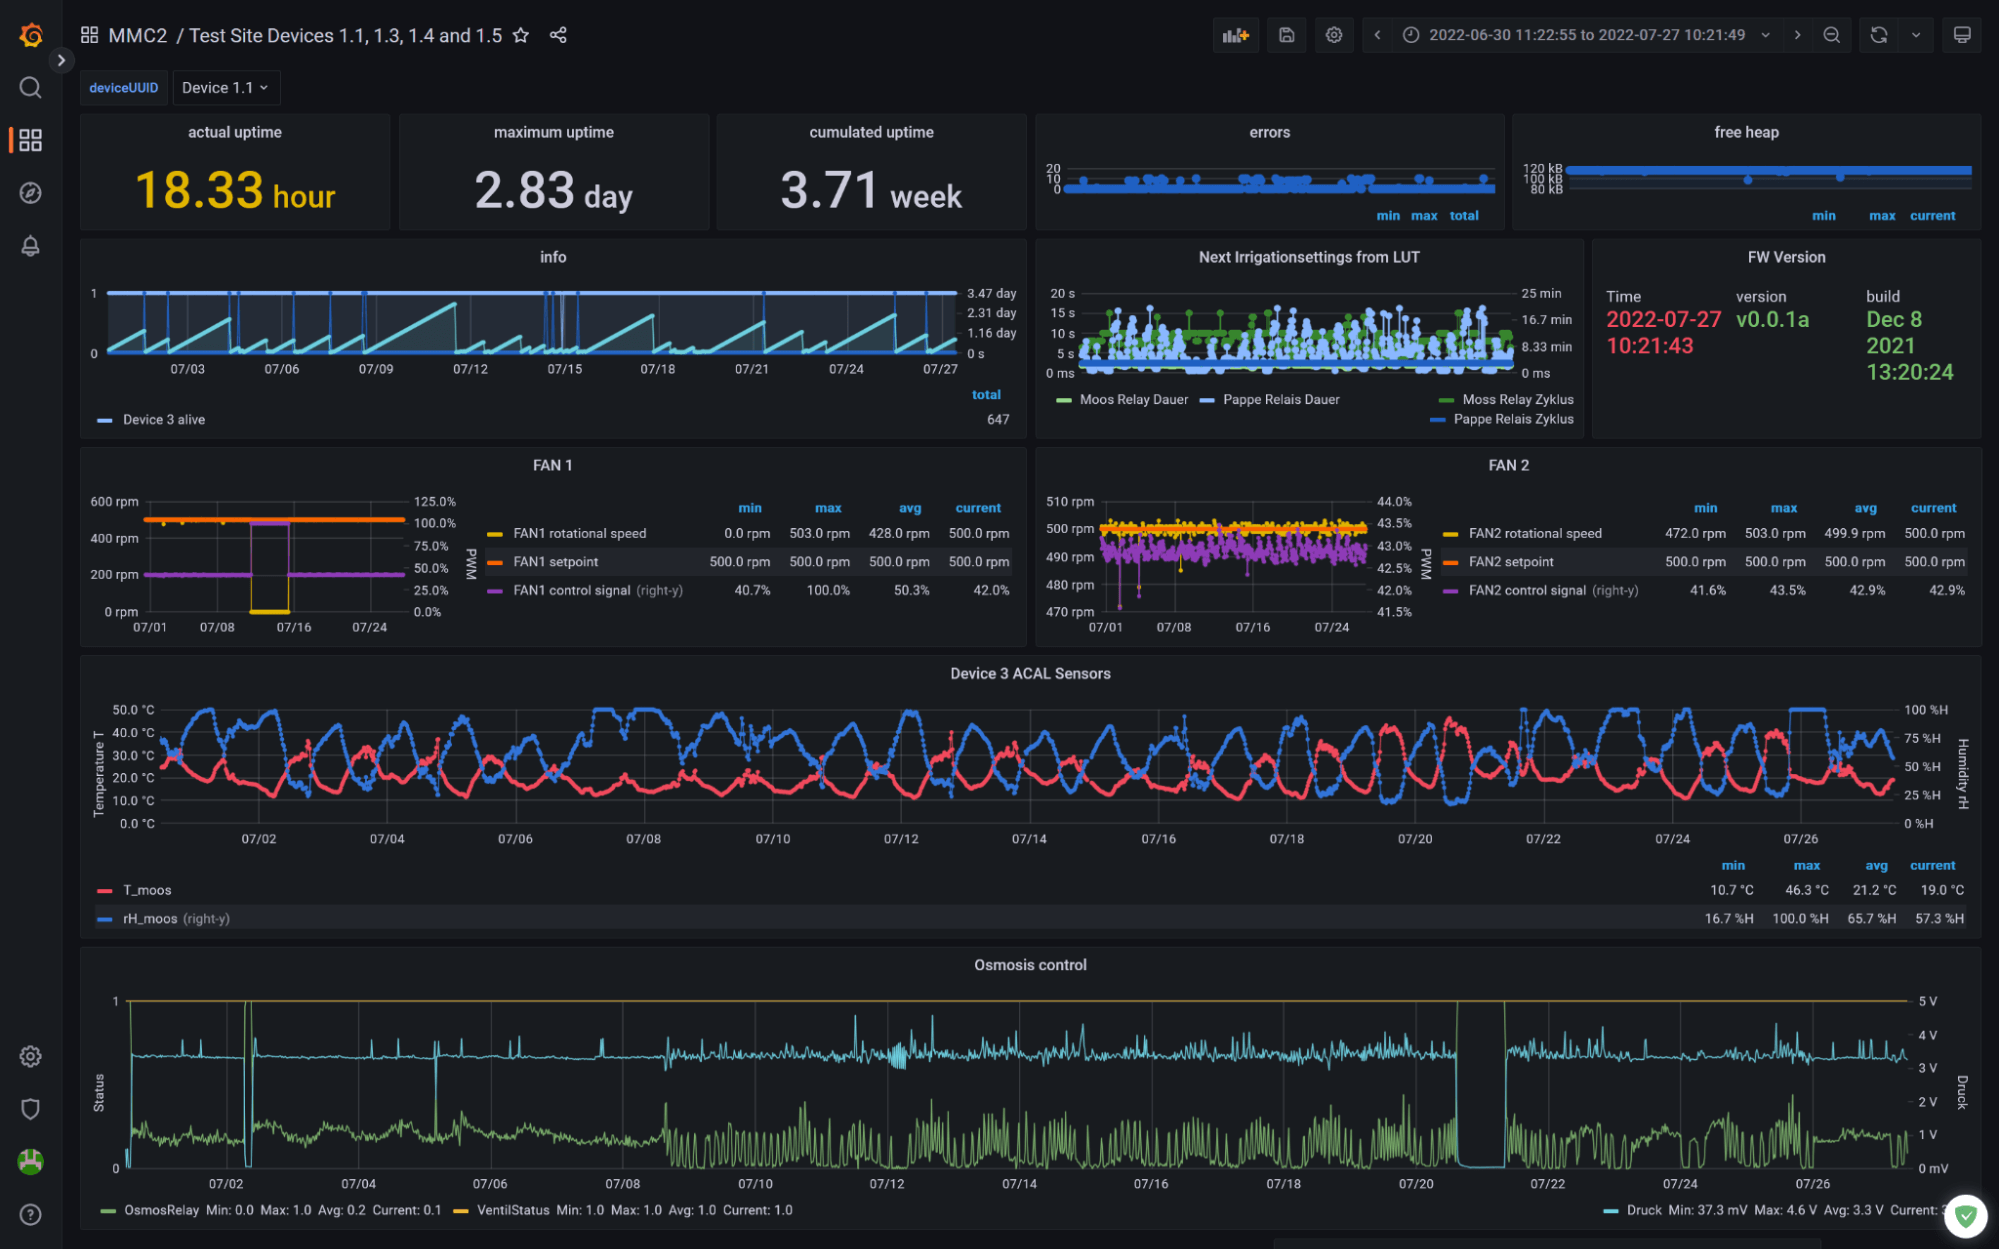
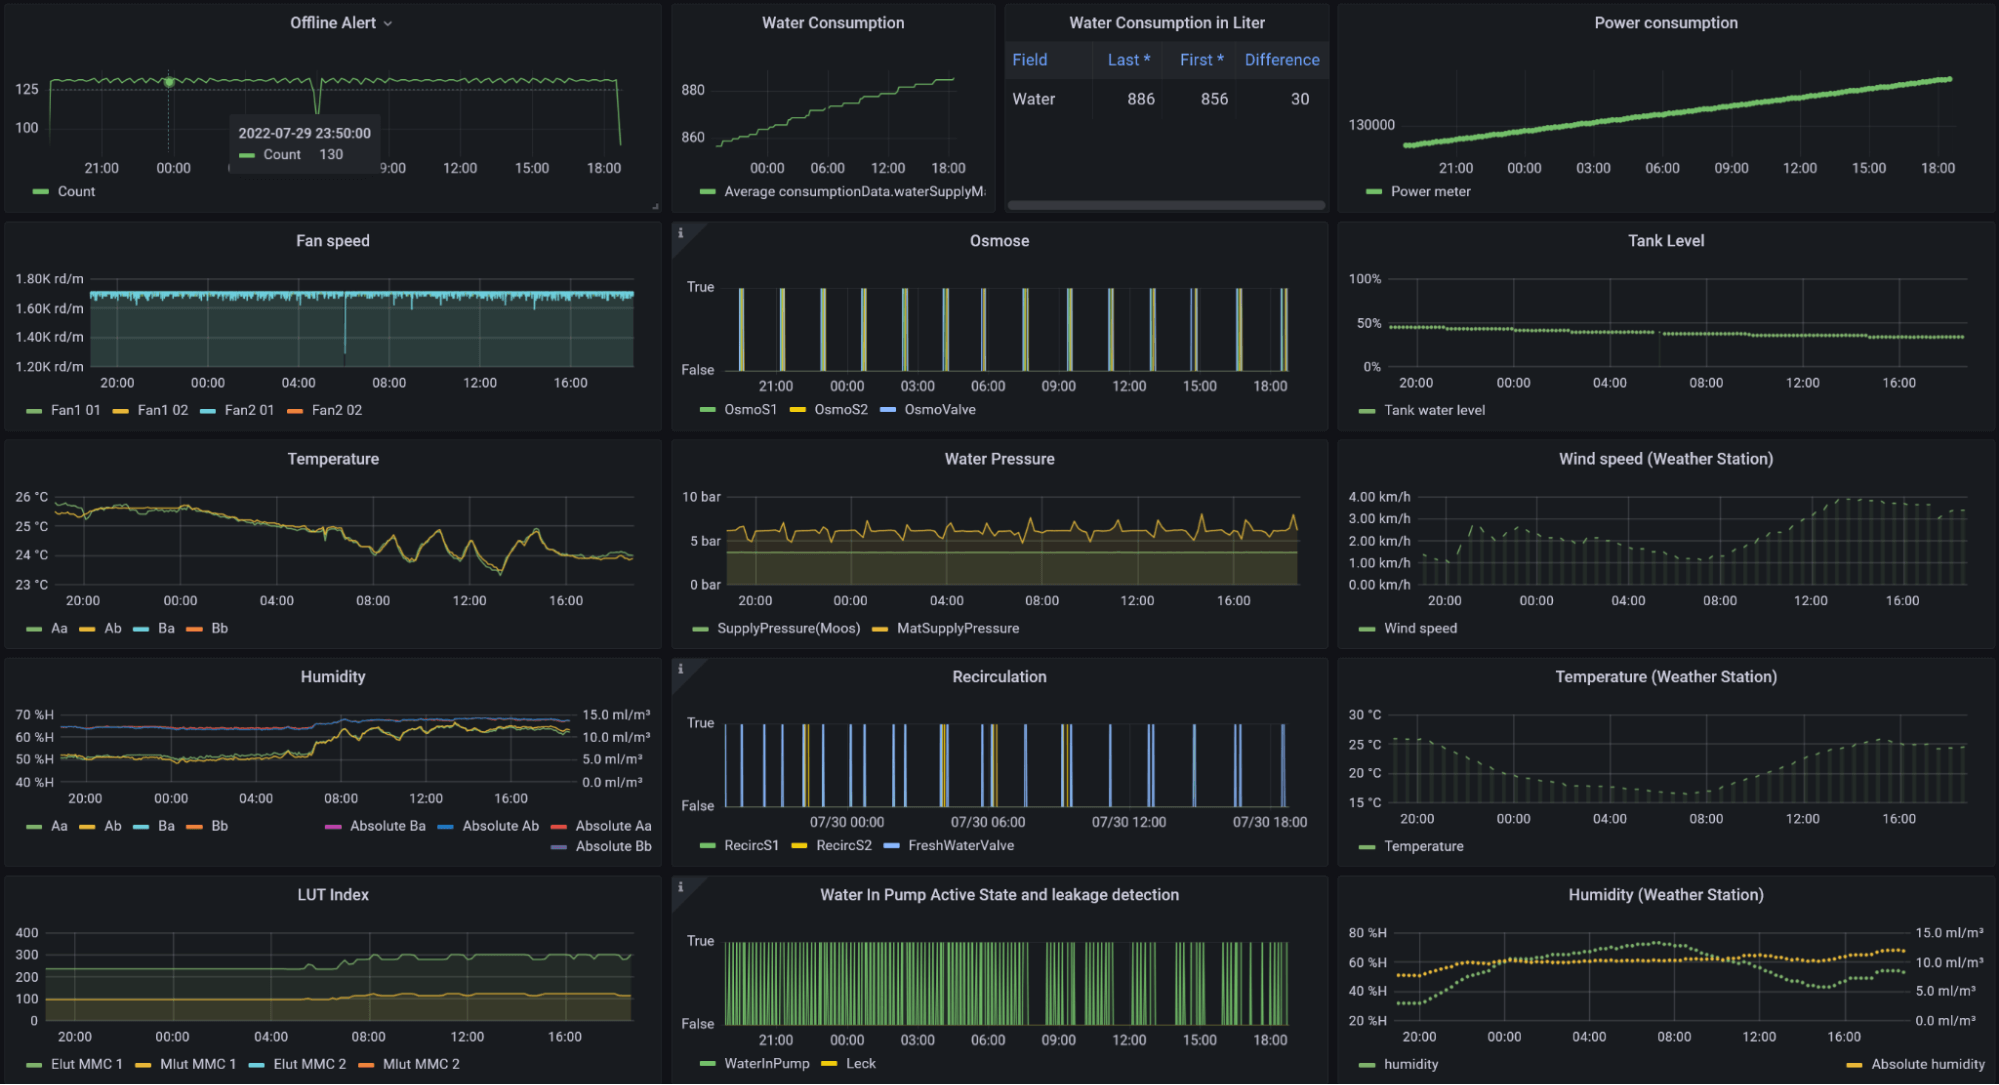
Grafana solved our visualization challenge by pulling our disparate data sources into a single pane of glass. For example, the dashboard below visualizes and monitors ventilation, irrigation settings, as well as environmental data stored in InfluxDB and fed by MQTT and Telegraf. Taken collectively, we’re able to observe the correlation between temperature and humidity.

With these Grafana dashboards in place, we have been able to effectively monitor, track, and analyze data for three key components of our business.
1. Monitoring the world’s only speed-growth moss farm
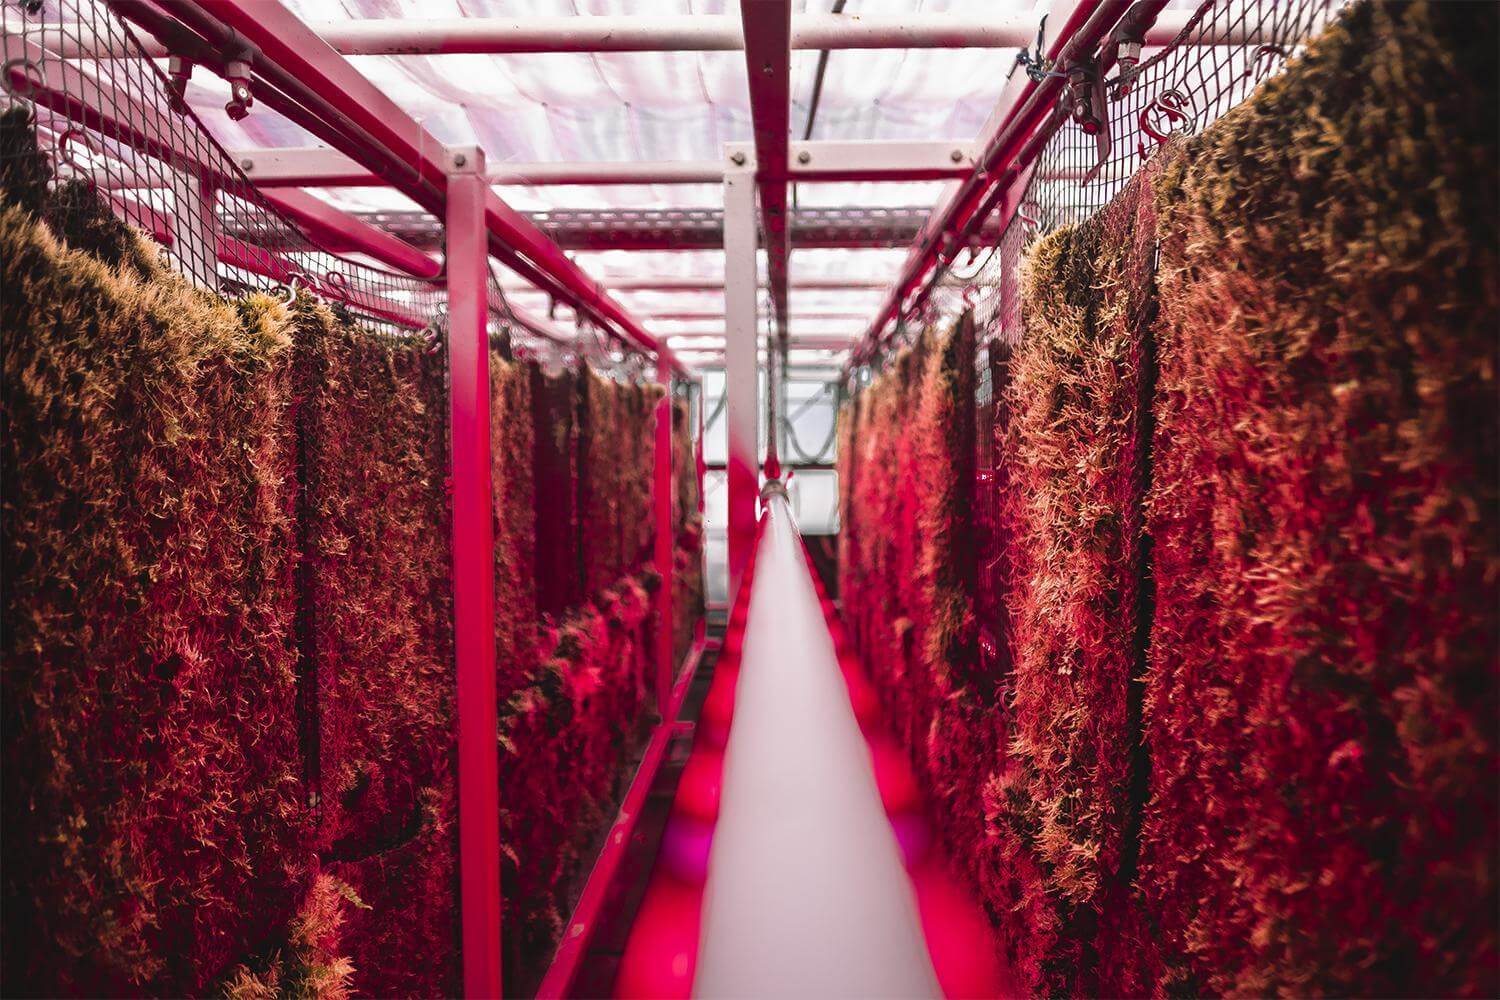
We use Grafana dashboards to monitor our unique moss farm, which is located on the outskirts of Berlin. Here, the 16.15 square foot (1.5 square meter) sections of high-performance mosses are grown as vertical mats to maximize the use of space and resources. With irrigation, plant lights, and temperature sensors, we create and automate the perfect conditions for the mosses. As a result, they can grow into dense moss mats within 12 to 16 weeks. In nature, the same growth can take up to four years.

We installed sensors in the moss farm to detect the brightness, temperature, humidity, carbon dioxide levels and other variables. We also use Grafana Alerting to send trigger messages to our moss farm team for quick response in case of emergencies.
For example, we use dashboards to display solar radiation and temperature fluctuation in a simple, clear way. When we experienced a heat wave over the summer, this type of visualization helped us make the observation of this unusual event more understandable and intuitive for everyone.

2. Monitoring moss biofilters in the field
Currently, we have 40 biofilters installed across European cities, including London, Cork, and Lisbon. To monitor our biofilters in the field, our operations team has created various Grafana dashboards so they can get a quick overview of the overall system or a selection of units. By creating alerts, we can detect issues like power outages, an empty water tank, or a malfunction in the ventilation or irrigation systems in near real-time and forward these alerts to our network of external maintenance partners. By using Webhooks, we can even implement a direct connection to the communication tools of our choice.

Whenever an issue in the field occurs, Grafana also makes it possible to conduct a comprehensive analysis of the biofilters. The dashboards showcase the health and performance of the mosses and biofilters — and can even help us to detect impending failures.

3. Providing valuable insights to customers
Since air pollution is not always visible to the human eye, we also use Grafana dashboards to visualize air quality-related data and provide them as part of performance reports to our customers, which include companies such as Deutsche Telekom, cities like London and Lisbon, and real estate developers like Panattoni.
The dashboards help us to make an intangible problem more relatable and show the direct impact of environmental factors on air quality, e.g., wind speed and wind direction impacts on air pollution.

Learn more about Green City Solutions
Grafana dashboards have improved our workflows and they have become an integral part of our daily work in managing our innovative technologies across various locations in Europe. With every biotech product Green City Solutions installs, we hope to remove 100 tonnes of carbon dioxide from our atmosphere, amounting to a total of three million tonnes by 2030.
If you want to learn more about Green City Solutions, visit our website or follow us on LinkedIn or Instagram.
Want to share your Grafana story and dashboards with the community? Drop us a note at stories@grafana.com.


