Set up instant SNMP monitoring with the new SNMP integration in Grafana Cloud
Simple Network Management Protocol (SNMP) is an internet protocol that is used to collect information about network devices and manage them. Most of the modern devices connected to a network support SNMP, such as routers, switches, servers, printers, and more.
There are three different versions of SNMP (v1, v2, and v3). It most commonly operates on UDP ports 161 and 162. The most common versions being used are v1 and v2. The data can be collected from a network device through SNMP via polling.
We are excited to announce our new SNMP integration for Grafana Cloud, which is available now to all Grafana Cloud users, including those in our generous free forever tier. The integration uses an embedded SNMP exporter in the Grafana Agent which automatically collects data from configured SNMP targets.
Let’s walk through how to easily set up a Grafana Cloud account and start monitoring your SNMP devices!
How to configure the SNMP integration in Grafana Cloud
You can configure the SNMP integration in Grafana Cloud in three easy steps:
- A Grafana Cloud account is required to use the SNMP integration. If you don’t already have a Grafana Cloud account, you can sign up for a free account today.
- In your Grafana instance, click Integrations and Connections (lightning bolt icon), then click on the SNMP tile to install the integration.
- Follow the steps to set up and install the Grafana Agent on a server to start sending metrics to your Grafana Cloud instance. (The Grafana Agent must be able to access your network devices via UDP/TCP ports 161 and 162.)
How to monitor SNMP devices with Grafana Cloud
After the SNMP integration is installed, you will see a prebuilt dashboard and some rules designed for SNMP metrics.
Grafana SNMP dashboard
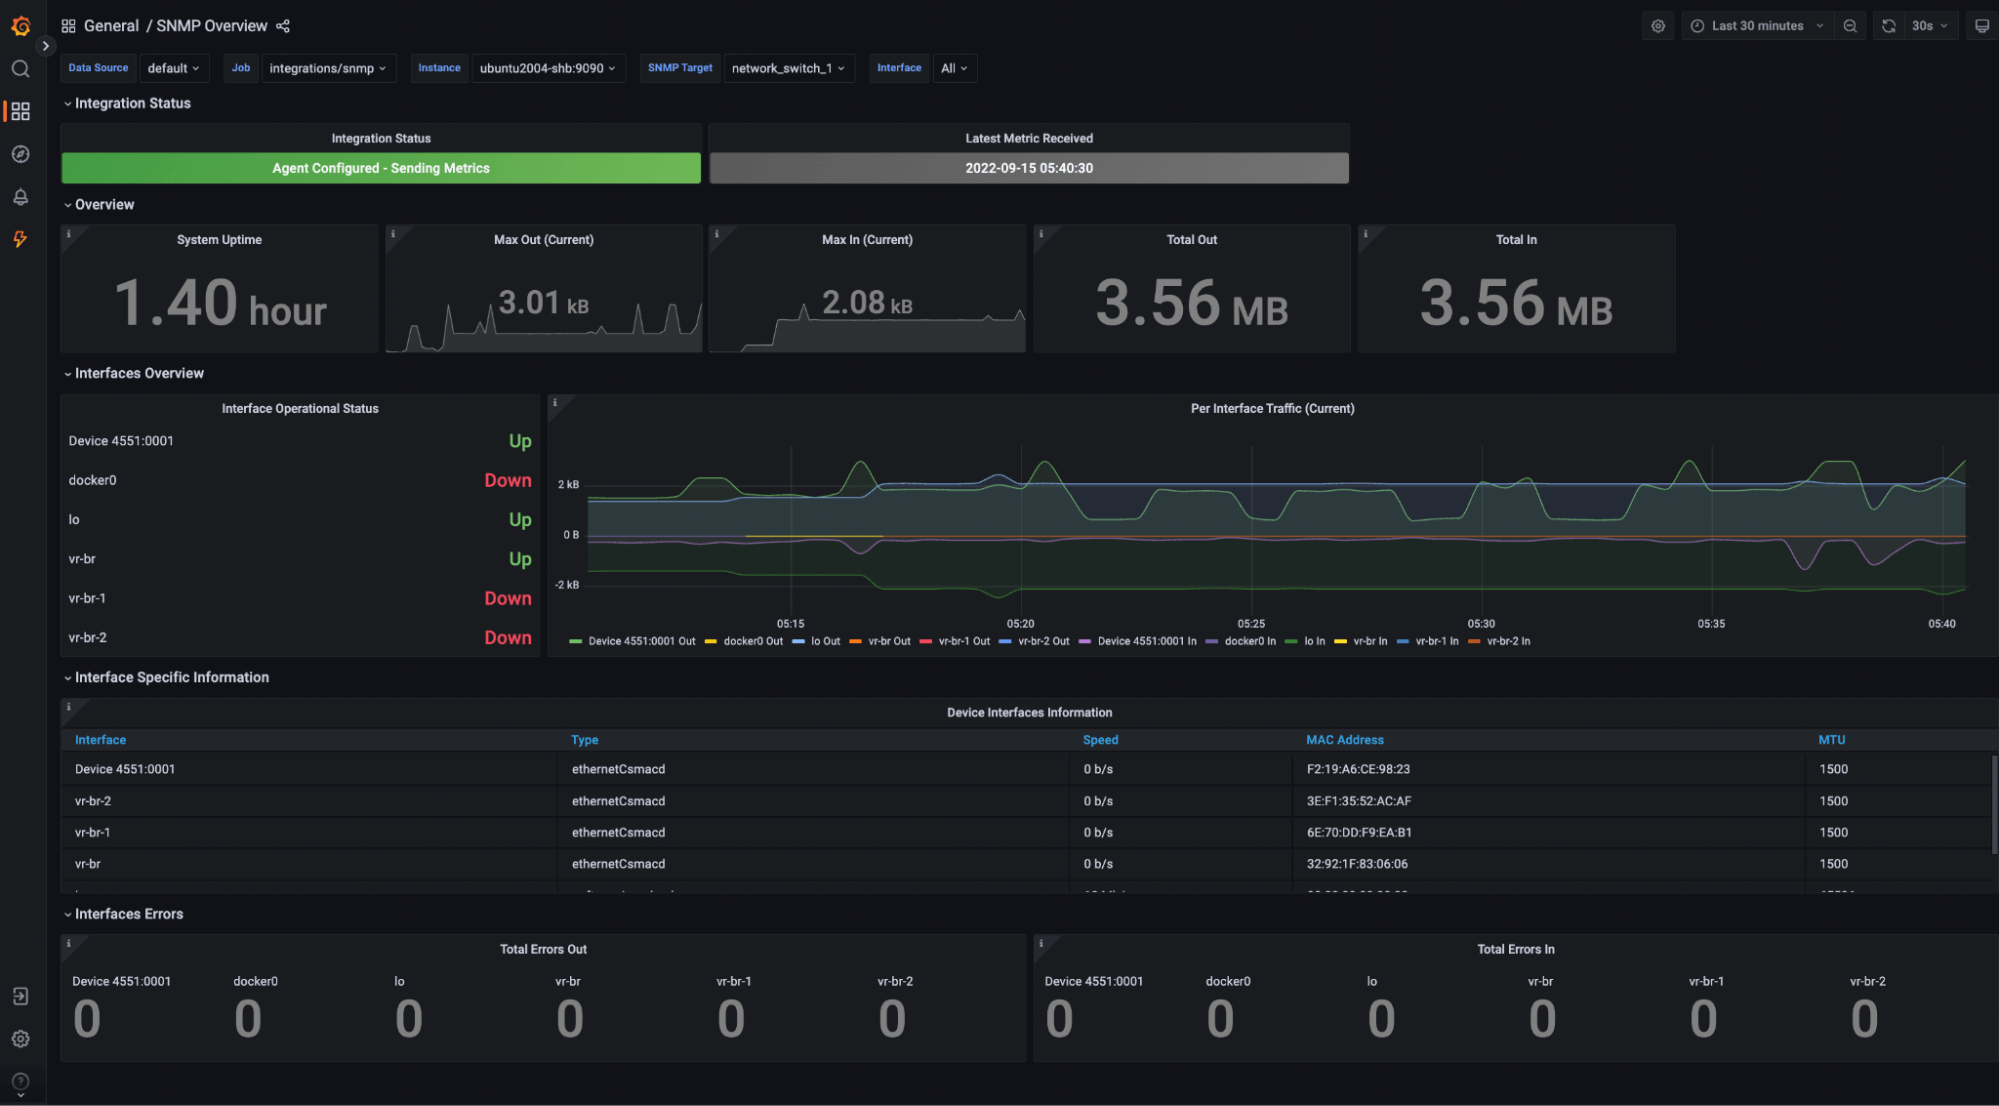
The Grafana SNMP overview dashboard provides you with overall statistics about your network devices.
From the drop-down, you can filter the SNMP metrics by:
- Job: usually integrations/snmp
- Instance: the hostname of the server running the Grafana Agent
- SNMP target: the actual target network device
- Interface: the interface of the target device
The dashboard shows important metrics reported by the network devices like:
- Uptime
- Network traffic activity
- Interface statuses
- Interface specifications
- In/Out error counts

Monitor a Linux host using SNMP
The SNMP reporting agent can also be installed on any Linux host, as well. The instructions to set up snmpd on different Linux distributions can be found in this how to enable SNMP on Linux machines guide. Once the snmpd is installed and running, you can install and configure the Grafana Agent on the Linux host to start monitoring the network metrics.
Learn more about the Grafana Cloud SNMP integration
The Grafana Cloud SNMP integration provides an easy way to get started with monitoring your network devices. For more information, check out the SNMP integration documentation.
Give our SNMP integration a try, and let us know what you think! You can reach out to the team in the #integrations channel of the Grafana Labs Community Slack.
Grafana Cloud is the easiest way to get started with metrics, logs, traces, and dashboards. We have a generous forever-free tier and plans for every use case. Sign up for free now!


