Troubleshoot in less than 60 seconds with Grafana: Inside NOS’s observability stack
It may seem like ancient history, but there was a time when telecommunications companies only had to worry about connecting customers over landlines. Today, their businesses depend on vast cellular networks to not only provide strong wireless phone coverage in countless locations, but also handle the demands of tablets, computers, and machine-to-machine communications.
NOS, a Portuguese telecommunications and media company, provides customers with mobile and fixed networks, cable and satellite television, and high-speed internet. “We have more services, many more nodes, and a lot more technologies,” says Ricardo Dinis, NOS’s Head of Mobile Network Analytics and I&D, who leads NOS’s recently-added mobile network analytics team within Mobile Engineering Department.
These days, NOS’s main tasks include identifying where their customers are experiencing problems, and looking out for huge spikes in traffic so they can address the issues causing them. “We are optimizing the network daily,” Dinis adds.
In order to stay nimble in the modern, scalable, flexible industry, NOS required an equally modern, flexible, scalable technology.
Since 2017, the company has relied on Grafana for monitoring those metrics. It’s made troubleshooting easier for the engineers, who can now analyze data in less than a minute. “We are much more efficient and we are delivering much better results with Grafana,” Dinis says.
Seeking a solution
Before NOS began using Grafana, it was using the Business Objects suite, which was only providing static reports that contained limited information. “You couldn’t do easy filtering and have the filters applied in all the panels and charts,” Dinis recalls. Plus, the time it took to access relevant data and do several daily analyses “became a pain point for the engineers.”

During its testing period, NOS immediately saw a difference in capabilities compared to what they were using. “In Grafana, it’s easier to drill down to the problem to filter the time series, and also to crosscheck data in several panels that are adjusting at the same time,” Dinis says.
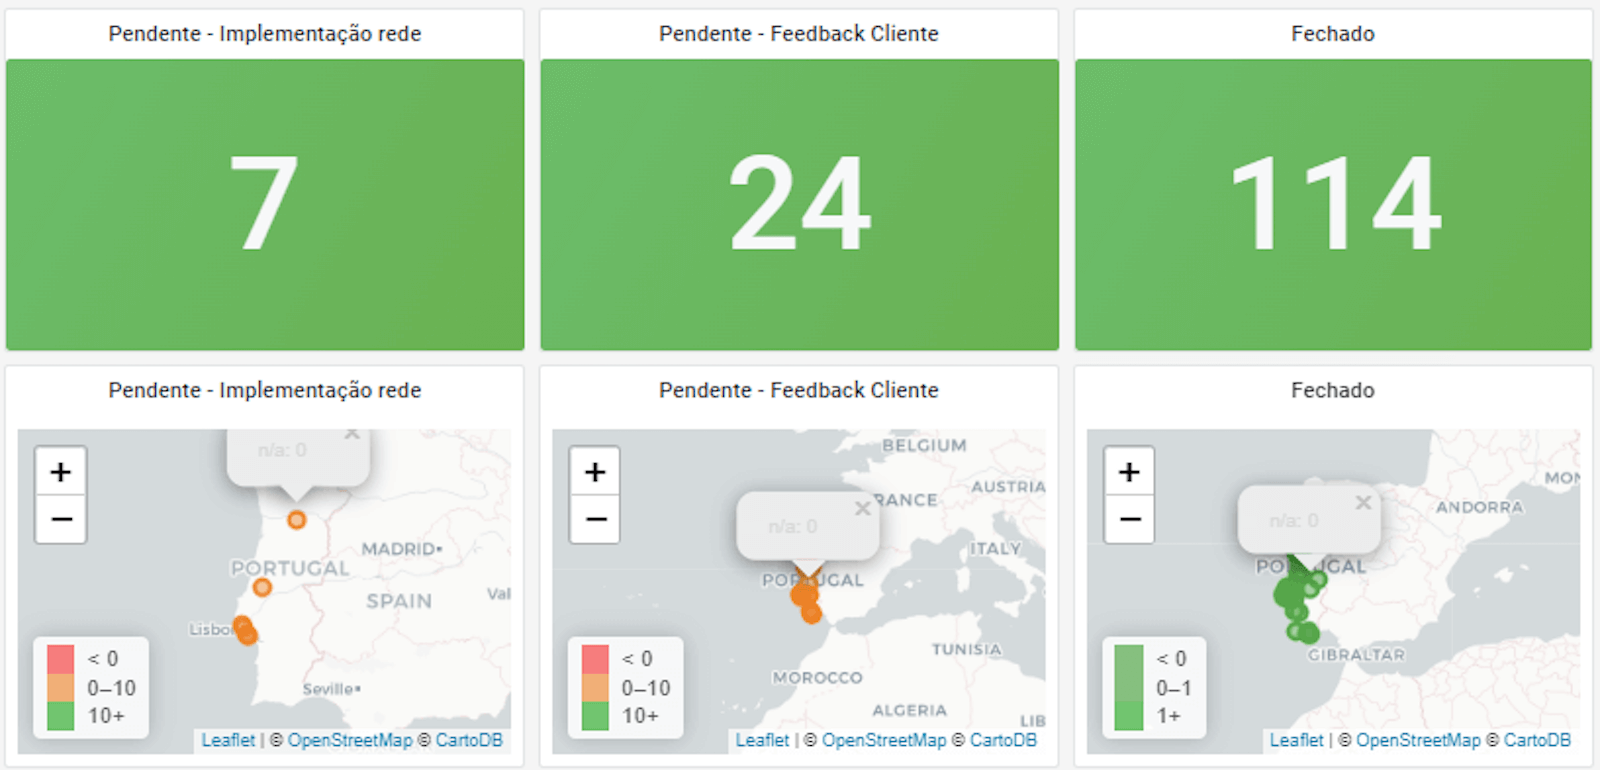
With that proven value — and because Grafana is so easy to learn — other teams at NOS have organically jumped in and adopted it for their purposes as well. Currently, there are about 30 radio network engineers in the department using Grafana. They are creating their own dashboards and adding new use cases on top.
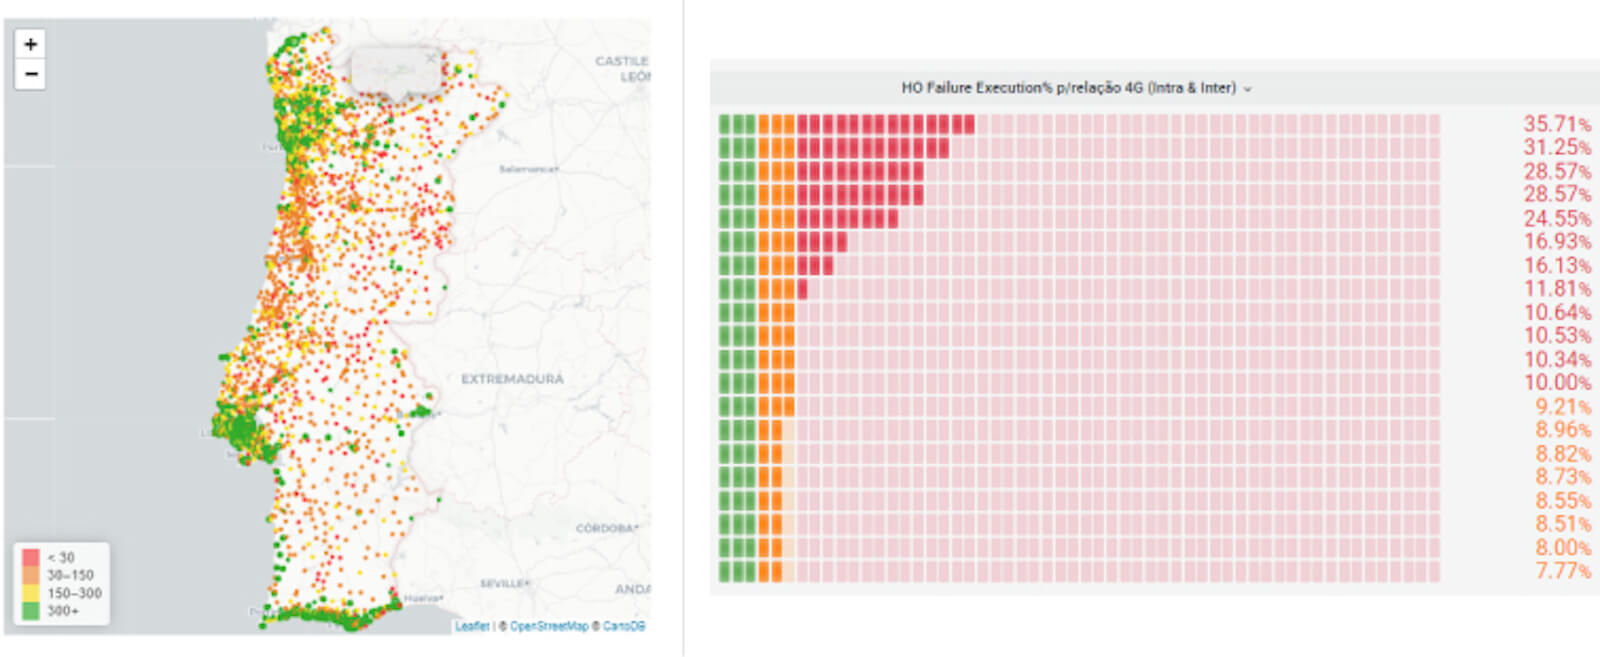
The NOS engineering team started using Grafana with radio access network KPIs and is evolving to add other Core network domains. “That way, we have a holistic view of the network that is crucial to troubleshoot and correlate across all network domains,’’ Dinis explains.


A ringing success
For NOS, Grafana has delivered a double win. On the technical side, engineers can now spend less time on a single issue, which means they are freer to help analyze and optimize additional things across the business. And because they’re able to see more data, they’re providing the business with better connectivity — which translates to happier customers.

By choosing Grafana as its observability tool, NOS is now set up for continued success in the telecommunications industry.
“We are much more efficient and we are delivering much better results with Grafana,” Dinis says.
To find out more about how NOS is using Grafana, read their full success story here.


