
How to profile AWS Lambda functions
This post was originally published on pyroscope.io. Grafana Labs acquired Pyroscope in 2023.
AWS Lambda is a popular serverless computing service that allows you to write code in any language and run it on AWS. In this case, “serverless” means that rather than having to manage a server or set of servers, you can run your code on-demand on highly available machines in the cloud.
Lambda manages your serverless infrastructure for you, including:
- Server maintenance
- Automatic scaling
- Capacity provisioning
- and more
AWS Lambda functions are a “black box”
However, the tradeoff that happens as a result of using AWS Lambda is that because AWS handles so much of the infrastructure and management for you, it ends up being somewhat of a “black box” with regards to:
- Cost: You have little insight into Lambda function costs.
- Performance: You can run into hard-to-debug latency or memory issues when running your Lambda function.
- Reliability: You have little insight into why your Lambda function is failing.
Depending on availability of resources, these issues can be balloon over time until they become an expensive foundation which is hard to analyze and fix post-facto once much of your infrastructure relies on these functions.
Continuous profiling for Lambda: A window into the serverless “black box” problem
Continuous profiling is a method of analyzing the performance of an application, giving you a breakdown of which lines of code are consuming the most CPU or memory resources and how much of each resource is being consumed. Since, by definition, a Lambda function is a collection of many lines of code that consume resources (and incur costs) on demand, it makes sense that profiling is the perfect tool to understand how you can optimize your Lambda functions and allocate resources to them.
While you can already use our various language-specific integrations to profile your Lambda functions, with the native approach, adding Pyroscope will add extra overhead to the critical path due to how the Lambda execution lifecycle works:
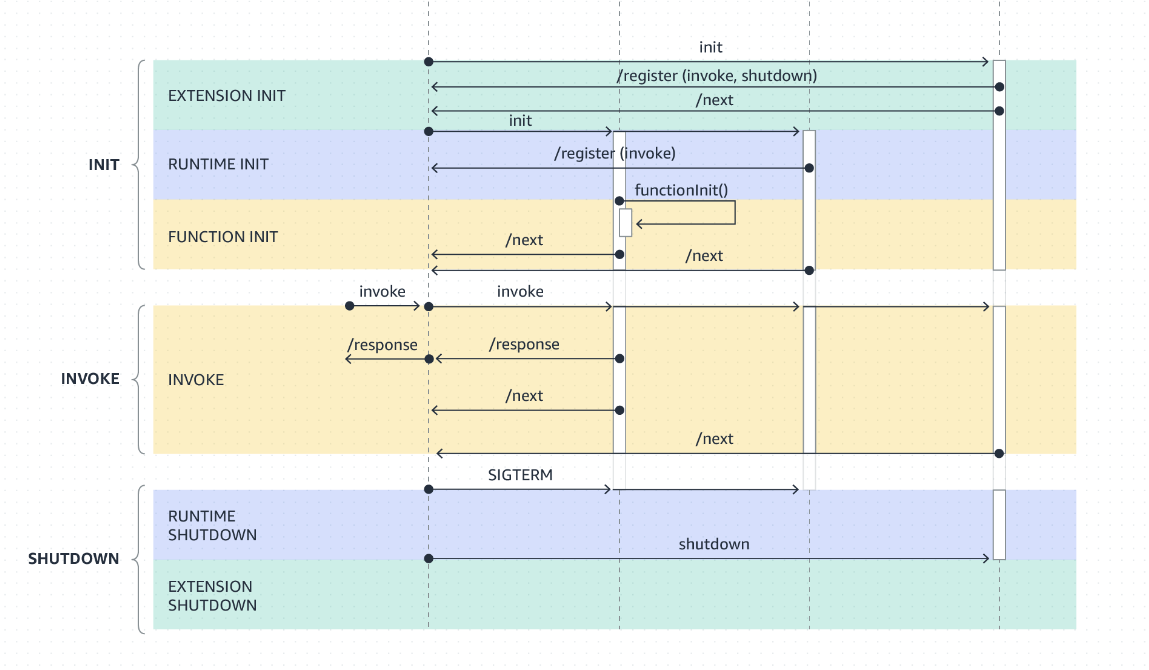
However, we’ve introduced a more optimal solution that gives you insight into the Lambda “black box” without adding extra overhead to the critical path of your Lambda function: our Pyroscope AWS Lambda extension.
Pyroscope Lambda extension adds profiling support without impacting critical path performance
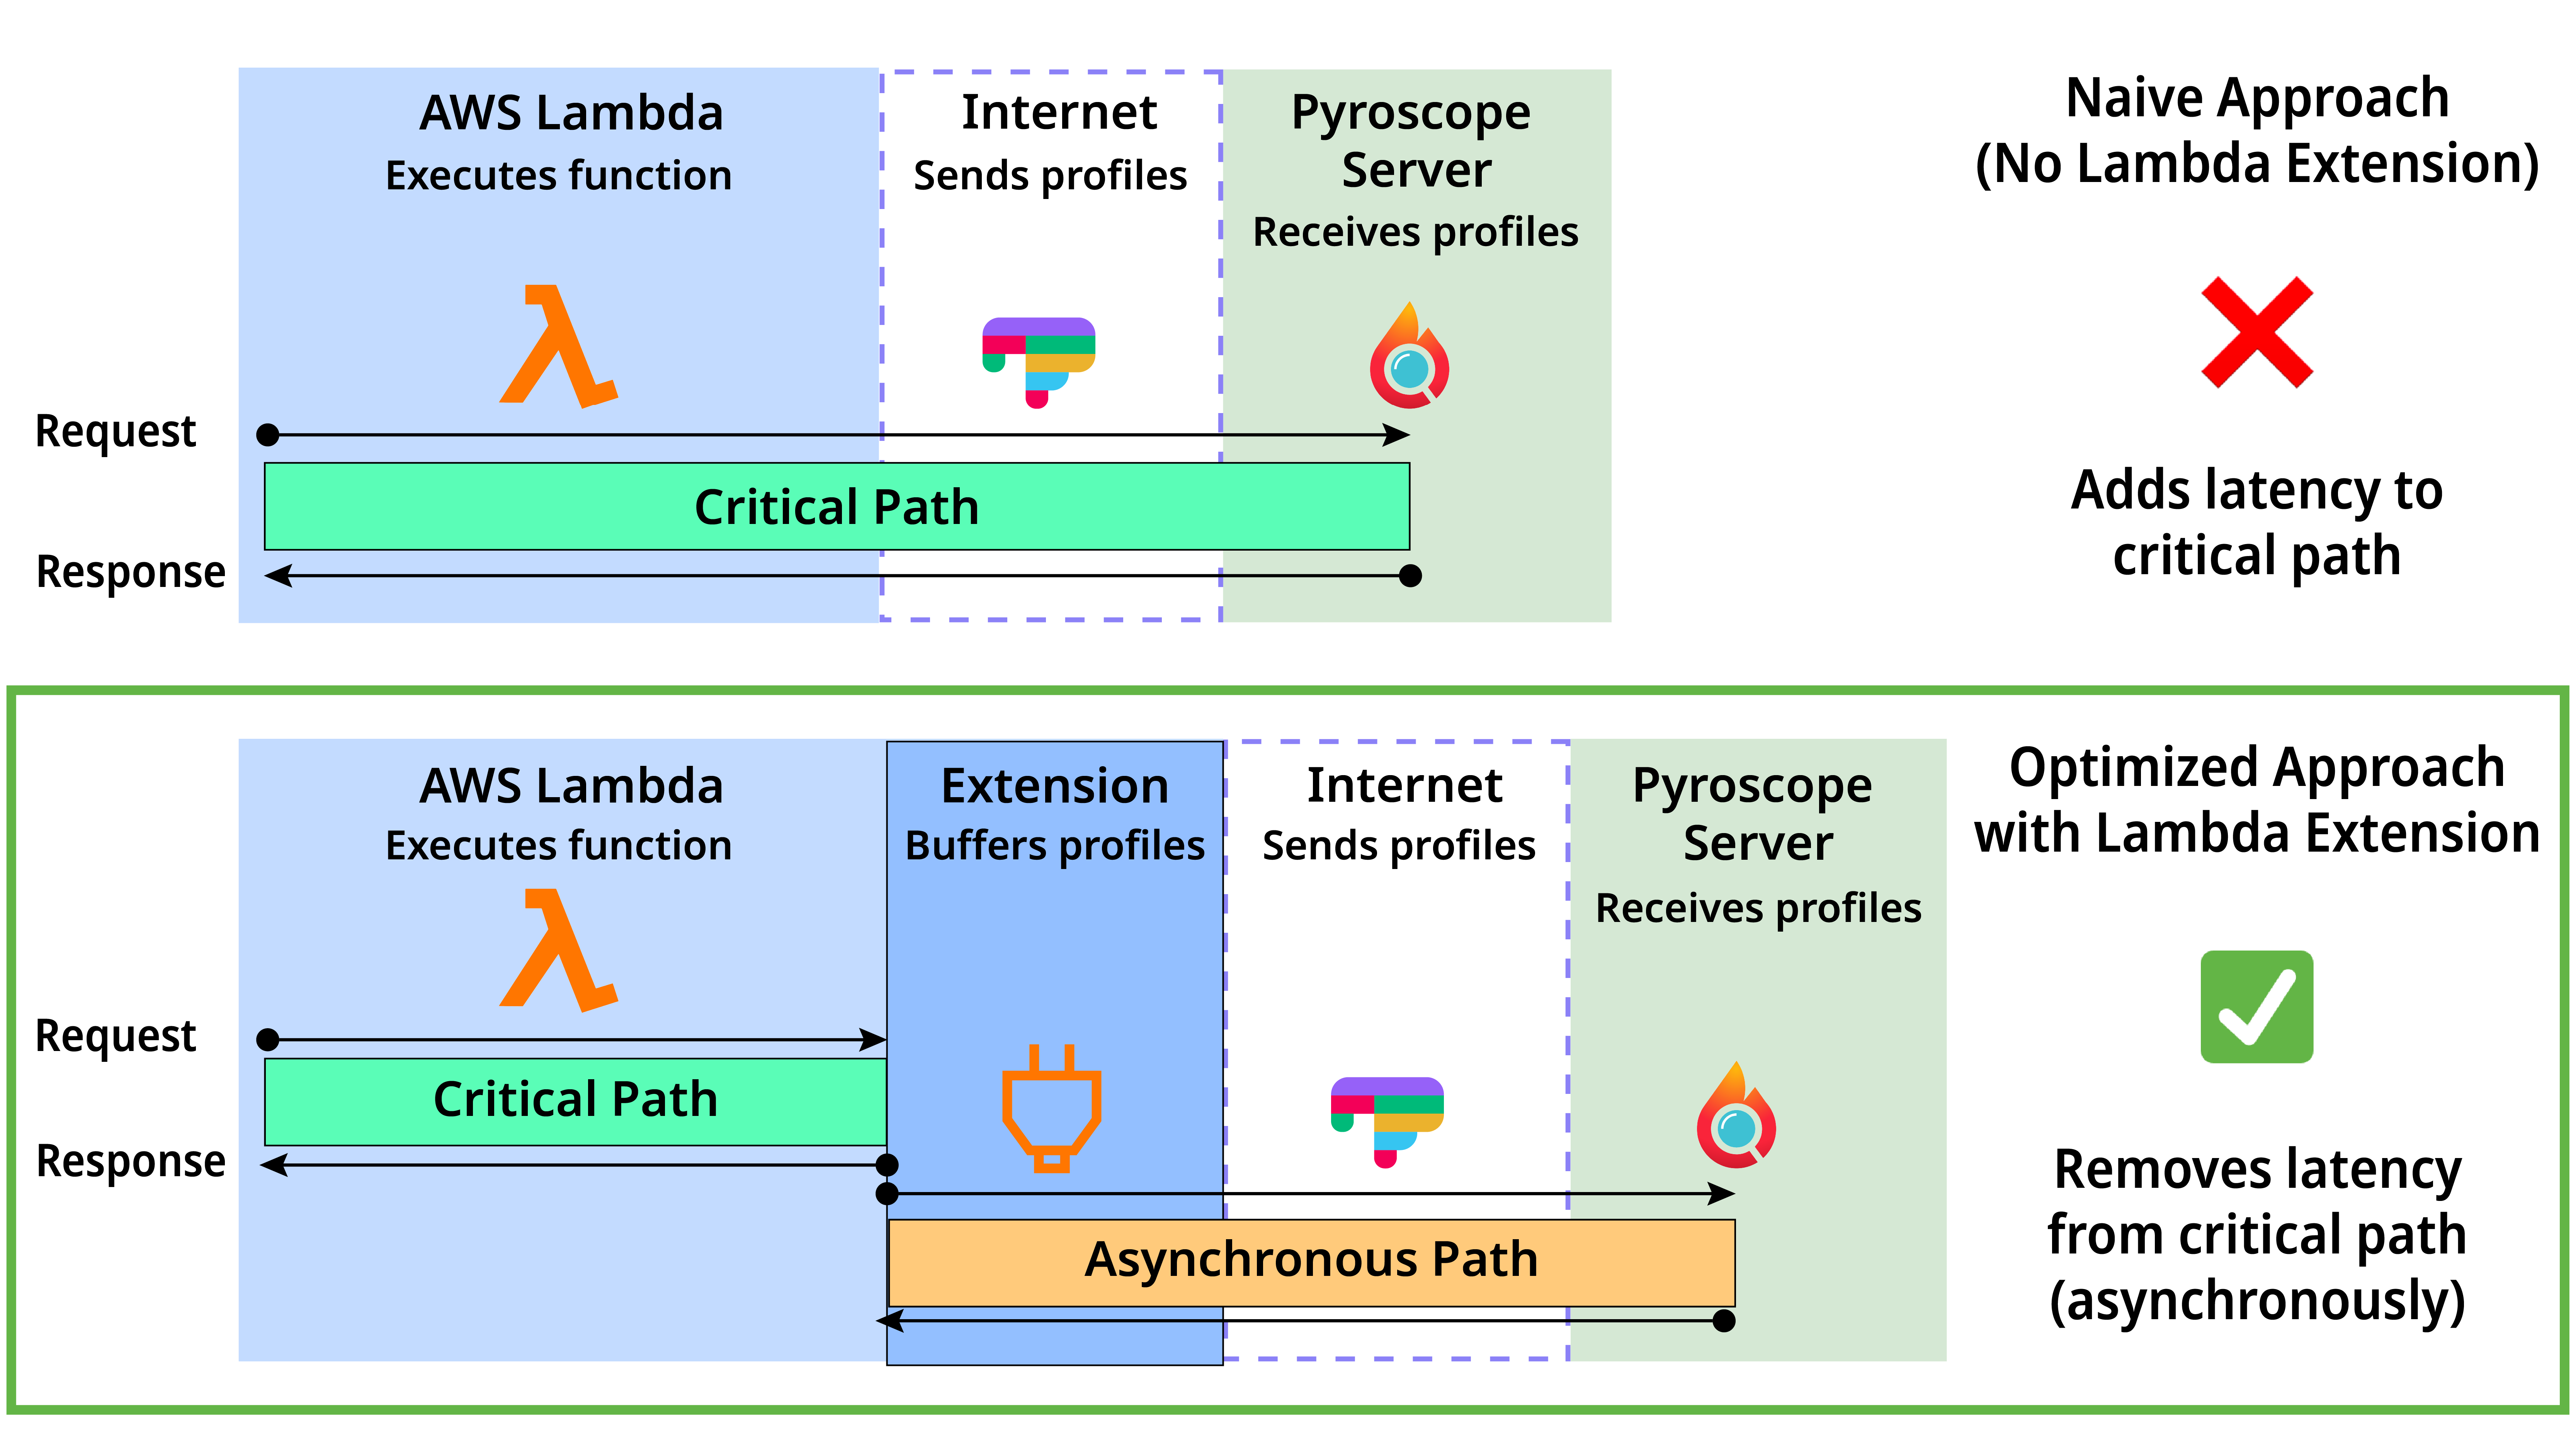
This solution makes use of the extension to delegate profiling-related tasks to an asynchronous path, which allows for the critical path to continue to run while the profiling-related activities are being performed in the background. You can then use the Pyroscope UI to dive deeper into the various profiles and make the necessary changes to optimize your Lambda function!
How to add Pyroscope’s Lambda extension to your Lambda Function
Pyroscope’s Lambda extension works with our various agents, and documentation on how to integrate with those can be found in the integrations section of our documentation. Once you’ve added the agent to your code, there are just two steps needed to get up and running with the profiling Lambda extension.
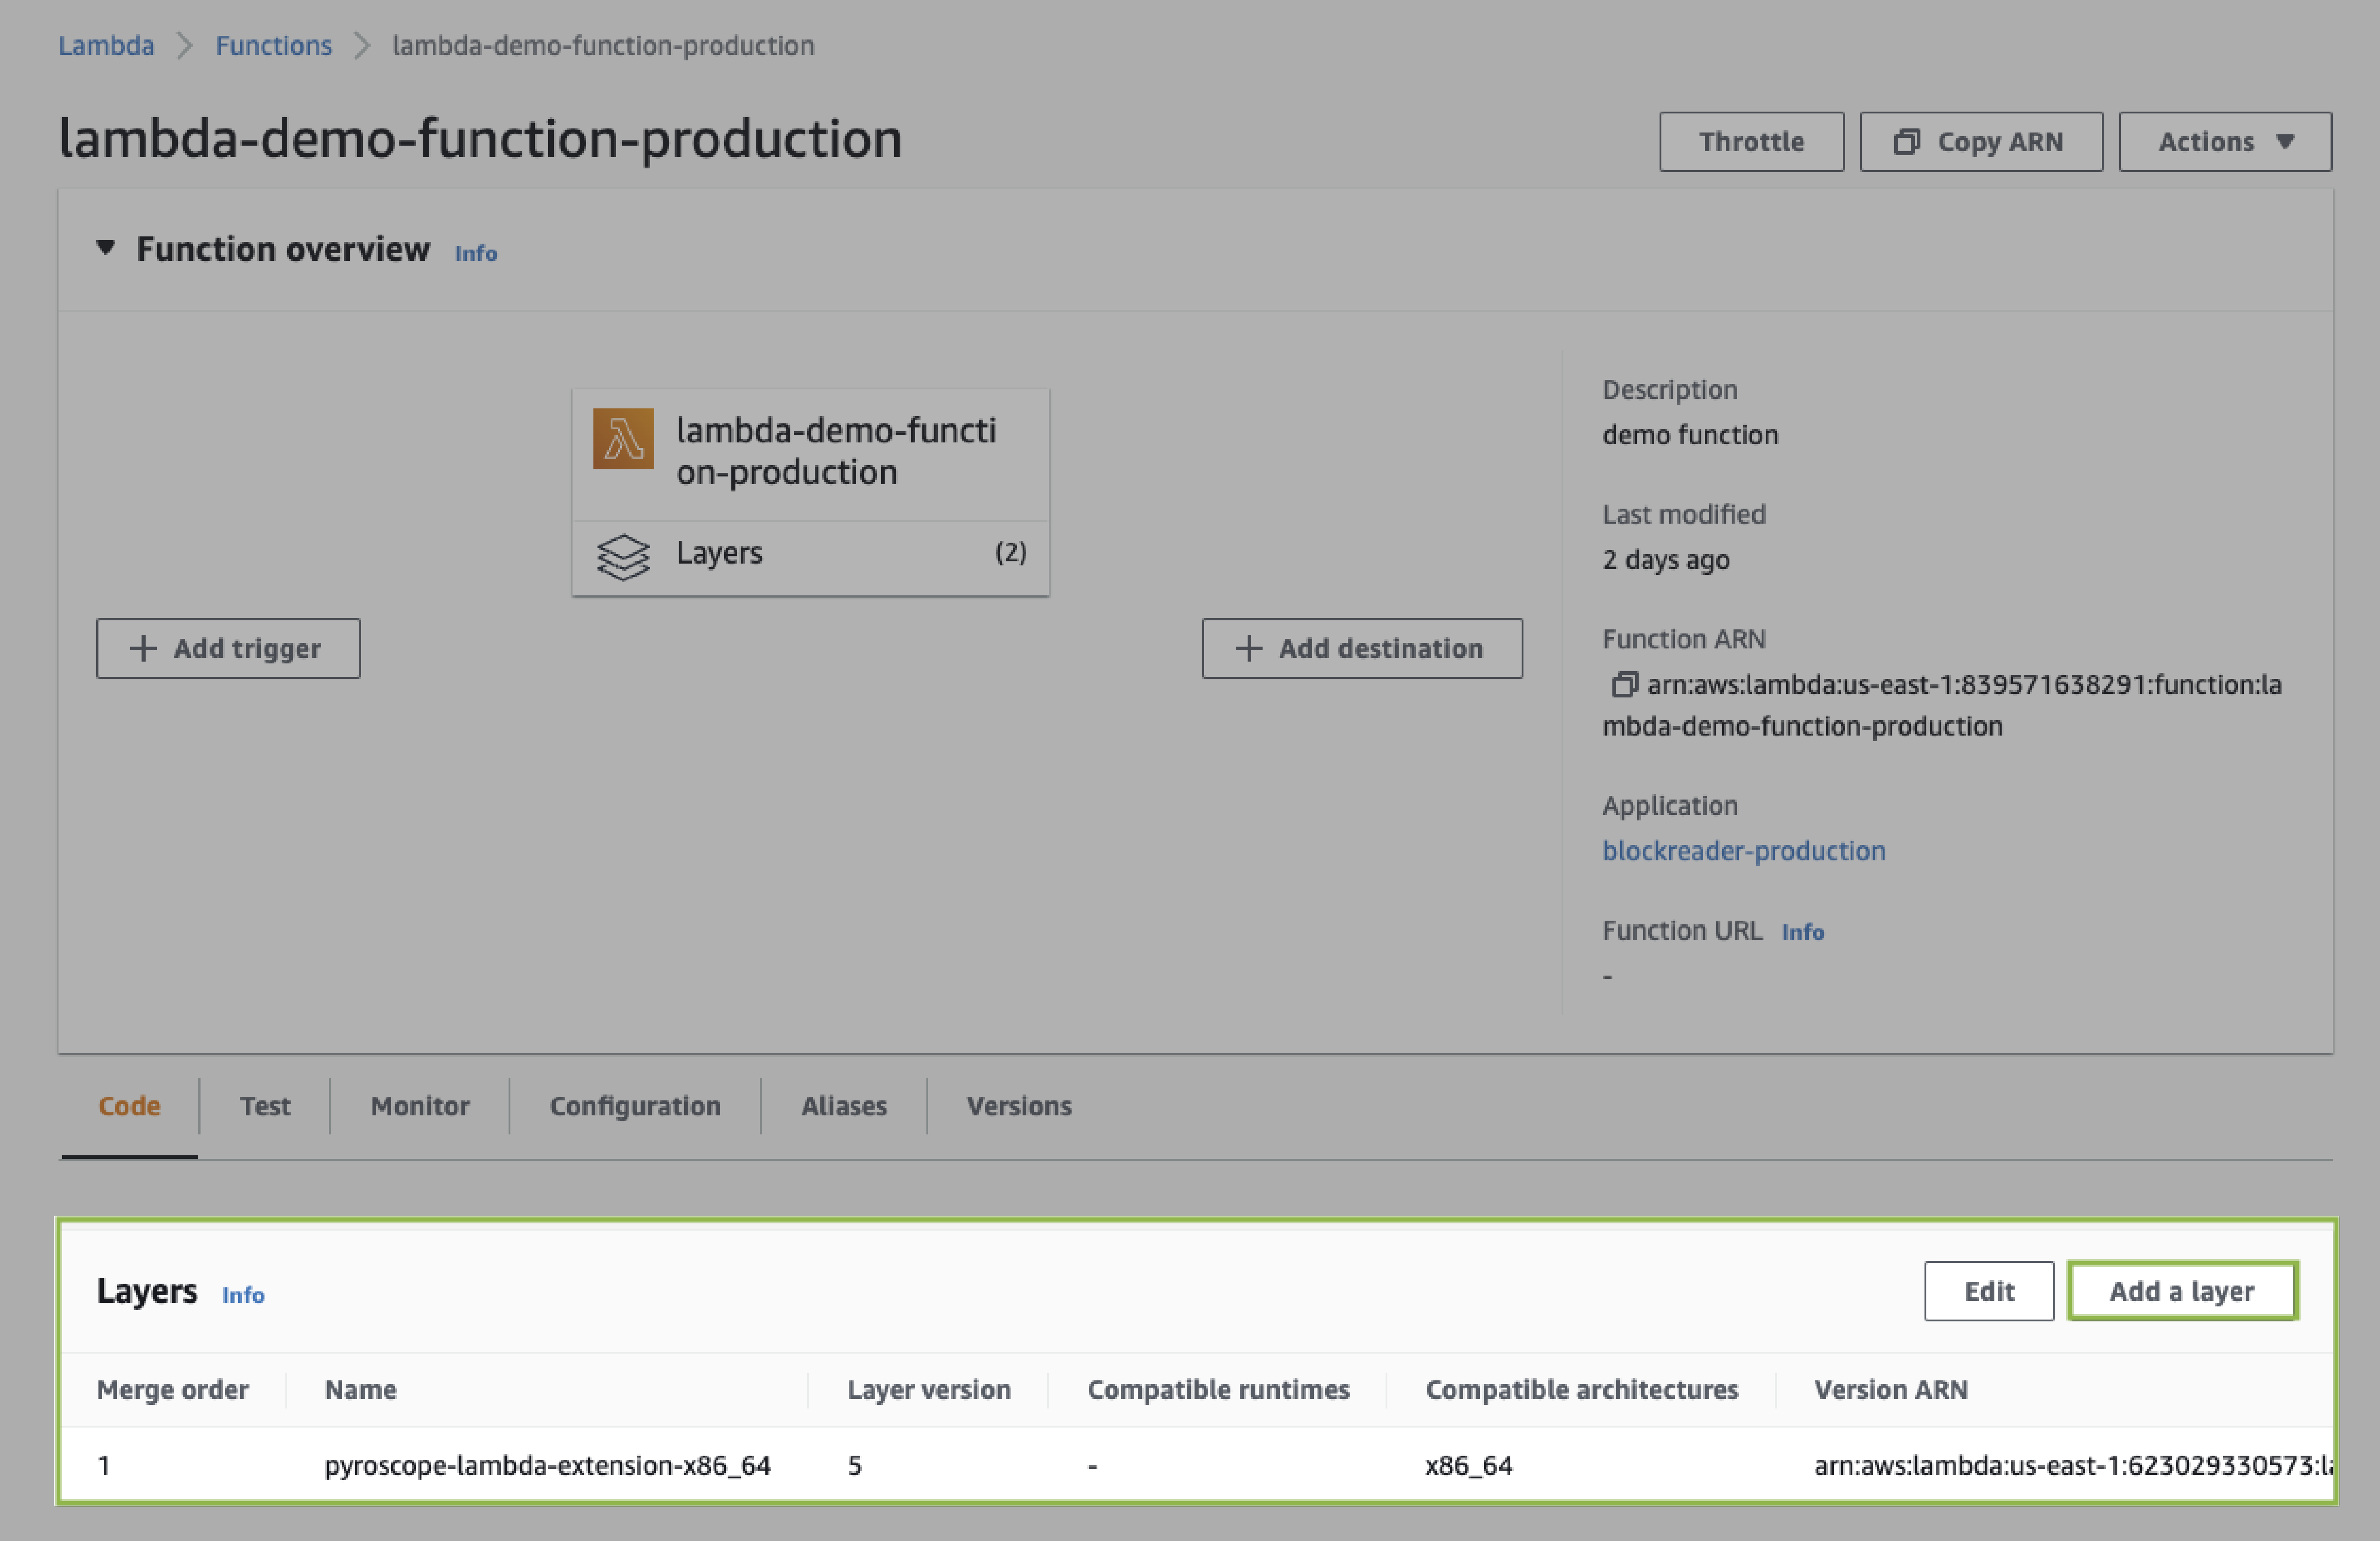
Step 1: Add a new layer in function settings
Add a new layer using the latest “layer name” from our releases page.
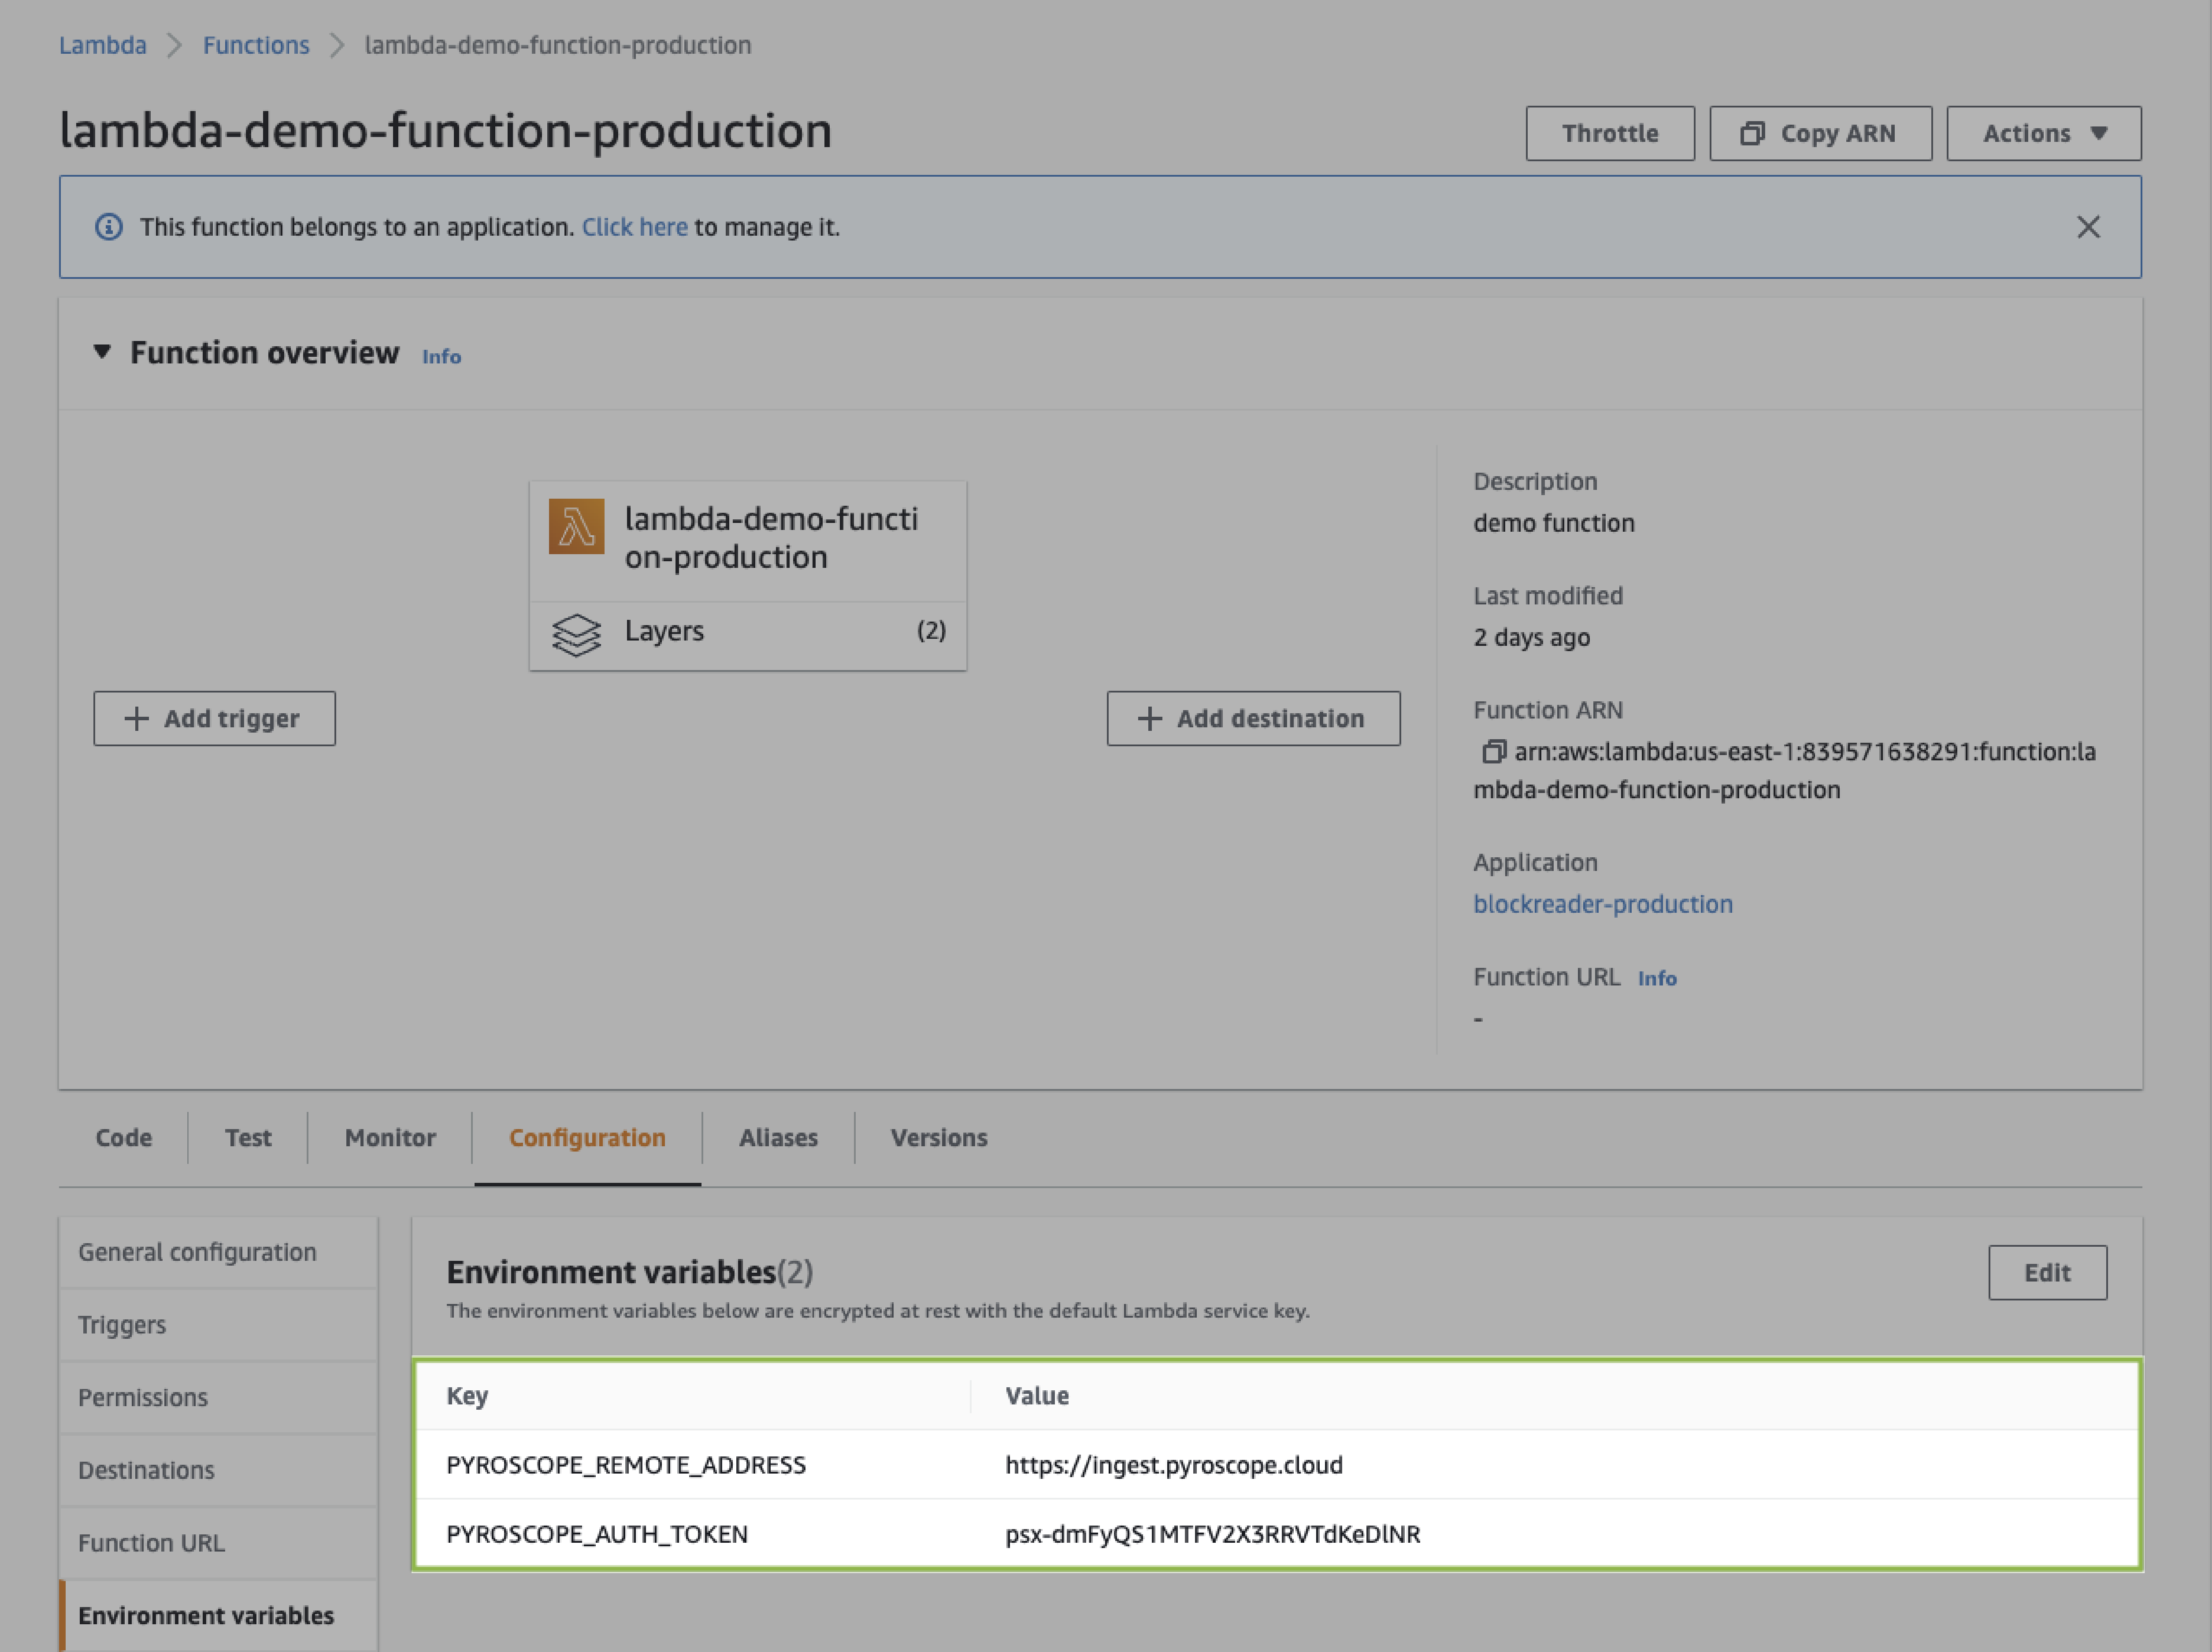
Step 2: Add environment variables to configure where to send the profiling data
You can send data to either either Pyroscope Cloud or any running Pyroscope server. This is configured via environment variables like this:
Lambda function profile
Here’s an interactive flame graph output of what you will end up with after you add the extension to your Lambda function:
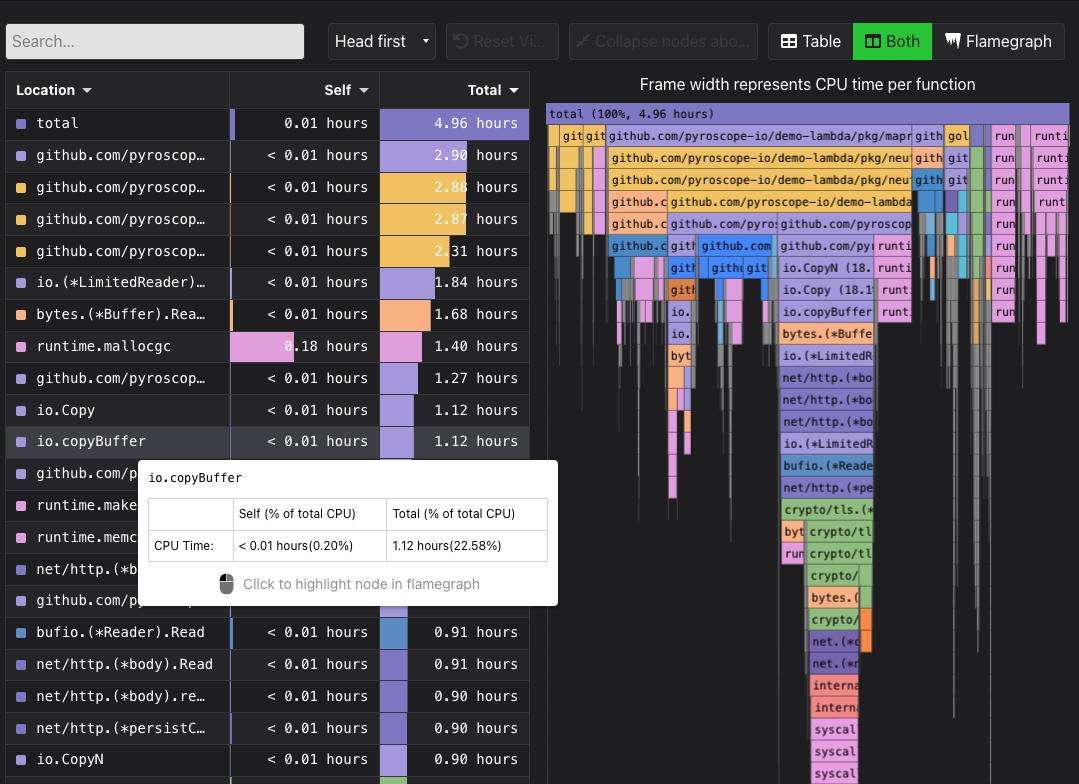
While this flame graph is exported for the purposes of this blog post, in the Pyroscope UI you have additional tools for analyzing profiles such as:
- Labels to view function CPU performance or memory over time using FlameQL
- Time controls to select and filter for particular time periods of interest
- Diff view to compare two profiles and see the differences between them
- And many more!


