How Denmark's Energinet uses Grafana Enterprise to monitor underwater energy cables — and do detective work
If an energy cable running through the waters surrounding Denmark gets damaged by a passing vessel, does it make a sound?
Yes . . . and it’s the ping of a Grafana alert at the offices of Energinet, an independent public enterprise owned by the Danish Ministry of Climate, Energy, and Utilities.
The company maintains high-voltage substations and cables that run through the North Sea, the Baltic Sea, and The Skagerrak, a strait between Denmark, Sweden, and Norway. Staying on top of data to ensure everything is functioning is critical for Energinet’s Asset Preparedness team, both in terms of being aware of issues and knowing their cause. After all, if any of the systems go down, the company’s revenue goes down with it. “We have a lot of interest in protecting our assets and providing evidence if someone is damaging cables,” says Henrik Roland Hansen, an electrical engineer in the Energinet’s Asset Preparedness department.
Hansen works with a team responsible for managing and correcting faults in the system and keeping outages as short as possible. Since early 2022, one monitoring tool has helped Energinet accomplish that: Grafana Enterprise.
Being able to set up alerts and unique monitoring solutions to fit the company’s specific needs “has brought us closer to our equipment,” he says.
Dashboards and detective work
In Energinet’s pre-Grafana days, Hansen’s team was using Excel to collect data, but their “dashboards” weren’t living documents, so implementing version changes and sharing them between team members was “impossible” and “a nightmare.”
Grafana, on the other hand, was easy for everyone to use, allowed them to do real-time streaming, and cut down on query times.
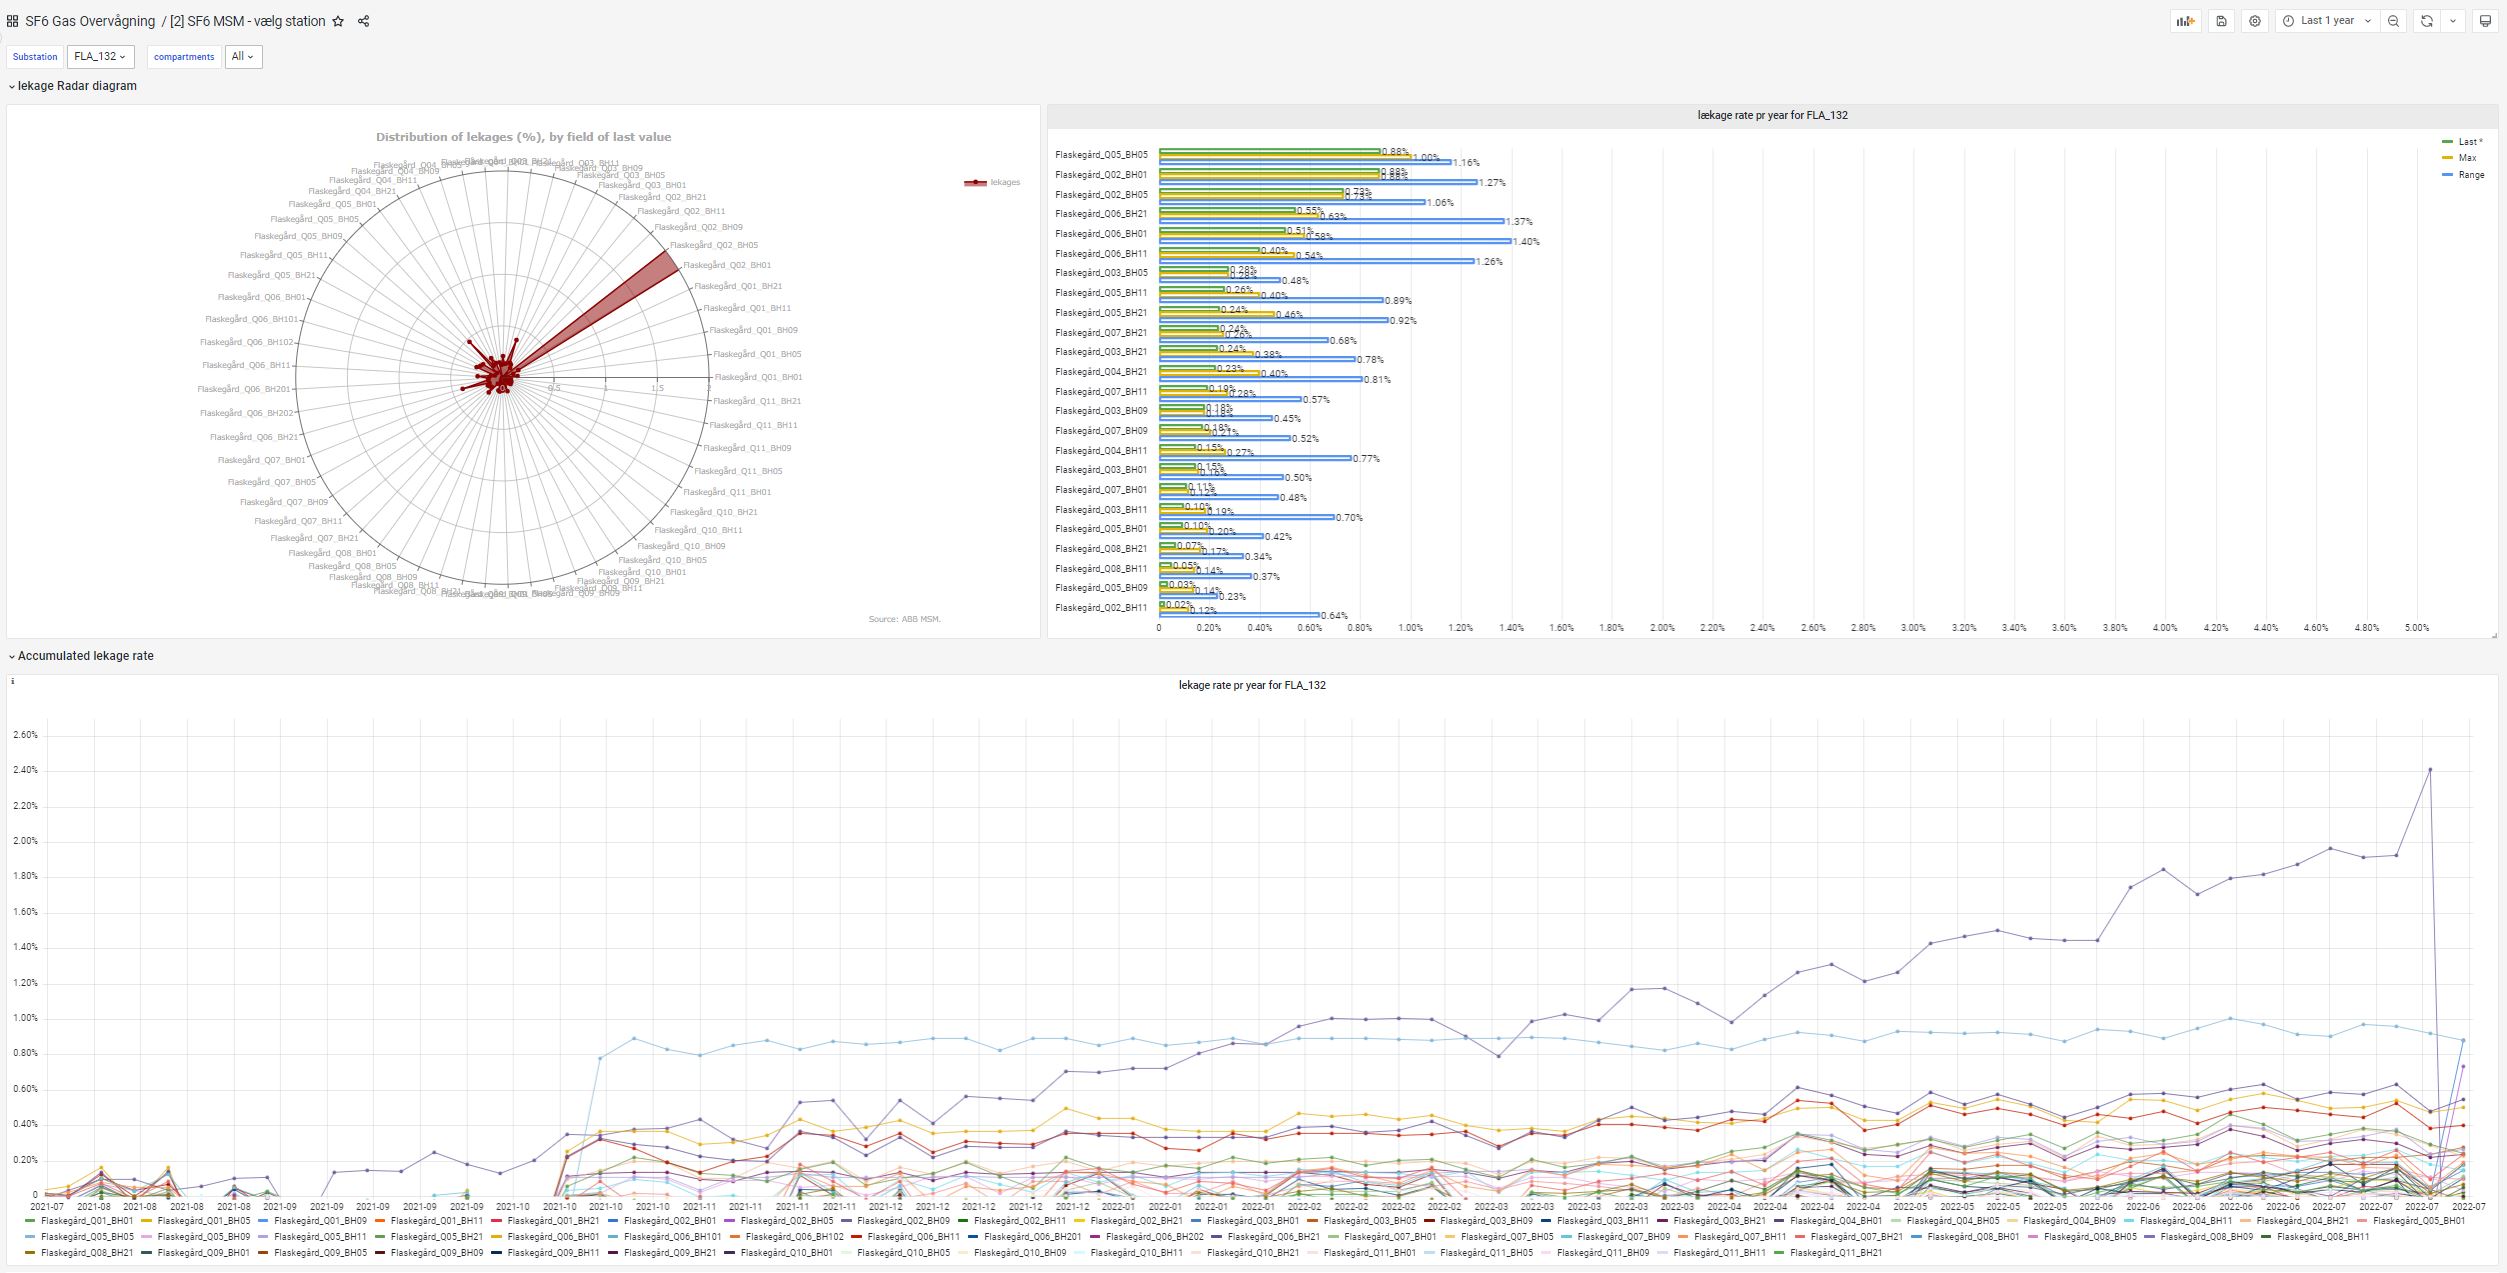
In Grafana dashboards, Energinet monitors data from about 10 to 15 different sources and receives alerts on special metrics like leakages on high voltage switchgear. “The power of this is that now all the data we need for operations, asset conditioning, and risk management is available in one centrally managed platform instead of hundreds,” Hansen says.
The alerting capabilities have made Hansen’s team better able to detect issues before they become major problems. “We’ve located leakages on oil cables because we’ve seen in Grafana that an oil tank level was dropping fast,” he recalls.

Grafana’s geomap panel is one of his favorite features on Energinet’s dashboard. “I’ve built it showing cables and protection zones,” he says. When Energinet is alerted to a cable fault, Hansen’s team begins their detective work. By analyzing the data they are monitoring with Grafana, they can determine if the fault was caused by something internal or if, perhaps, a vessel has hit a cable with its anchor or fishing tools.

The team can pinpoint vessels’ locations and cross-reference that with historical data about a location. Over the years, they have been able to catch several anchor draggers and fishing vessels that have hit and damaged the cables. The offenders have been found liable and had to pay for the damages, which could cost several millions.
Looking ahead
When Energinet implemented Grafana, there were about 30 people using it. Currently, the company has about 120 users divided across asset operations, system operation, and the automation department. Hansen expects that number will grow to 250 or 300.
The one thing he never wants to imagine is a future where he no longer has Grafana and it’s back to spreadsheets: “My colleagues and I would cry.”
To find out more about how Energinet is using Grafana Enterprise, read their full success story.


