Grafana 9.1 release: New Grafana panels, RBAC for plugins, public dashboards, and more!
Grafana 9.1 is here!
We’ve made a number of improvements to Grafana’s usability, data visualization, and security. For a full list of new features and capabilities, check out our What’s New in Grafana 9.1 documentation.
You can get started with Grafana in minutes with Grafana Cloud. We have a generous free forever tier as well as plans to suit every use case — sign up for free now.
Here are some of the highlights in Grafana 9.1:
Grafana dashboards and panels
Trace to metrics (beta)
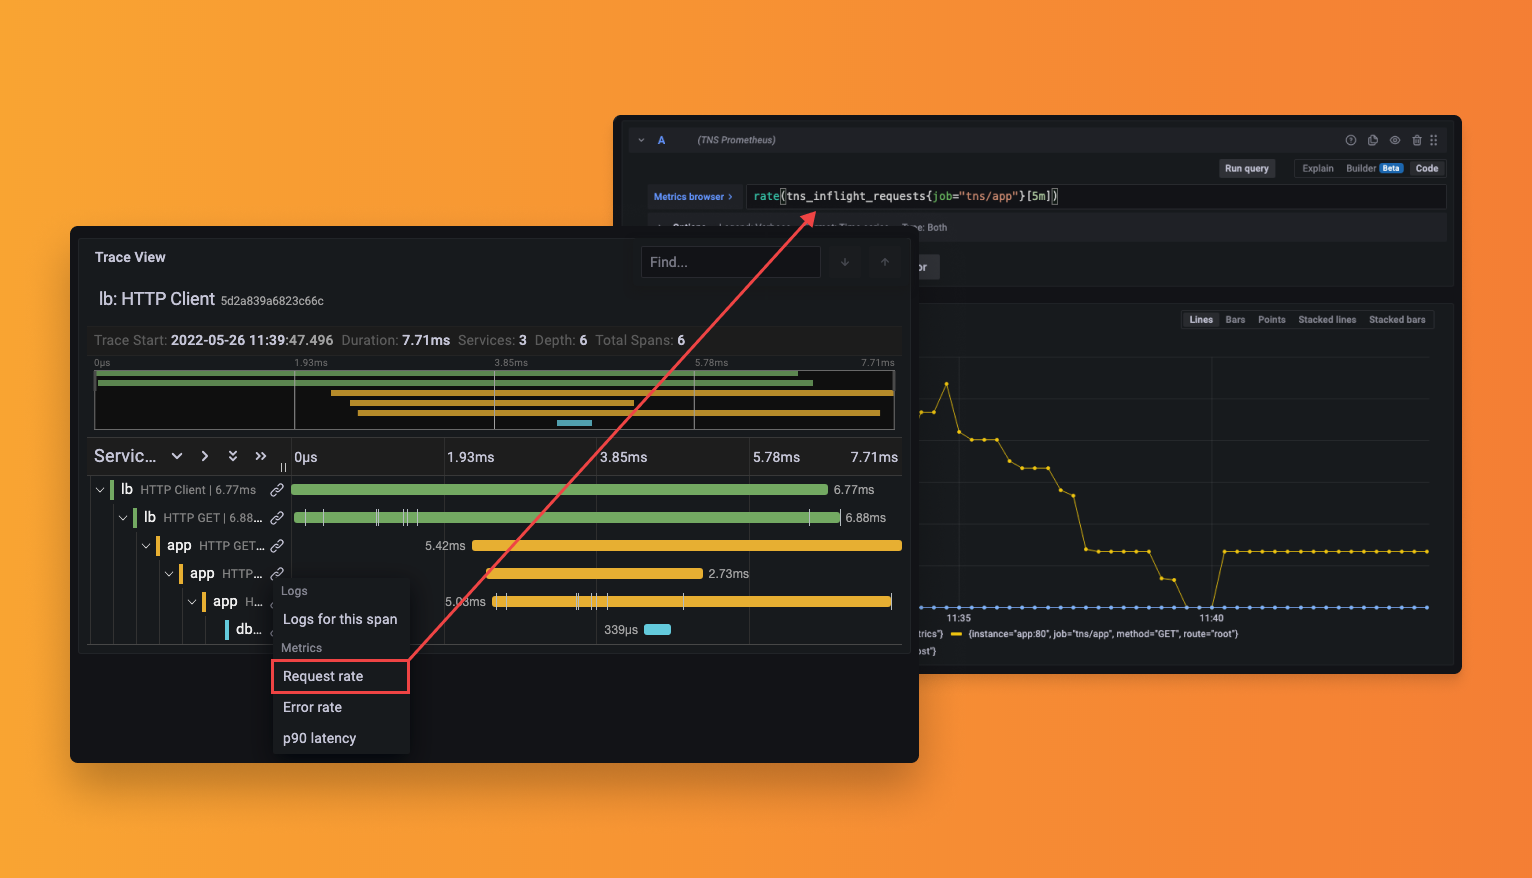
You can now link metrics queries to your traces. This feature can be accessed by enabling the traceToMetrics feature toggle. (Grafana Cloud users can access this feature by opening a support ticket in the Cloud Portal.)
In your tracing data source configuration, select a metrics data source, add tags, and write your queries. Each query will appear as a link on each span. The configured tag values will be dynamically added to your metrics queries. You can link to any metric you’d like, and metrics for span durations, counts, and errors filtered by service or span are a great starting point. You can learn more by reading our trace to metrics blog post.
The metrics generator in Grafana Tempo 1.4 pairs extremely well with trace to metrics. You can learn more in our metrics generator documentation.

Grafana Tempo APM table (beta)
You can now get APM data with Grafana. The data is shown in a table in the Grafana Tempo data source under the Service Graph tab. This feature can be accessed by enabling the tempoApmTable feature toggle. (Grafana Cloud users can access this feature by opening a support ticket in the Cloud Portal.) The span metrics are created using the Tempo metrics generator, so you will need to enable the metrics generator in Tempo to receive the data for the APM table.
The APM table displays RED metrics, so you can see your top five request, error, and duration span metrics in the table summary view. We also embedded several useful links into the table: There are links that can direct you from a RED metric to the related Prometheus data source where there will be a prepopulated query to further investigate the data. We also provide a link directly to Tempo search from the table, making it easier for you to investigate your APM metrics.
Learn more in our APM table documentation.

Public dashboards (alpha)
Grafana users can now share dashboards publicly. Public dashboards are available as an alpha feature that can be enabled with the publicDashboards feature toggle. (Grafana Cloud users can access this feature by opening a support ticket in the Cloud Portal.)
You can now generate a link for dashboards that you’d like to share publicly. Anyone with the link will be able to access that dashboard, and nothing else.
The public view of a dashboard has a few restrictions: Arbitrary queries cannot be run against your data sources through public dashboards. Public dashboards can only execute the queries stored on the original dashboard. The public dashboard is displayed in a read-only kiosk view. The time range is fixed to the dashboard default time range.
To learn more, check out our public dashboards documentation.
Grafana search and navigation
Panel title search and search improvements (beta)
We have made performance upgrades to searching by panel title, so if a panel’s title matches your search query, it will be displayed in the search results. This beta feature, which has undergone some improvements since it was first introduced in Grafana 9.0, can be accessed by enabling the panelTitleSearch feature toggle. Additionally, it will be rolled out to Grafana Cloud users over the next few weeks.
Panel title search uses our updated dashboard search approach. Previously, Grafana used SQL database queries to find dashboards by title. With the feature toggle enabled, Grafana can build an in-memory index of all dashboards, making it possible to search the contents of a dashboard, such as panels. Learn more about enhanced search capabilities in the Grafana documentation.

Starred dashboards in the navigation bar
As part of the improvements to Grafana’s navigation, all users can now save and access their favorite visualizations — a feature that was introduced in beta in Grafana 9.0 and is now generally available in Grafana 9.1. You can directly access your starred dashboards from the vertical navigation bar.

Grafana authentication and security
RBAC for app plugins, usage insights, and query caching
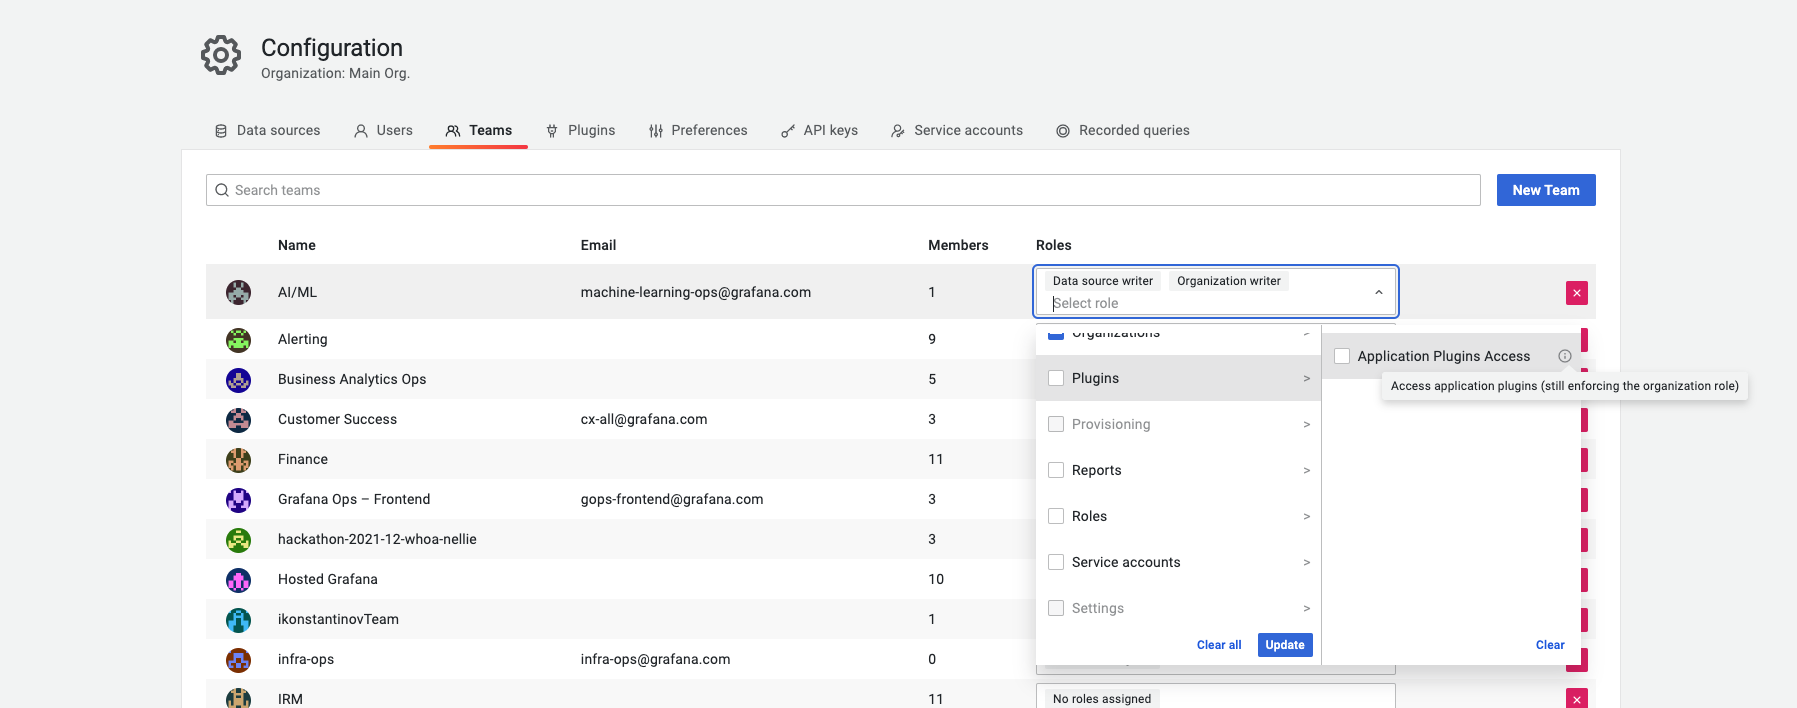
Improvements to role-based access control (RBAC) in Grafana continue! We are now rolling out RBAC across all of Grafana’s features in Grafana Enterprise and the Grafana Cloud Advanced tier.
In Grafana 9.1, you can determine which users, teams, and roles have the ability to access app plugins, integrations, or solutions. For example, Grafana Cloud Advanced users can determine who can access Grafana OnCall and Synthetic Monitoring.
Note: While you can restrict access to app plugins, you can’t assign view or edit roles yet (for example, you cannot grant a user view-only access to Grafana OnCall). That functionality is planned for a future release.
For dashboard and data source usage insights as well as data source query caching configuration, users can control who has view, edit, or administrator access. For more details, check out the RBAC documentation.

JWT URL embedding
You can now easily embed Grafana in other applications by adding a JWT token directly in Grafana’s URL. For example, the link will look like this: https://example.grafana.net/dashboard/uuid?auth_token=<jwt_token>
When the JWT token is passed through the request URL to Grafana, Grafana will validate and authenticate the token linked to a specific user, allowing access to dashboards which that specific user can view. To see JWT URL embedding in action, you can check out this sample project.

Learn more about Grafana 9.1
For a quick overview of more new features, have a look at What’s new in Grafana 9.1. For a complete list of new features, changes, and bug fixes, check out the Grafana documentation and the Grafana 9.1 release notes.
You can also join us on our Grafana Labs community forums to discuss any of the new features, workflows, or how to incorporate these changes into your dashboards, queries, and visualizations.
You can also join us on our community forums to discuss any of the new features, workflows, or how to incorporate these changes into your dashboards, queries, and visualizations.
Upgrade to Grafana 9.1
Download Grafana 9.1 today or try Grafana 9.1 on Grafana Cloud, which has a generous free forever tier and plans for every use case. Sign up for free today!
Refer to our Upgrading Grafana documentation for more information about upgrading your Grafana installation.
Thanks to the Grafana community!
A big thanks to all the Grafana users who contributed by submitting PRs, bug reports, and feedback!
Grafana Cloud is the easiest way to get started with metrics, logs, traces, and dashboards. We have a generous free forever tier and plans for every use case. Sign up for free now!


