The updated Docker integration in Grafana Cloud now supports logs and metrics
More than 17 million developers use Docker to build, ship, and run applications separate from their infrastructure in order to deliver software faster and more efficiently. With the rising popularity of containerized applications, however, it has become increasingly more complex and difficult to observe and monitor applications running across multiple containers.
That’s why we are excited to introduce our new and improved Docker integration, which is available now to all Grafana Cloud users, including those in our generous free forever tier. The upgraded Docker integration comes packaged with prebuilt dashboards that allow you to monitor your Docker logs and metrics, which are collected by the Grafana Agent. While the dashboards are preconfigured for instant implementation, they can also be edited and modified to reflect different environments.
Let’s walk through how to easily set up a Grafana Cloud account and start monitoring your Docker instances!
How to configure the Docker integration in Grafana Cloud
You can configure the Docker integration in Grafana Cloud in three easy steps:
- A Grafana Cloud account is required to use the Docker integration. If you don’t already have a Grafana Cloud account, you can sign up for a free account today.
- In your Grafana instance, click Integrations and Connections (lightning bolt icon), then click on the Docker tile to install the integration.
- Follow the steps to set up and install the Grafana Agent to start sending metrics and logs to your Grafana Cloud instance.
Start monitoring Docker containers
After the Docker integration is installed, you will see two prebuilt dashboards designed to monitor Docker metrics and logs.
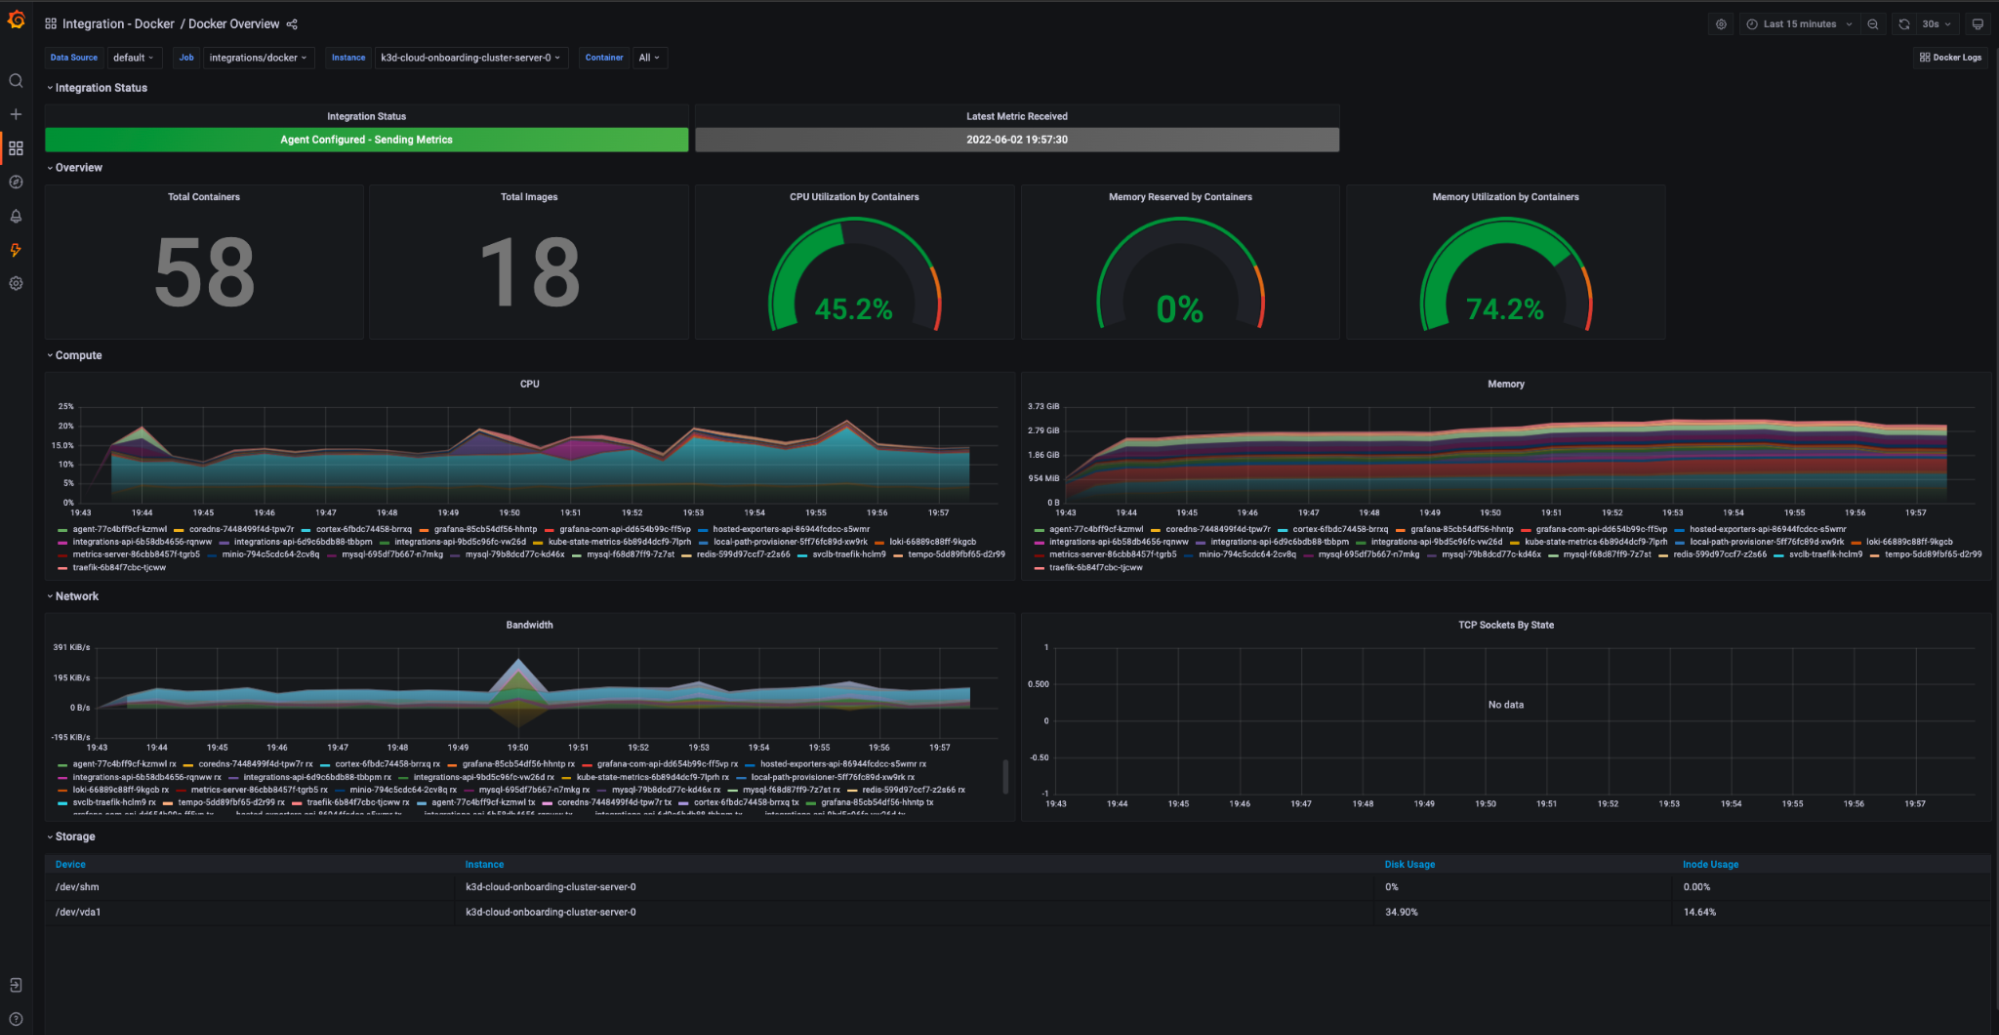
Docker overview dashboard
The Docker overview dashboard provides you with overall statistics about your Docker instances. The integration uses the embedded cAdvisor inside the Grafana Agent to expose container utilization metrics.
From the drop-downs, you can filter the Docker metrics by:
- Job (usually integrations/docker)
- Instance (the hostname of the docker host)
- Container (names of individual containers)
Or you can see the aggregated statistics by selecting all options from the drop-down menu of template variables.

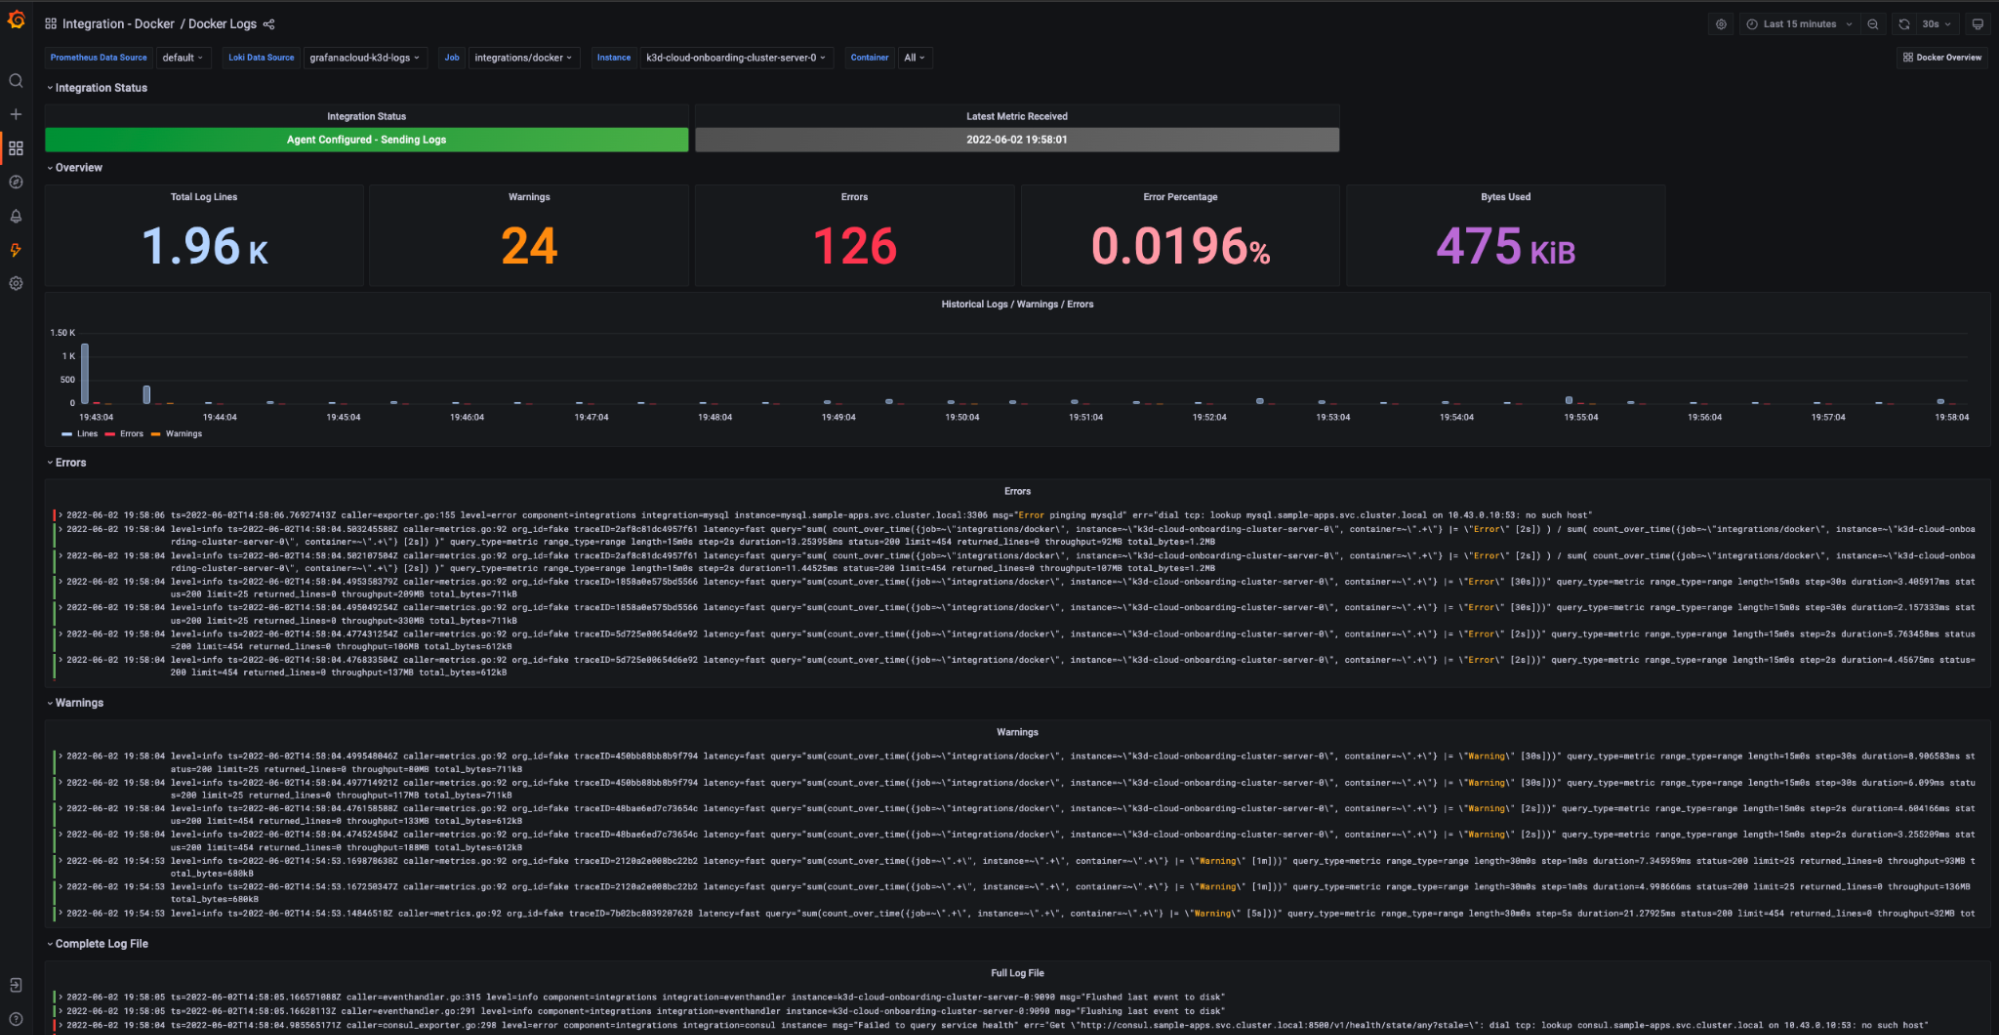
Docker logs dashboard
With the Docker integration in Grafana Cloud, logs are collected using the Grafana Agent docker service discovery feature based on Promtail.
The prebuilt Docker logs dashboard then provides a detailed view of metrics and information about Docker log files, including a general overview of errors, warnings, and log file sizes. In this dashboard, you can also drill down on errors, warnings, and full log files in separate panels.
Using the shortcut present on the top right corner of both dashboards, you can navigate between the two dashboards easily, with all filters applied automatically, making it easy to troubleshoot issues in your Docker containers using both logs and metrics.

Learn more about the Grafana Cloud Docker integration
The Grafana Cloud Docker integration provides an easy way to get started with monitoring your Docker instances. For more information, check out the Docker integration documentation.
Give our Docker integration a try, and let us know what you think! You can reach out to the team in the #Integrations channel of the Grafana Labs Community Slack.
Grafana Cloud is the easiest way to get started with metrics, logs, traces, and dashboards. We have a generous forever-free tier and plans for every use case. Sign up for free now!


