How to access and query REST APIs with the Sqlyze plugin in Grafana
A few months ago, I wrote about using the Sqlyze data source plugin in Grafana to query COVID-19 wastewater surveillance data on Databricks.
Did you know that with the Sqlyze Enterprise plugin, you can also access REST APIs (web services), treat them as database tables, and query them using SQL? You can use any ODBC driver you like, and it’s not limited to relational databases, either. You can query NoSQL and document databases, too.
In this post, I’m going to walk through how to use the CData api driver to connect to some REST APIs from the productivity/project management tool ClickUp.
(Another option for a project management tool that would work in this setup is the Enterprise plugin for Jira, a popular tool for planning, tracking, and releasing software, which is available to users with a Grafana Cloud account or with a Grafana Enterprise license. For more information and to get started, check out the Jira plugin page or contact our team.)
Let’s set it up!
Step 1: Install the driver
ODBC drivers are provided with an installer for your OS/Arch of choice. In this example, I’ve obtained the API driver from CData for MacOS and installed it.
Step 2: Download the profile
CData provides pre-built “profiles” for some data sources. For those sources without a pre-built profile, you can create your own profile. For this example, we’ll use the ClickUp profile.
Step 3: Obtain your API token from ClickUp
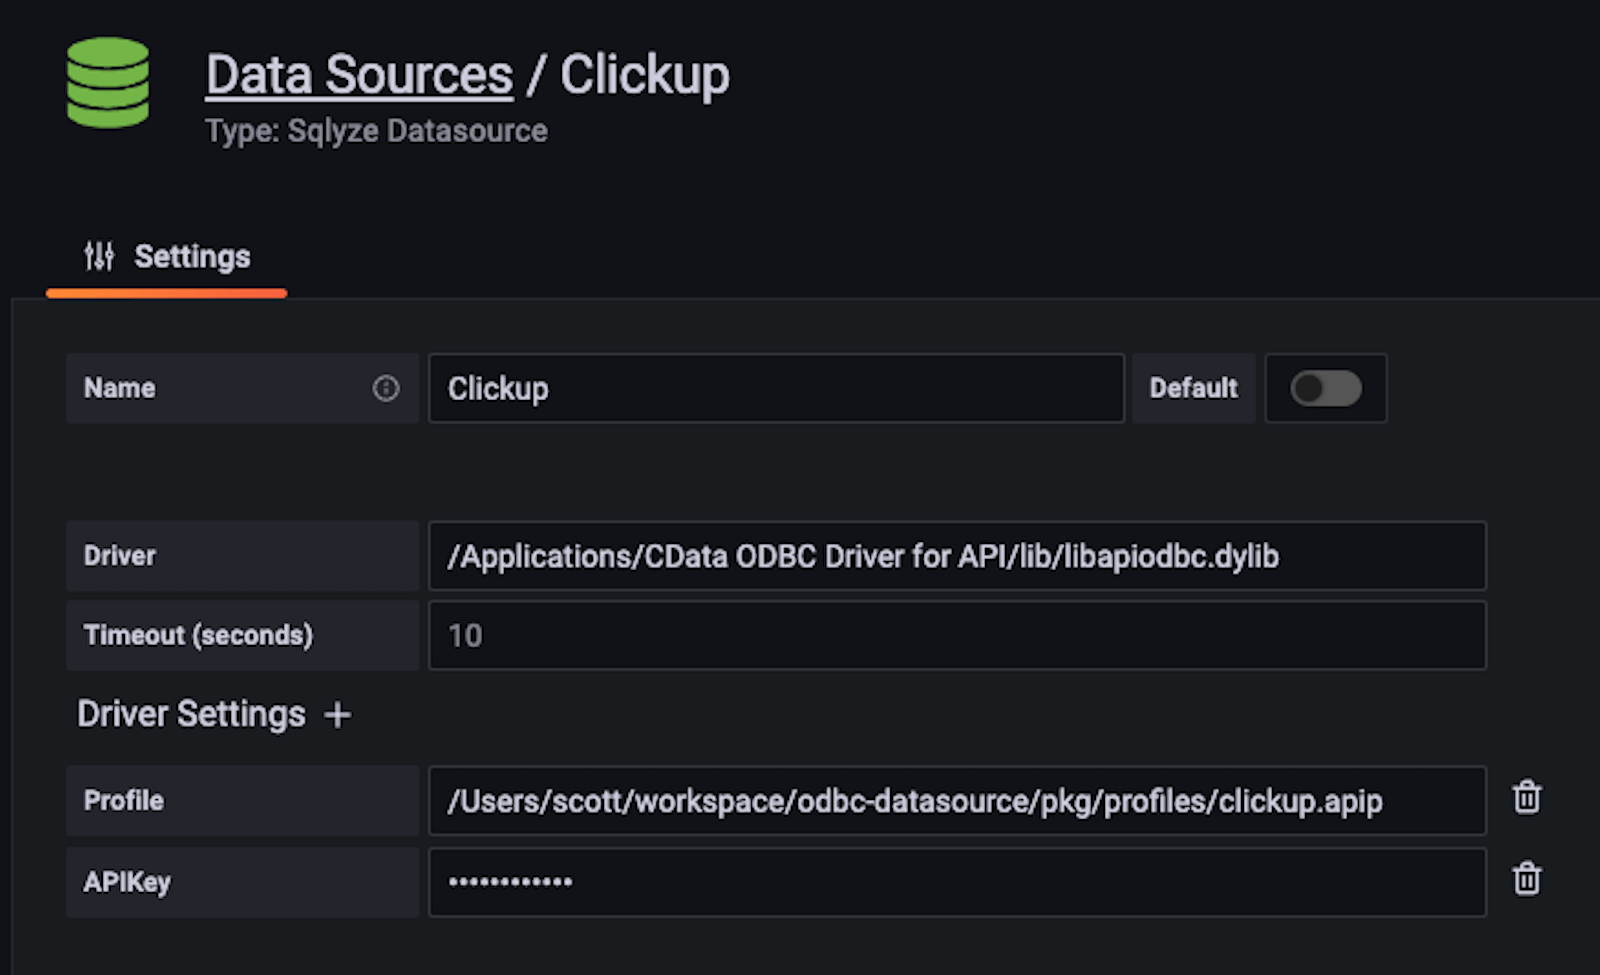
Step 4: Add a new Sqlyze data source in Grafana and set the Driver path, profile path, and API Key

Step 5: Create a dashboard and run some queries!
In ClickUp, the data is hierarchical. To create a dashboard that shows our ClickUp tasks, the hierarchy is: Team > Space > Folder > List > Tasks.
You can add template variables that allow you to choose the Team, Space, etc. that you want to view tasks for.
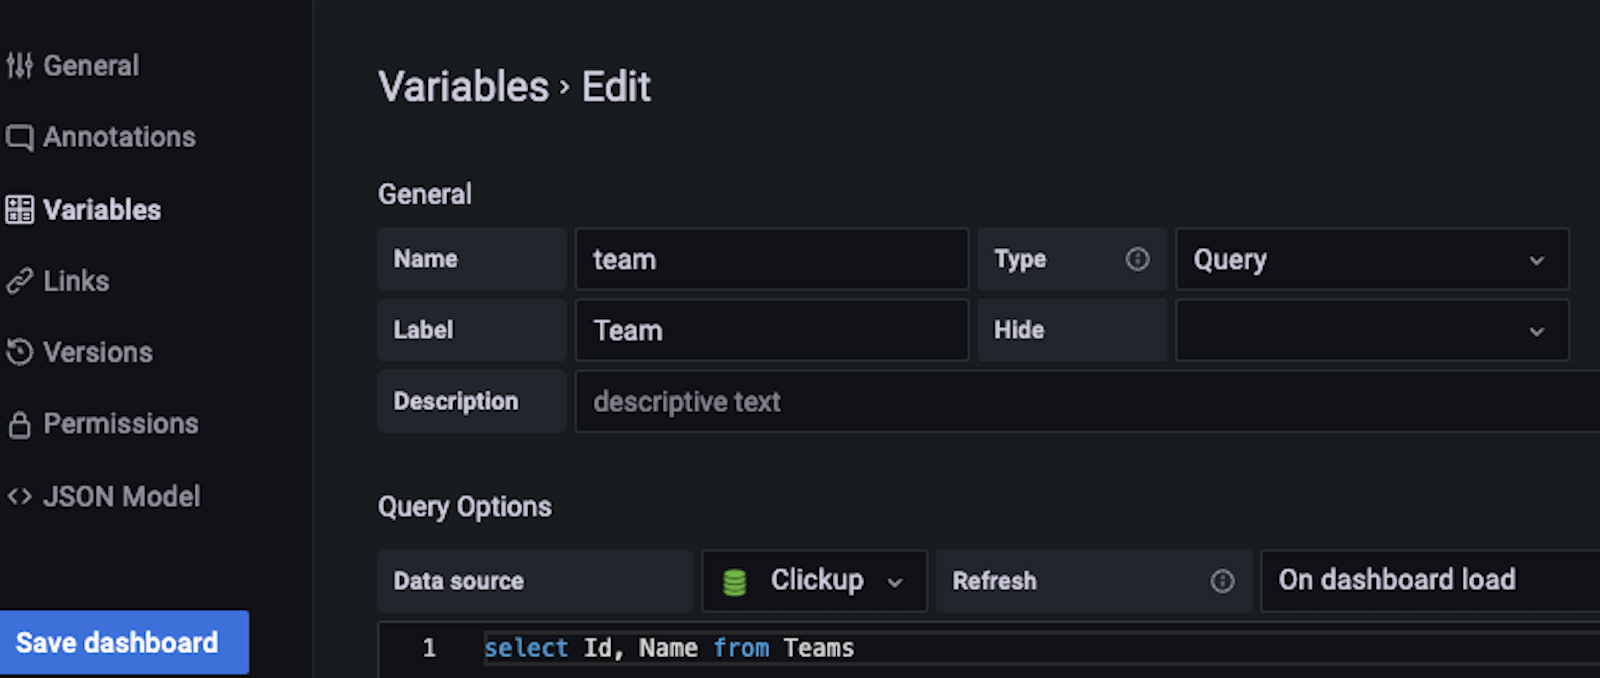
At the bottom of the image below, you can see where to add a Query type template variable to choose Teams. Then, you can query from the Teams REST API as you would with an SQL table. (To create template variables for Space, Folder and List, follow the same approach.)

Returning to our dashboard, we can select the Team, Space, Folder, and List that we want to drill down into and see Tasks.

Now let’s add a table panel with the ClickUp datasource query Tasks. For the Tasks REST API, a ListID is required, so in the query we can inject our “list” variable.
select Name, CreatorEmail, DateCreated, DueDate, Priority
from Tasks t where t.ListId = $list
After running the query, we’re able to see a list of Tasks in the Table panel, like this:

We can also add some stat panels to show the count of all tasks, tasks that are past due, and tasks that are high priority.

And that’s it!
In a matter of minutes, we’ve queried REST APIs using SQL syntax and created an integration from ClickUp to Grafana using the Sqlyze Enterprise plugin.
Remember, with the Sqlyze Enterprise plugin you can query Sql, NoSQL, documents, rest APIs, and more. That’s all for now, but there will be more examples to come! Thanks for reading.
The Sqlyze Enterprise plugin is available for users with a Grafana Enterprise license. For more information and to get started, check out the Sqlyze plugin page or contact our team.


