Monitoring a hard water softener at home with Grafana Cloud
We all know that Grafana Cloud has many cool uses: monitoring a Tesla, keeping tabs on an avocado plant, and more. But did you know it can also help prevent dry skin and pipe damage?
Let me explain . . .
After moving into a new house recently, we discovered that our area has extremely hard water. That’s a problem because it not only can cause your skin to be dry, but over time, it also leads to limescale buildup in appliances (reducing their effectiveness and lifespan) and causes blockages in pipes. As a remedy, you can install a water softener — a tank with salt blocks — to reduce the mineral buildup and avoid costly repairs down the line. A softener removes the magnesium and calcium present in your water supply through a process of ion exchange, which turns it from hard water to non-damaging softened water.
The problem is, the salt blocks usually have to be replaced every four weeks or so, which means they need to be constantly monitored. I tend to forget to replenish the blocks, leaving us with hard water again for a week or two until I remember. (One clue: I’ll feel the effect coming back on my skin.)
There are water softeners on the market that have built-in sensors, but they cost significantly more than the base model without sensors. One of my hobbies is electronics — and I’m a senior solutions engineer here at Grafana Labs — which gave me an idea. In the past, many of my electronics projects have involved the famous ESP32 microcontroller (it has integrated Wi-Fi and dual-mode Bluetooth, and runs for very long periods on battery power) and various sensors that you can plug into the general-purpose input/output (GPIO) pins. I thought, Why not use one to build a little sensor that can detect the level of the salt block that is left in the water softener, and let me know when it is time to top it up? I could use Grafana Cloud to ingest the data, update it every two hours, and display it as a graph over time. On top of that, I could use Grafana’s ability to monitor the level of the salt being measured, so when it reached a certain threshold, it would send an alert that it is time to add more salt.
Here’s how I made all of that happen.
Getting started
This is a picture of what my basic water softener looked like. The red lines indicate it’s time for a new salt block.

On the electronics side, there were a couple of issues I needed to address: The ESP32 microcontroller isn’t capable of running a fully-fledged OS and Grafana agent. I also needed to be mindful of preserving my battery life, which meant I didn’t need the controller to send updates every 60 seconds. The level of salt remaining does not change that quickly (it’s about 30 cm over a period of a month), so a measurement once a day could even suffice. I decided to update once every two hours as part of my testing.
For the best battery life, you want to write your code in a tight loop like this that keeps the device sleeping for as long as possible:
- Wake up from low power mode, measure the level of salt
- Send the metric to Grafana Cloud using the Influx line protocol
- Sleep again for the next two hours, repeat the process
Hardware and design
Building the device was pretty simple. I used:
- 1 x ESP32 microcontroller
- 2 x 3.7V 18650 Li-ion Rechargeable Battery
- 1 x Waterproof Ultrasonic Module JSN-SR04T distance sensor
- 1 x 3D printed case to hold it all together
Total cost: ~ $15
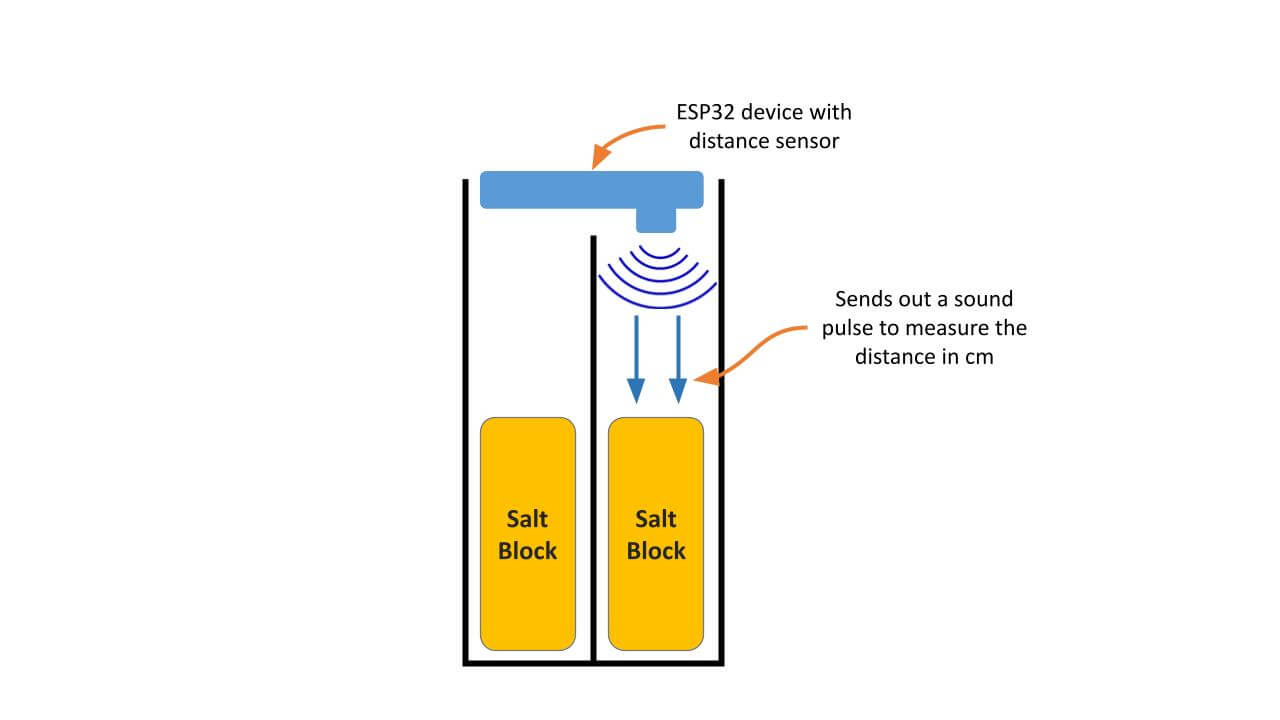
You can see the design here. When the distance measured reaches 30 cm, it’s time to top up with a new salt block.

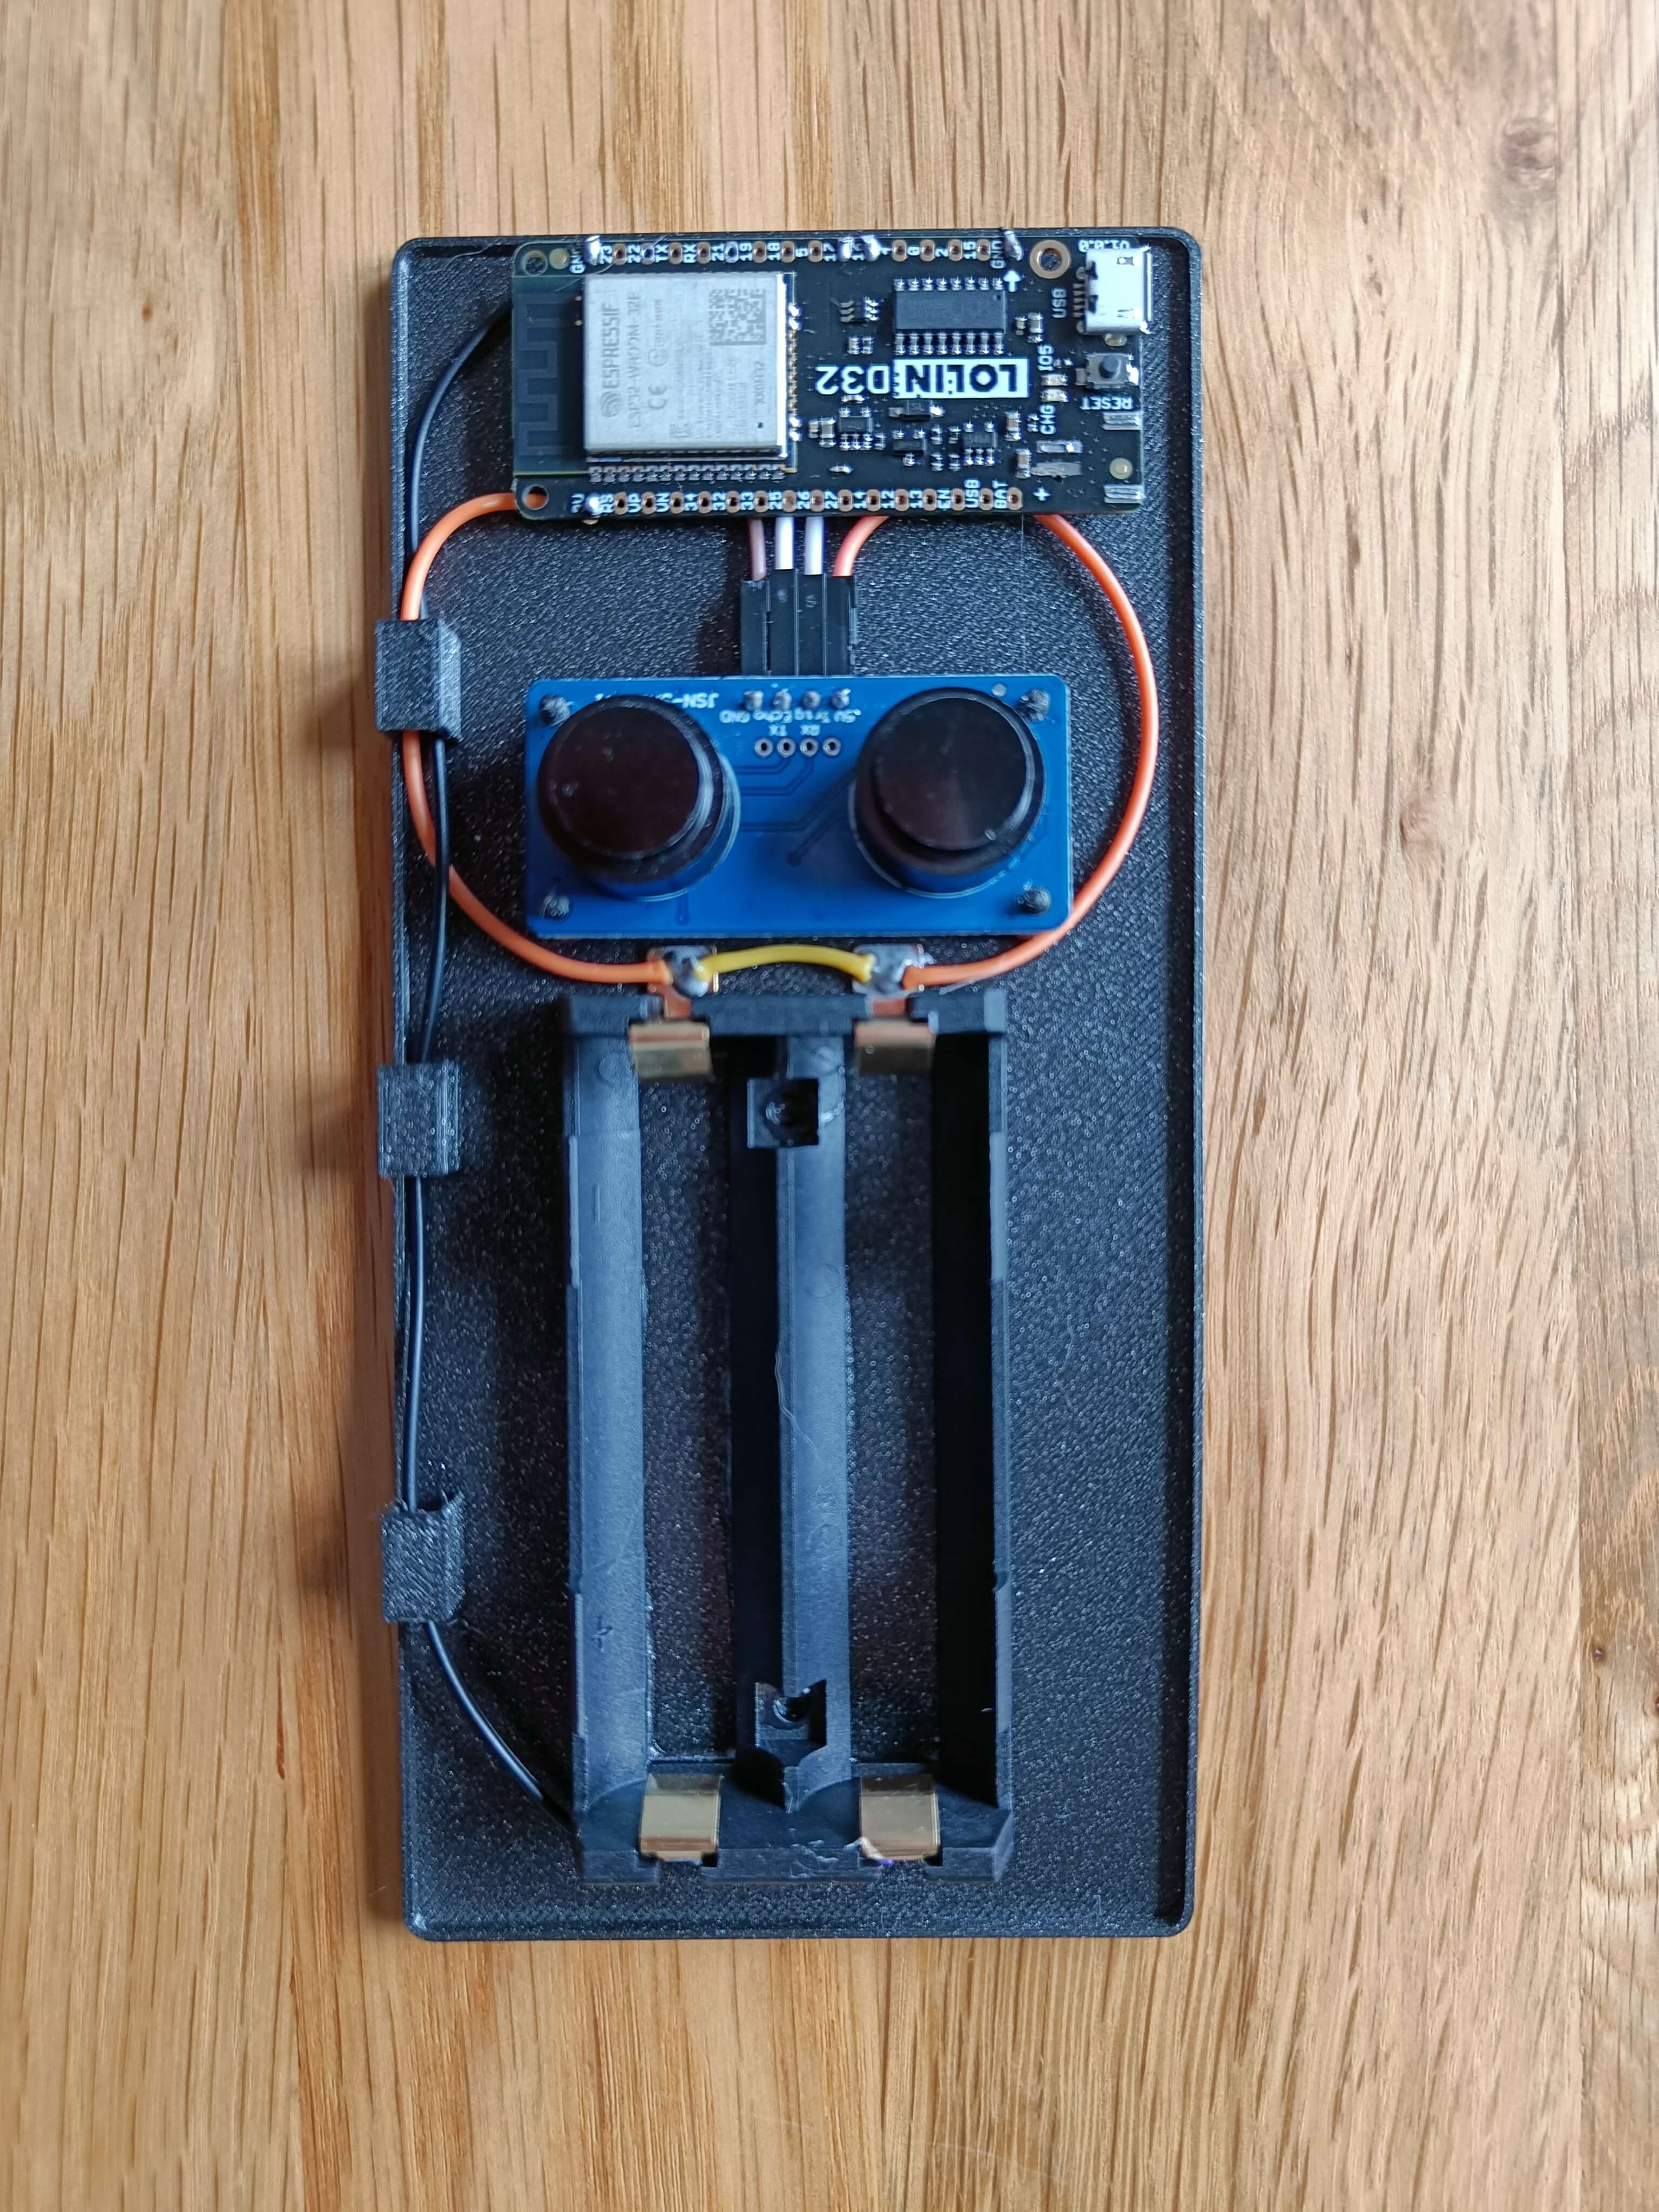
Below, you can see my assembled circuits, sensor, battery holder, and wires.

And here is the assembled device glued to the water softener lid. (It gets turned over when it’s installed.)

Over a period of a month, the sensor collects the data at a constant two-hour interval rate, as demonstrated in the graph below. The graph slowly trends upwards until it reaches a distance of about 30 cm (orange threshold line), at which point Grafana will start to send out alert emails. At 35 cm (red threshold line) the salt will be completely gone.

Ingesting the metrics
Grafana Cloud Metrics supports various protocols for ingesting metrics:
When working with RESTful APIs, a protocol that is text-friendly and can be submitted with a POST request is simple to develop in any language. In this project, I decided to use the Influx line protocol for that reason, since it is really easy to construct in code.
The basic Influx line protocol can be explained like this:
watersoftner,deviceid=water-softner ping_distance=30 1653427945200300600

  |          -------- --------------- —---------------   |
  |             |                            |           |
  |             |                            |           |
+-----------+--------+------------------+---------+--+---------+
|measurement|,tag_set|                  |field_set|  |timestamp|
+-----------+--------+------------------+---------+--+---------+
In code, this can be expressed as:
text = "watersoftner,deviceid=water-softner ping_distance=" + String(measured_cm);
httpResponseCode = http_grafana.POST(text);
(Source code and 3D design can be found via the Github repository here.)
I used this metric to query in Grafana, using the PromQL language:

Here’s how I configured it to send an alert when the value of the measurement is more than 30 cm:

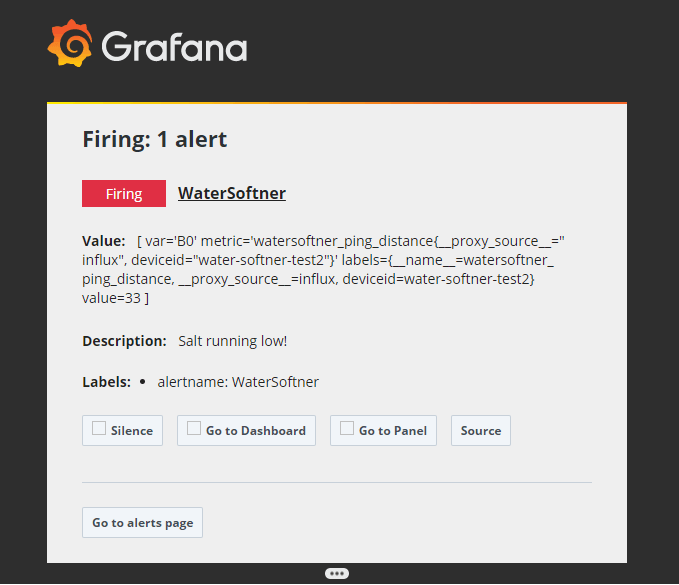
This is what appears in my inbox when the alert is triggered:

Success!
Thanks to Grafana Cloud, I will never forget to replace my salt in time again. My family’s skin, our pipes, and our appliances are very thankful, and now I don’t have to worry about spending money on repairing hard water damage in the future. I really enjoyed researching and building this project. It showed me the value of the ESP32 community and how easy it was to integrate with Grafana Cloud. I’m already thinking of my next project: tracking the number of times our dogs go in and out of the dog flap throughout the day.
Grafana Cloud is the easiest way to get started with metrics, logs, traces, and dashboards. We have a generous free forever tier and plans for every use case. Sign up for free now!


