GrafanaCONline 2022: A guide to all the big announcements from Grafana Labs
We have lift off! GrafanaCONline 2022 officially launched today with the opening keynote featuring Grafana Labs CEO and Co-founder Raj Dutt, Chief Grafana Officer and Co-founder Torkel Ödegaard, and Senior Engineering Manager Myrle Krantz. Along with previewing the much-anticipated release of Grafana 9.0, we revealed some exciting news for our open source community.

Below is a summary of all the major headlines that mark one small step for Grafana, one giant leap for the Grafana community.
It’s not too late to register for GrafanaCONline 2022 (it’s free!) and catch any of the 30+ sessions featuring more than 50 speakers from Grafana’s global community. Throughout the week, we’ll continue to highlight features in Grafana Mimir for metrics, Grafana Tempo for traces, Grafana Loki for logs, Grafana k6 for performance testing, and more. We’ll also give users a deep dive into our products with live demos and share tips and best practices from experts representing companies such as Optum, Dish Network, Cisco, and Apeel Sciences. Join us all week and find us on the Grafana Labs Community Slack in the #grafanacon channel.
Grafana 9.0 is here!
The wait is over. Grafana 9.0 made its debut today, with its focus on improving user experience to make observability and data visualization easier and more accessible for everyone. With the new Prometheus and Grafana Loki visual query builders and the added panel and dashboard search functionality, Grafana 9.0 introduces newer workflows to make it easier and more intuitive to discover and investigate your data.
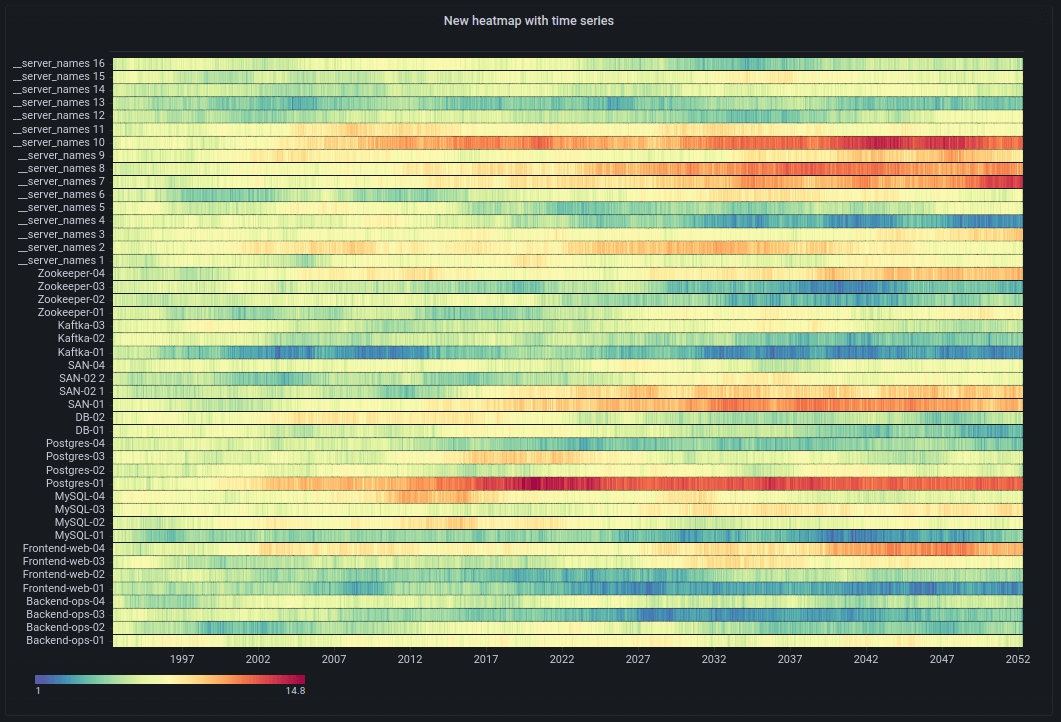
Naturally, we’ve also added a dynamic panel option to Grafana’s ever-expanding library. The new heatmap panel (below) gives you access to a fast and powerful histogram visualization with high resolution and granular control over color spectrums.

Grafana 9.0 is now available to both open source and Grafana Enterprise users, and is being rolled out to Grafana Cloud users incrementally. (The majority of instances have already been upgraded!) New Grafana Cloud users will immediately get the Grafana 9.0 experience.
To see a demo of all the latest and greatest in Grafana 9, don’t miss the “Deep dive into Grafana 9” GrafanaCONline session on Wednesday, June 15, at 8:00 PDT/17:00 CEST/15:00 UTC.
You can get started with Grafana in minutes with Grafana Cloud. We have free and paid Grafana Cloud plans to suit every use case — sign up for free now.
Grafana Alerting: new and improved in Grafana 9
In Grafana 8.0, we introduced an overhauled alerting system that brought together Prometheus alerting and Grafana alerting into the same user interface for viewing and editing, and provided a common experience for all Grafana users across open source, Grafana Cloud, and Grafana Enterprise. The Grafana Alerting system is now the default in 9.0, and with that change, we have further improved the alerting experience — particularly with the UI and documentation.
To learn more about the latest improvements to Grafana Alerting, tune into the “Alerting in Grafana 9: what’s new and improved” GrafanaCONline session on Thursday, June 16, at 8:00 PDT/17:00 CEST/15:00 UTC. You can also read more in our latest Grafana Alerting blog post or in the Grafana Alerting documentation.

Grafana OnCall is now open source
Grafana OnCall was launched on Grafana Cloud late last year to enable DevOps and site reliability engineering (SRE) teams to integrate on-call management into their existing Grafana deployments, alerting sources, and monitoring tools. While monitoring incident response from a central view helps users resolve incidents faster, not every organization could take advantage of this cloud-based solution, due to security requirements, legal issues around sensitive data, limited connectivity, and other reasons.
At GrafanaCONline 2022, Grafana Labs announced we have open sourced Grafana OnCall for self-managed and on-prem installations. Grafana OnCall OSS is now available via GitHub download, in addition to all paid and free plans of the fully managed Grafana Cloud offering. To learn more about Grafana OnCall open source, check out the GitHub repo, blog post, and documentation.
Grafana Live is coming to a city near you!
This summer, Grafana Labs is racking up the frequent flyer miles and coming to a city near you. With our new Grafana Live conference series, Grafanistas will be hitting up four different cities to share new ways to put Grafana to work in your organization, answer all your technical questions at our Ask-the-Expert booth, and most importantly, connect with you and the Grafana community in person. To learn more about Grafana Labs’ LGTM open source stack (Loki for logs, Grafana for dashboards, Tempo for traces, and Mimir for Prometheus and Graphite metrics) and make invaluable connections with the Grafana community in your area, register for Grafana Live today.

For more information about these announcements, read our complete press release about GrafanaCONline 2022.


