Grafana Alerting: Explore our latest updates in Grafana 9
Grafana 8 marked a major redesign in the way we do alerting. We created a unified alerting experience that implemented a workflow that operates across all of our products and combined Grafana panel alerts and Prometheus-style alerts into a single pane of glass. We built this as an open source feature first to make sure you could opt in and try it out from day one, regardless of which flavor of Grafana (OSS, Cloud, or Enterprise) works best for you.
Over the past year, we’ve gotten a lot of community feedback about the new alerting system. Some of the comments were good; many of them were suggestions for how we could do better. We heard you. We’ve done a lot of work to polish the experience, and we will continue to make quality-of-life enhancements on a regular basis.
With the release of Grafana 9 during GrafanaCONline 2022, Grafana Alerting is now the default alerting system, and along with that change, we are introducing significant improvements based on your feedback, as well as more robust documentation and video content to help you use it.
There’s supposed to be a video here, but for some reason there isn’t. Either we entered the id wrong (oops!), or Vimeo is down. If it’s the latter, we’d expect they’ll be back up and running soon. In the meantime, check out our blog!
As always, we are grateful to our community for your candor and your contributions, and we’re excited to showcase some of the changes the team has made to streamline alert creation, provide a consolidated view of all your alerts, and give you the ability to combine data from multiple data sources to create alert rules.
To find out more about the Grafana Alerting system and for a demo of some of the latest upgrades, watch our recent GrafanaCONline 2022 session “Alerting in Grafana 9: What’s new and improved,” which will is available on demand.
What’s new in Grafana Alerting?
Multi-dimensional alerts
A user’s expectations of alert rules are very simple:
- You have a single query.
- You want that query to fire multiple alerts.
- You want to have control over those alerts individually.
Prior to Grafana 9, alerts needed to be tied to a panel or a dashboard. You now have control over the alerts produced by a rule individually.
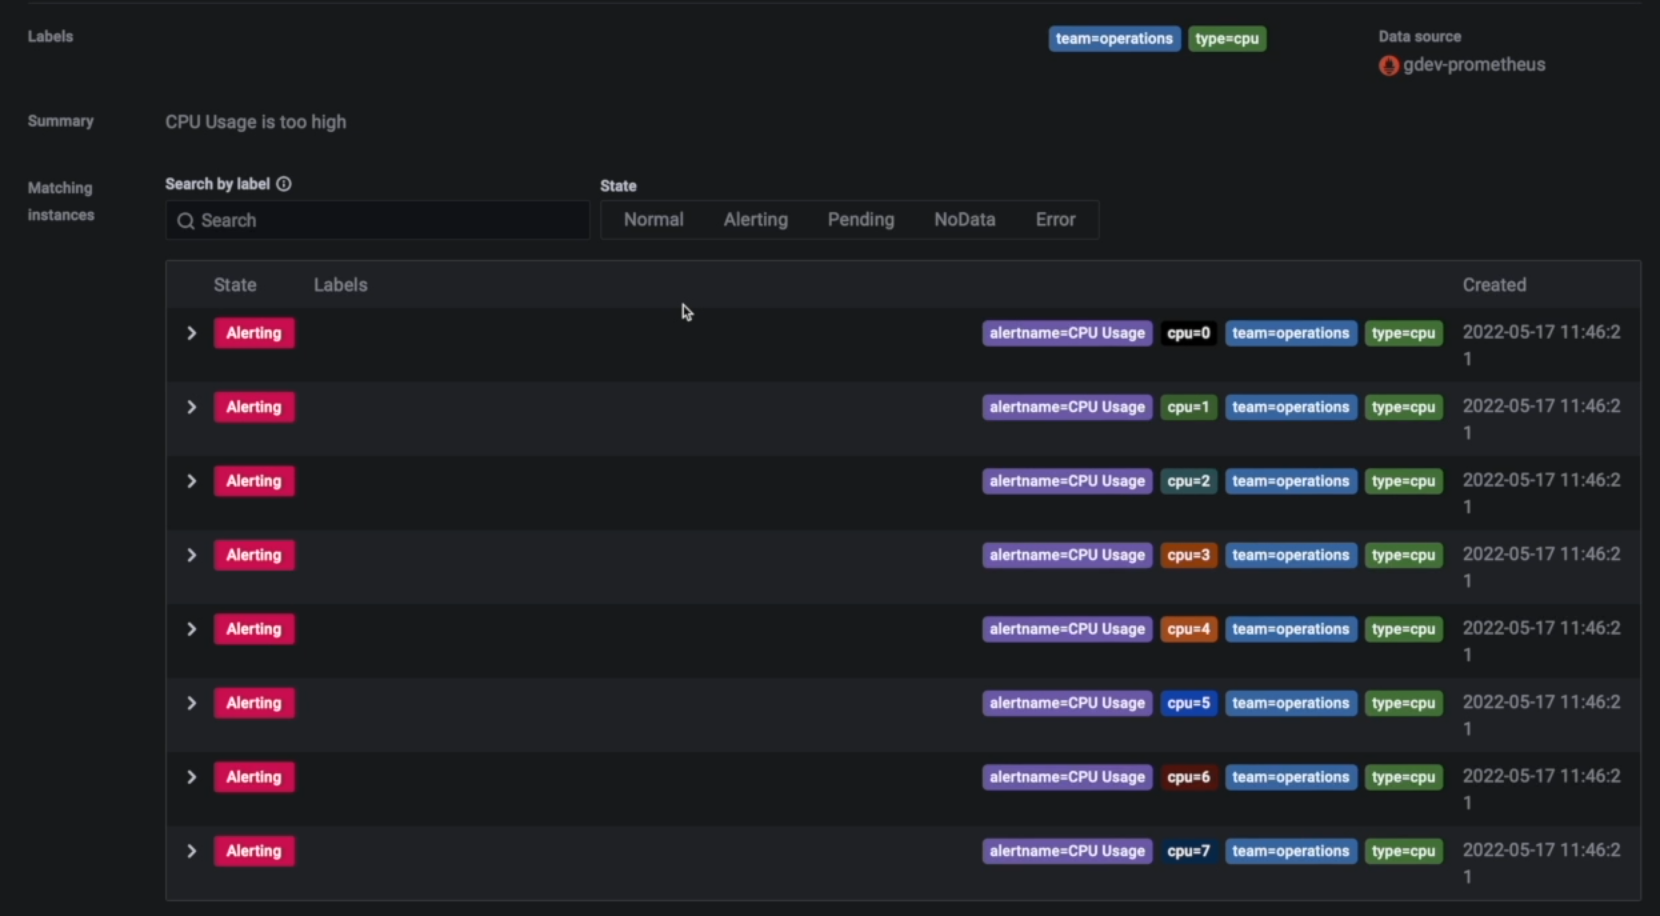
Alert rules can create multiple individual alert instances per alert rule, a.k.a. multi-dimensional alerts. This feature gives you the power and flexibility to gain visibility into your entire system with just a single multi-dimensional alert.
A rule defines when to alert, but you can alert on many items! A real world example: Imagine you have a smart home and want to know when windows are open. With Grafana Alerting, you can have one alert, “Tell me if windows are open,” and for each window you’ll receive a “Window x is open!” You don’t need to create more than one rule.

Above: One alert can create many alert instances with labels distinguishing them.
Grouping and routing alerts
Grafana Alerting allows you to route each alert instance to a specific contact point based on labels you define.
But with new control comes new responsibilities. When you get an alert storm, you could be bombarded by hundreds of alerts being fired at the same time. You most likely don’t want 100 notifications coming out on the other end.
Notification policies are the answer to this issue. They are the set of rules for where, when, and how the alerts are routed to contact points. (These were previously referred to as notification channels.) Combining notification policies with the grouping functionality allows you to make sure that all the alerts related to one component of your system are bundled together, so that Grafana will send a single compact notification that has all the affected environments for this alert rule.
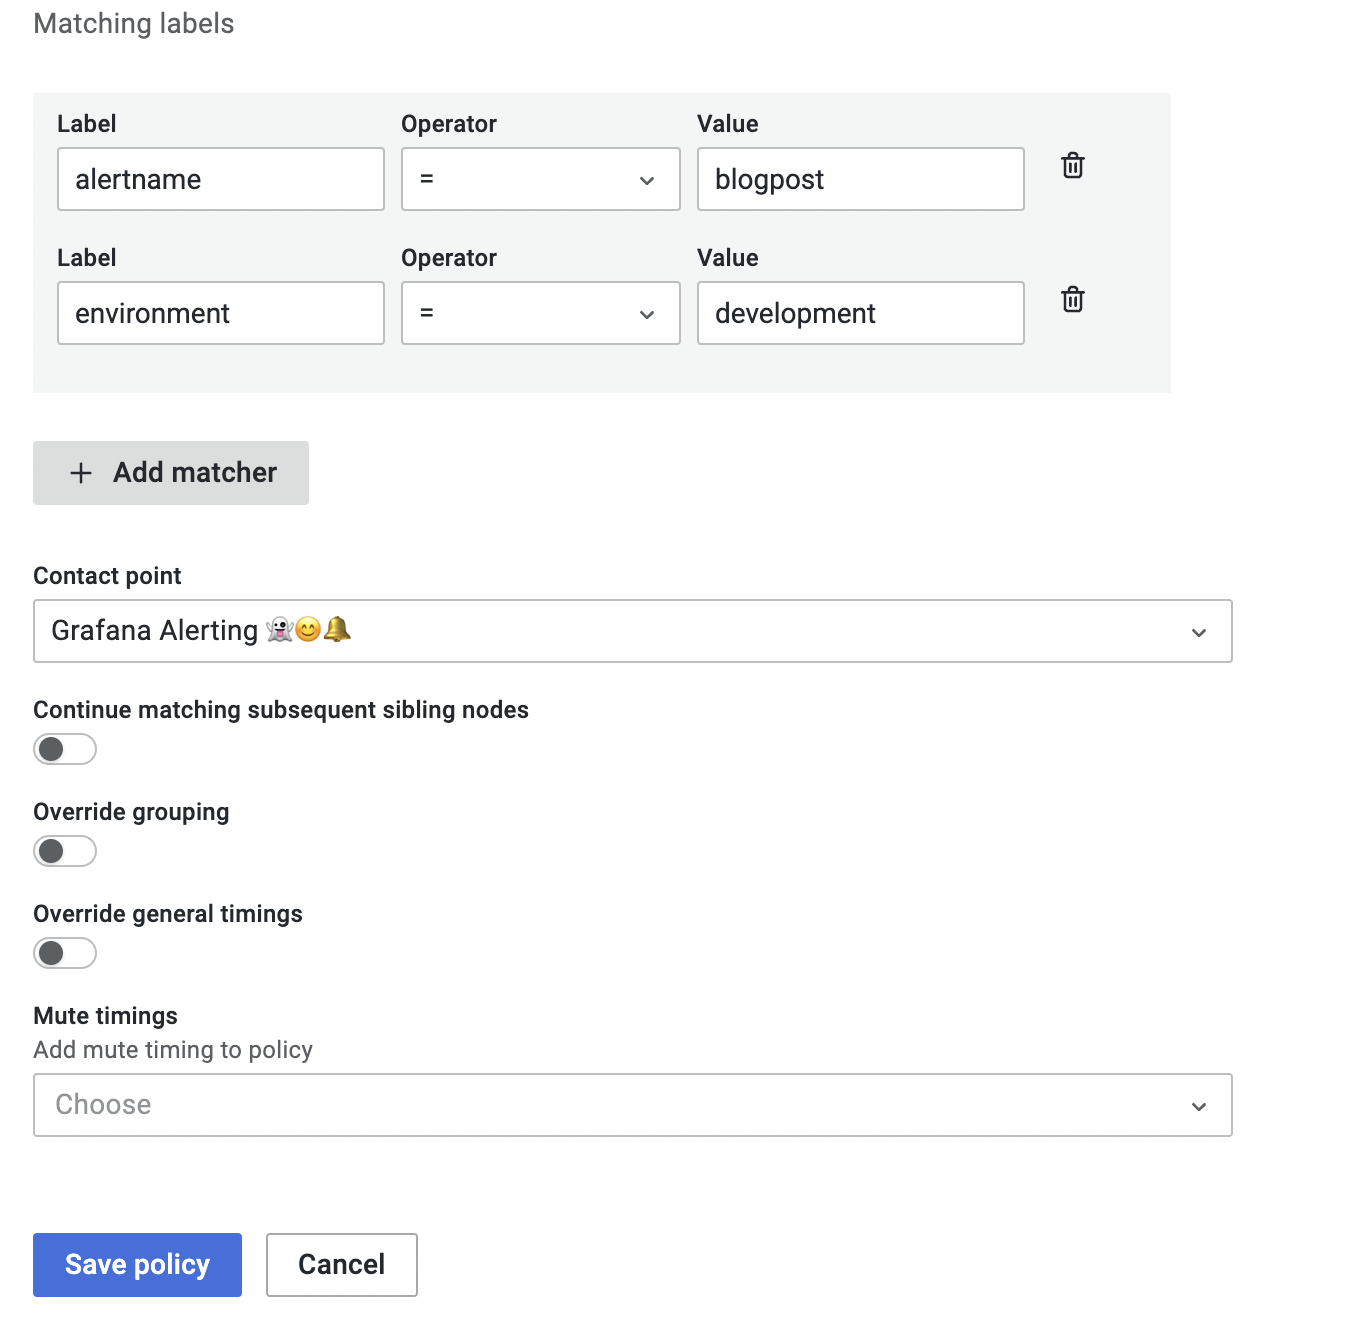
Notification policies follow a tree structure, in which each policy can have one or more child policies. Each policy, except for the root policy, can match specific alert labels. Each alert is evaluated by the root policy, and subsequently by each child policy, for you to match your alerts against multiple contact points. As a result, one alert can notify multiple channels based on certain label criteria. How cool is that?

Above: How to create a notification policy using labels to group alerts.
Silencing alerts
As the saying goes: Silence is golden — and this especially applies to alerting. Silences allow you to stop notifications from one or more alerting rules. With this new feature, you can even partially pause an alert based on certain criteria.
Silences, however, only stop notifications from getting created. They do not prevent alert rules from being evaluated, nor do they stop alerting instances from being shown in the user interface. This is deliberate; you can see the current status of your evaluation but receive no notification on the pager side, so you are still getting full transparency and maintaining visibility into what’s happening within your alerting system.
Mute timings
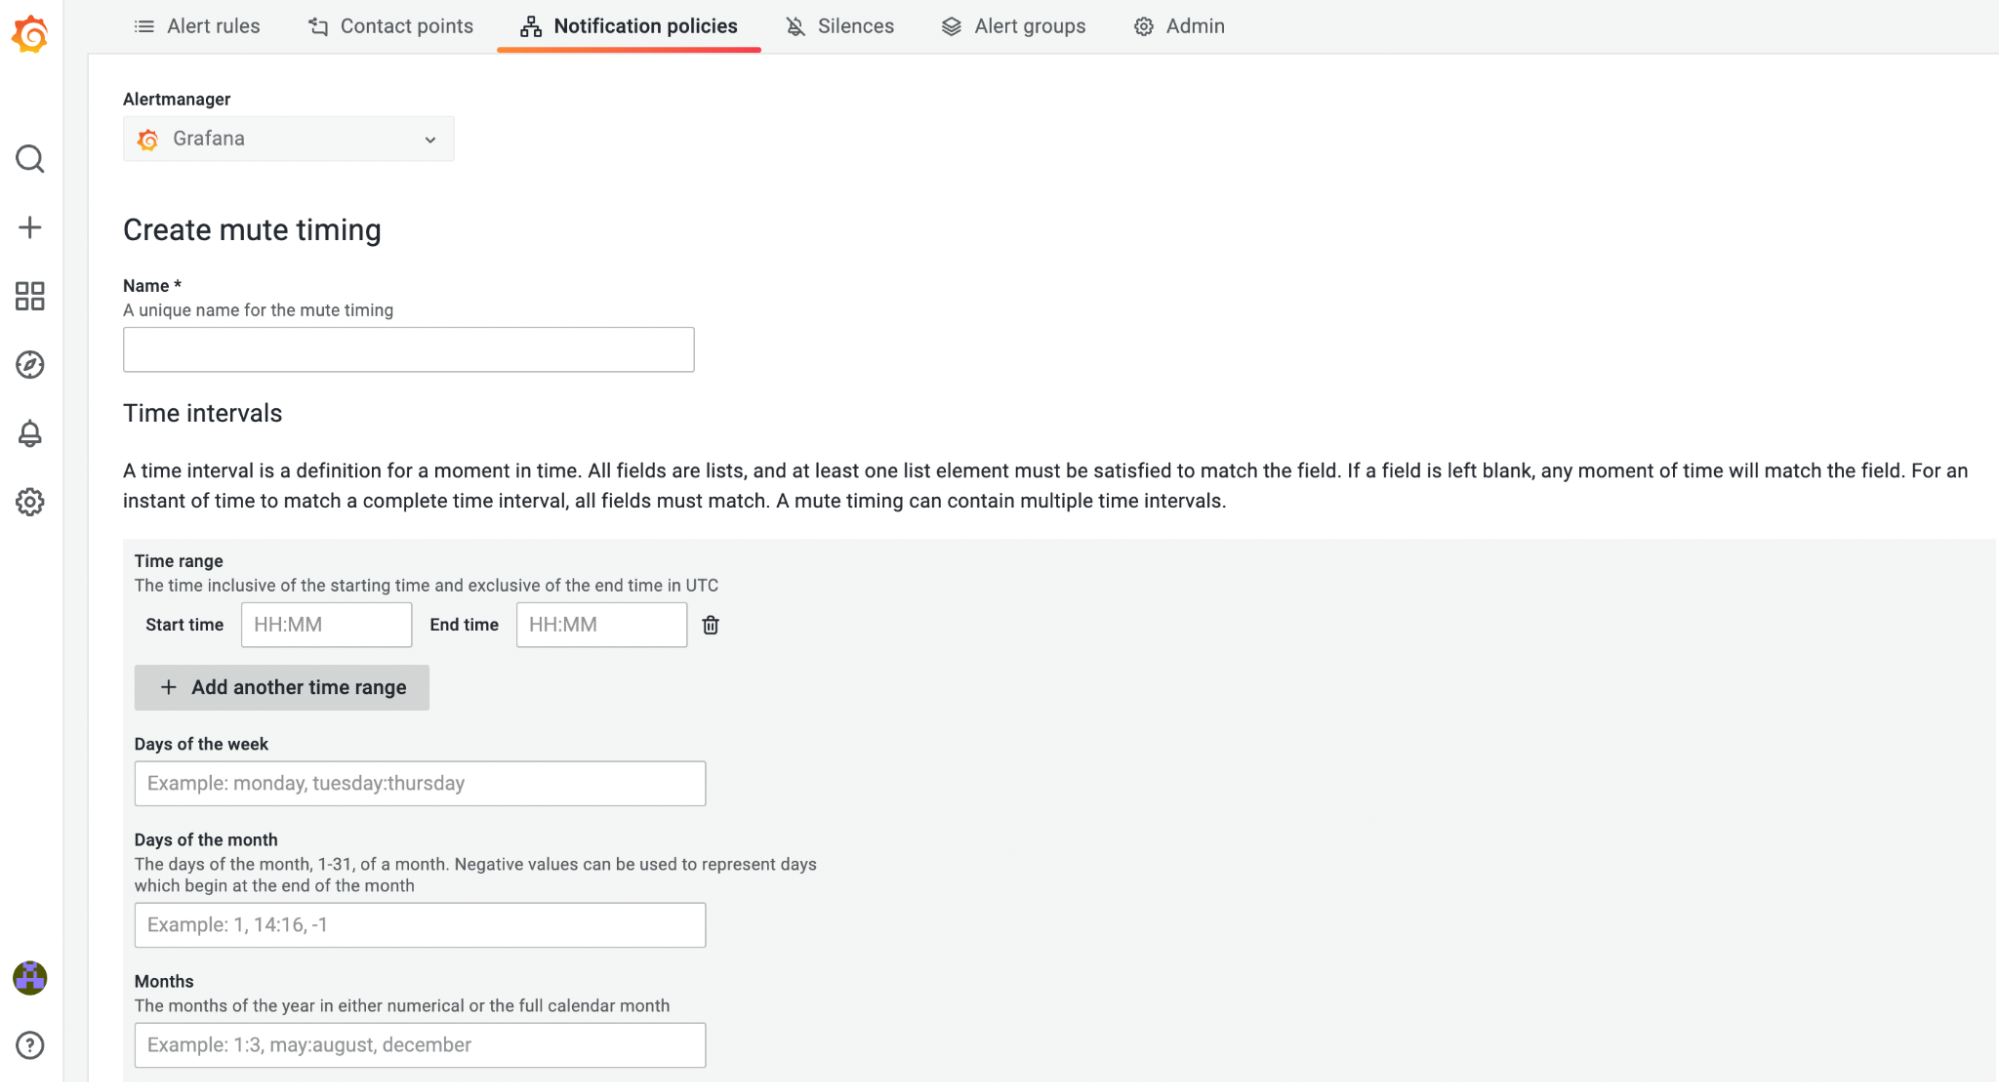
Mute timings are something that the community was very vocal about, and we heard the feedback loud and clear. With Grafana 9, Grafana Alerting now allows you to specify a time interval when you don’t want new notifications to be generated or sent.
For example, you can now set mute timings to several or all of your routes so that you are not getting paged on weekends or during a family event.

What’s next for Grafana Alerting
The new and improved features in the Grafana Alerting system are now enabled by default for all users in Grafana 9. While Grafana users currently have the option to roll back to the former alerting experience based on dashboard panels (now referred to as “legacy alerting”), we will officially remove that functionality in Grafana 10.
Here’s a glimpse at some of the Grafana Alerting updates that we will be rolling out soon:
- Improved user experience creating and managing alerts
- Add role-based access control
- An update of our Terraform provider based on the new provisioning API available in Grafana 9.0
- Improve migration path to ensure we minimize any chances of data loss
- Improve templates
Stay tuned for dedicated blog posts on some of these improvements in the coming weeks. To learn more, please read our Grafana Alerting documentation.
Grafana Cloud is the easiest way to get started with metrics, logs, traces, and dashboards. We have a generous free forever tier and plans for every use case. Sign up for free now!


