
How to monitor a sourdough starter with Prometheus and Grafana Cloud
Two years ago, I made a confession on this blog: I was one of those people who had been making homemade bread during the coronavirus lockdown — and I even grew my own sourdough starter.
Like a good sourdough starter — that yeasty mixture used to make bread rise (I like the King Arthur Flour recipe) — my love of breadmaking has only grown over time. As has my joy of monitoring my sourdough starter’s progress.
As a software developer at Grafana Labs and a genuinely curious person, when I first learned that it was possible to make a sourdough starter monitoring system, I had to try it. The system I made was inspired by sourd.io, which was created by Christine Sunu. I enjoyed the process so much that I shared it with everyone on the Grafana Labs blog, and recently my work was also featured in Make magazine.
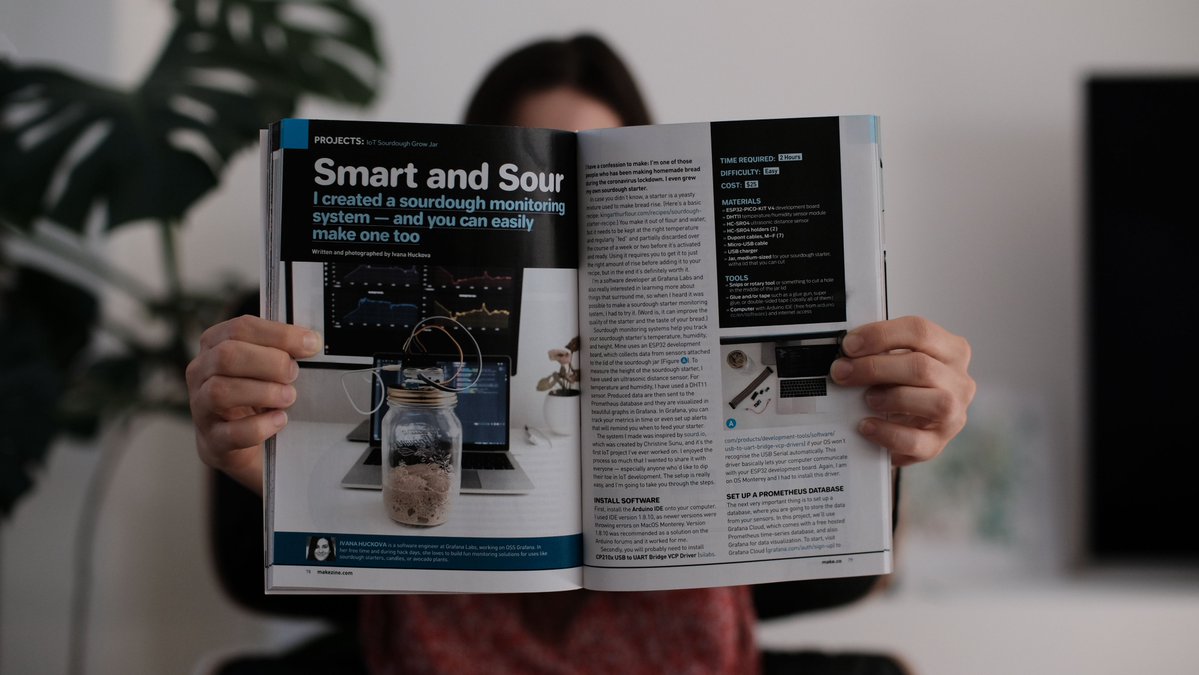
A sourdough monitoring system helps you track your sourdough starter’s temperature, humidity, and height. My sourdough monitoring setup uses an ESP32 development board, which collects data from sensors attached to the lid of the sourdough’s jar. To measure the height of the sourdough starter, I used an ultrasonic distance sensor. For temperature and humidity, I used a DHT11 sensor.
In my earlier sourdough monitoring setup, I used InfluxDB to store data and Grafana Cloud for dashboarding. For this blog post and for Make magazine, I updated my setup so that now the collected data goes to Grafana Mimir, the open source time series database that stores Prometheus metrics, in Grafana Cloud, and the information is visualized in beautiful graphs in Grafana. In Grafana, you can track your metrics over time or even set up alerts that will remind you when to feed your starter.

Sourdough starter monitoring: The setup
Install the software
First, install the Arduino IDE onto your computer. I used IDE version 1.8.10, as newer versions were throwing errors on macOS Monterey. Version 1.8.10 was recommended as a solution on the Arduino forums, and it worked for me.
Second, you will probably need to install CP210x USB to UART Bridge VCP Driver if your OS won’t recognize the USB Serial automatically. This driver basically lets your computer communicate with your ESP32 development board. Again, I am on macOS Monterey, and I had to install this driver.
Set up a Prometheus database
The next very important thing is to set up a database where you are going to store the data from your sensors. In this project, we are going to be using Grafana Cloud.
To start, we’ll visit the Grafana Cloud signup page and create a new free account, which comes with 10K metrics and Grafana for visualization. As soon as the account is all set up, we can see the portal with hosted Grafana and Prometheus instances.
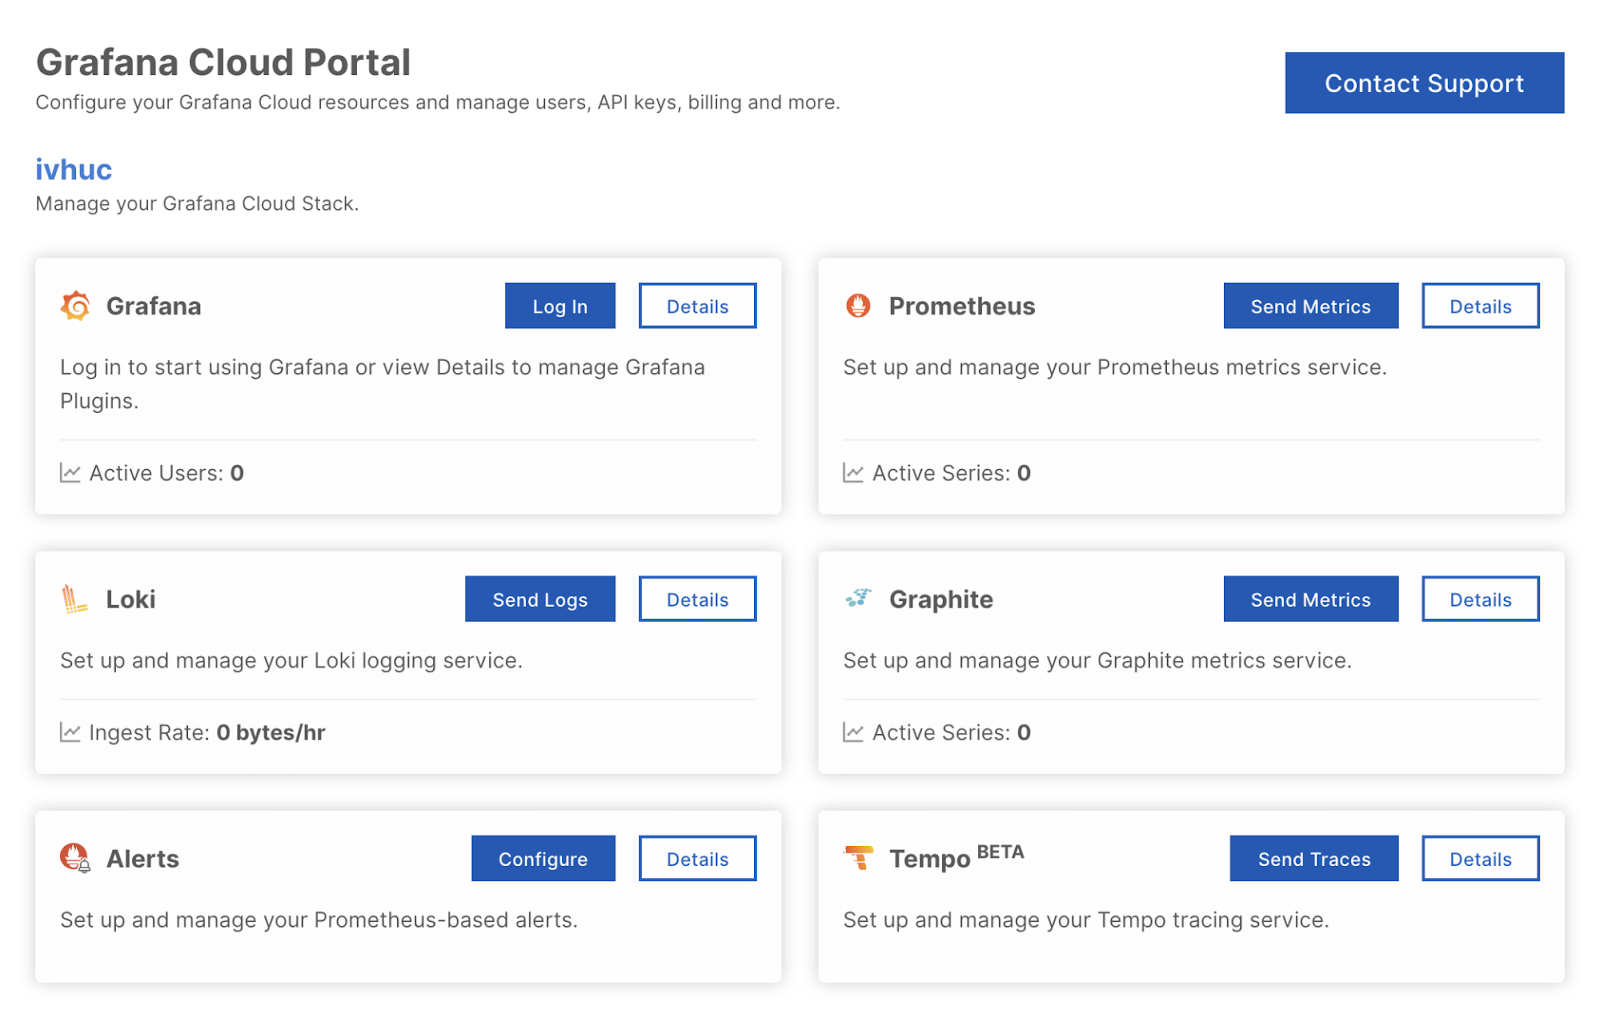
As soon as this is done, you’ll need to click on the Send Metrics button next to the Prometheus card and create a new API key. Keep that API key together with User information on hand because we will use them soon to send our data to the database.
Connect sensors to board
DHT11 sensor
The DHT11 is a very basic and cheap sensor made of two parts — a humidity sensor and a thermistor. It can be used to measure the environment in which our sourdough starter lives.
If you have bought a DHT11 sensor module, then you should see 3 pins or 4 pins. In the 4-pin version, one of the pins will not be used. No worries if you have the 4-pin version — you probably bought just a sensor by itself. This has happened to me as well, and it is an easily solvable problem — you just won’t use the third pin.

We are going to connect these pins in the following way, as shown in the figure above:
- Vcc pin to 3.3V on board
- Digital pin to pin 32 on board
- Gnd pin to Gnd on board
HC-SR04 sensor
The HC-SR04 ultrasonic sensor provides 2cm–4 meters of measurement function, with accuracy around 3mm. This sensor will be used to measure how far your sourdough starter is from the lid and calculate its rise and/or fall. The HC-SR04 has 4 pins that you will connect to the ESP32 board in the following way:
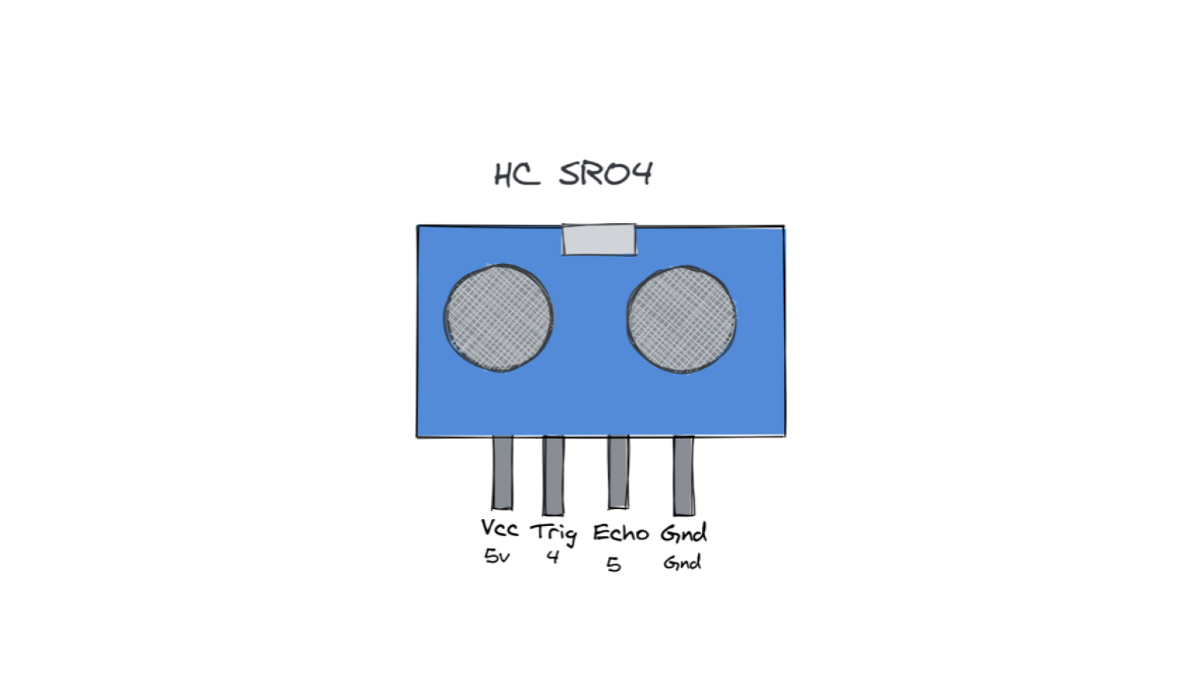
- Vcc pin to 5V on board
- Trig pin (sends the signal) to pin 4 on board
- Echo pin (receives signal) to pin 5 on board
- Gnd pin to Gnd on board
Programming the sourdough starter monitoring system
You next need to write and upload a program that is going to retrieve data from the sensors and send it to the Prometheus compatible database. Connect your ESP32 board (with connected sensors) to your computer with a microUSB cable.
Setting up Arduino IDE to support your ESP32 board
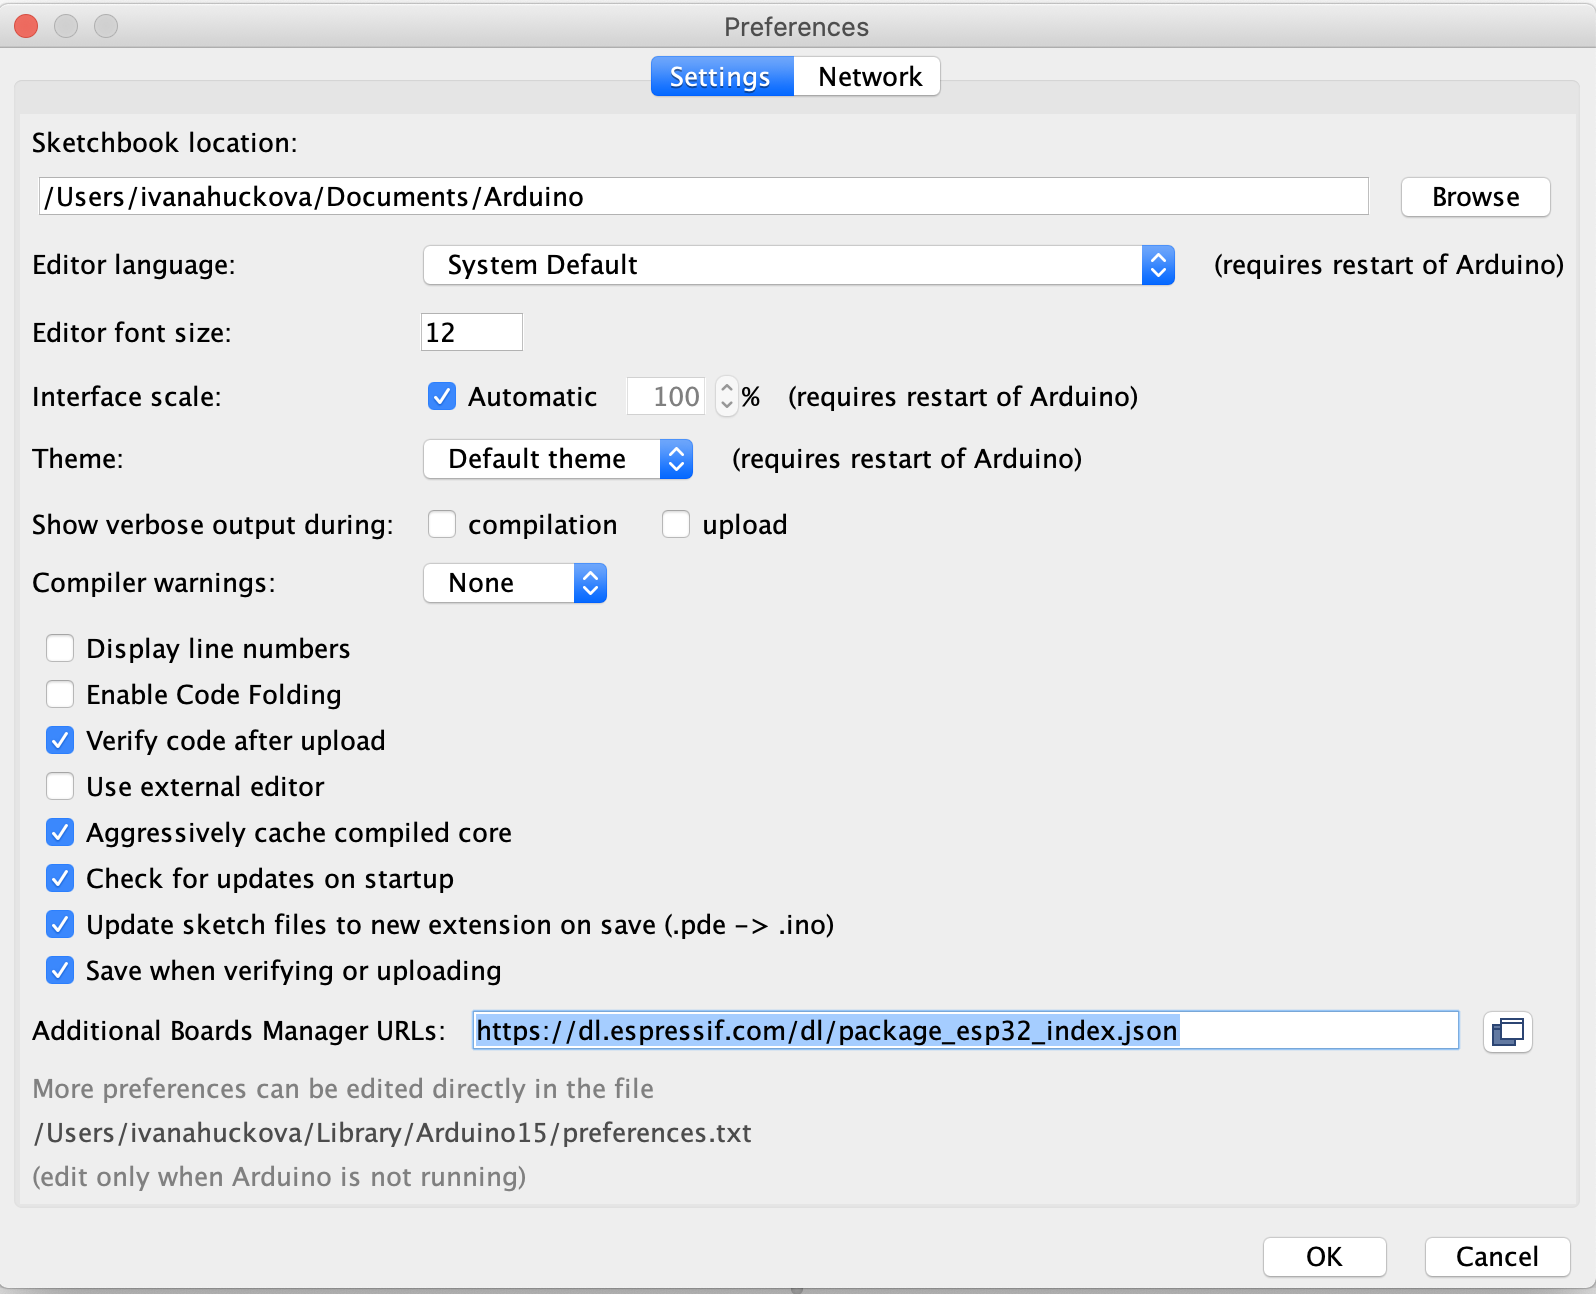
Open your Arduino IDE. If you are using an ESP32 board (and not an Arduino board), you need to add a board definition that adds support for your EP32 board. Go to Arduino > Preferences and add url https://dl.espressif.com/dl/package_esp32_index.json to the Additional Boards Manager URLs input. This open source board definition adds support for programming ESP32 boards.
Then go to Tools -> Boards -> Boards Manager and add ESP32 board manager.

Next, in Tools -> Boards, choose ESP32 Pico Kit board. This tells the Arduino IDE which profile and base libraries to use when compiling the firmware image, and how to flash it to the board. Make sure that in the Tools -> Port submenu, you have selected the new COM port.

Adding libraries
For this project, you are going to use the following libraries:
- DHT sensor library by Adafruit
- HCSR04 by Martin Sosic
- Adafruit Unified Sensor by Adafruit
- ArduinoBearSSL by Arduino
- ArduinoHttpClient by Arduino
- PrometheusArduino by Ed Welch
- PromLokiTransport by Ed Welch
- SnappyProto by Ed Welch
Go to Sketch -> Include Library -> Library Manager and install all of these. Make sure that you have all of them installed before moving to the next steps.
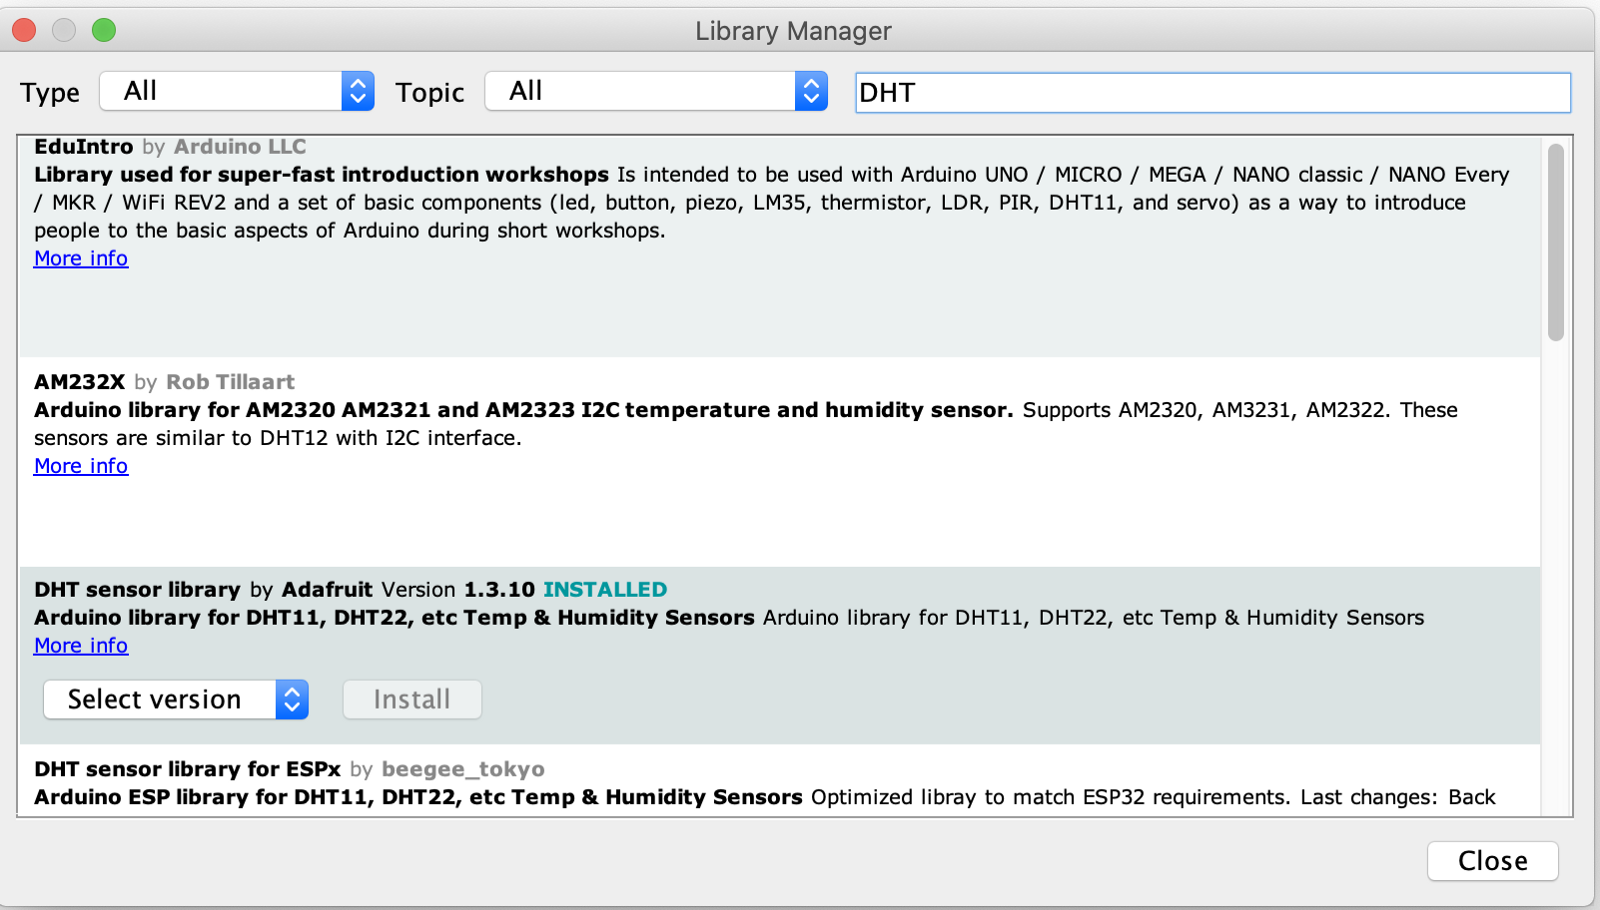
Creating a program
You can download the sketch from Github. In the folder, you will find 2 important files: config.h and sourdough_monitoring_grafana.ino. In the first file, we have our program. In the second, we are going to store our variables.
File config.h
Add your variables:
- Your Wi-Fi name and password, so the ESP32 can connect to your internet
- Your user id as GC_PROM_USER
- Your API key as GC_PROM_PASS
File sourdough_monitoring_grafana.ino
Below you can find the program code with the comments explaining each section.
Upload and run the sourdough monitoring program to ESP32
Let’s make this all come together!
Click on the open button (arrow pointing up), choose Open, find your sourdough_monitor_grafana.ino file and open it.
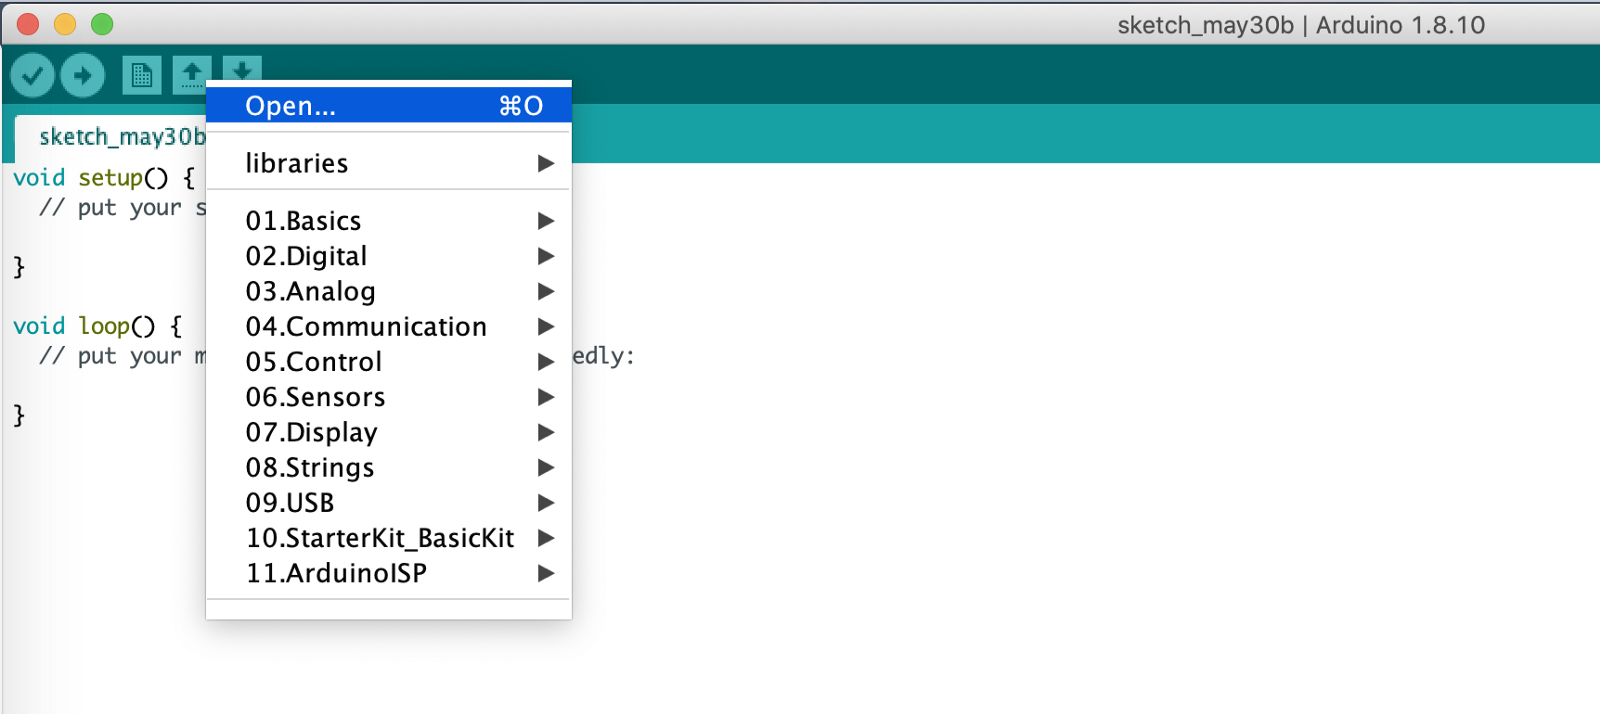
Then go to Tools -> Serial Monitor and open it. This will allow us to see the debug output from the board. Set the port speed on the bottom to 115200.
Lastly, use the Upload button (arrow pointing to right) in the top bar of the IDE window to build and upload the program to the ESP32.
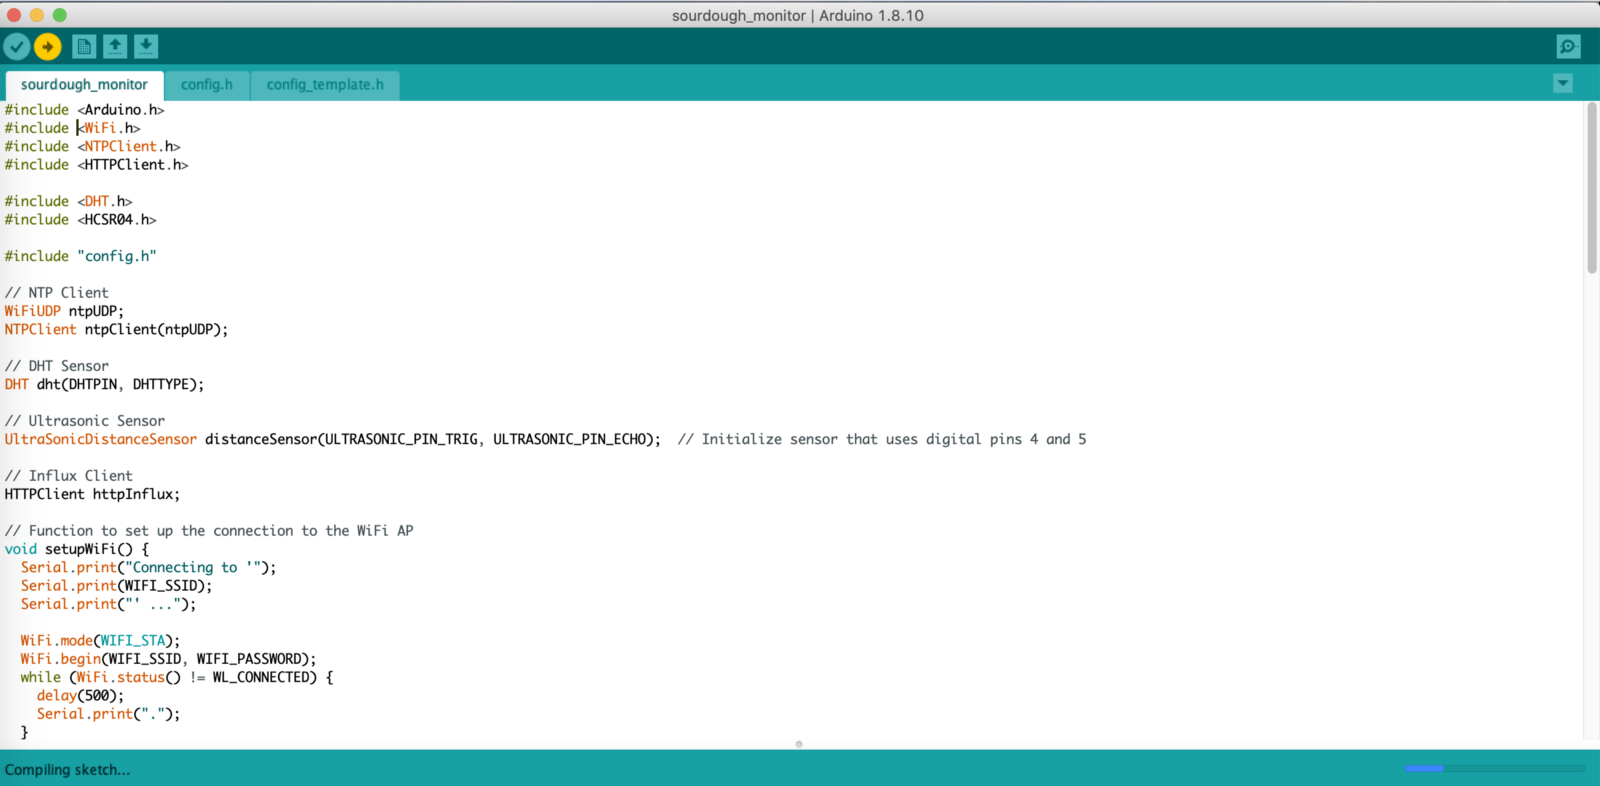
Once the upload has completed, our Serial Monitor will show:
- Start-up and Wi-Fi connection
- Results of submitting metrics
If everything was set up correctly, you will soon see incoming data also in your Prometheus compatible database.
Visualizing sourdough starter monitoring data in Grafana
Now, when you have all your data flowing to Prometheus, it is time to visualize them in Grafana. To open Grafana, just click on Log In in your Grafana Cloud page.

Next, we will create dashboards. Just click on Create dashboard, Add a new panel, and choose your Prometheus data source. If you are not familiar with Prometheus query language, you can click on the Metrics browser and choose the metrics you want.

Add monitoring system to sourdough jar
Now comes the hands-on part. This is how I mounted the electronics in my jar, but I am sure there is a much better way, so feel free to improvise with what you have.
Take the lid from the jar and carefully make two holes: one in the middle of the lid for the ultrasonic sensor and another smaller one next to it for the DHT11.
Put the ultrasonic sensor in the HC-SR04 holder and glue it to the top of the lid. With double-side tape, stick the DHT11 to the lid so it is facing the jar.
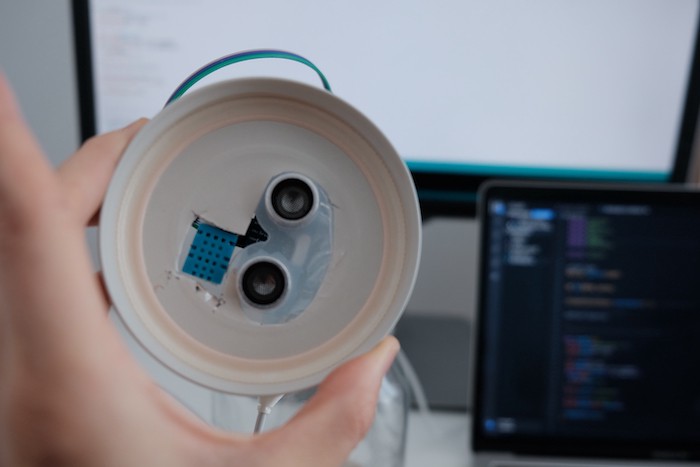
With a glue gun, carefully glue the ESP32 board to the top of the HC-SR04 holder. Make sure that you are only gluing to extended parts on which the ESP32 board stands and not the board itself.
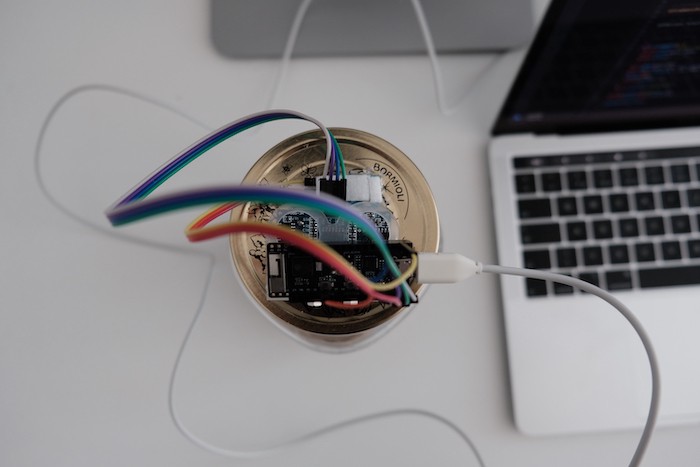

And this is how it looks! Just place it in the kitchen (or any other area where you keep your starter), and plug it to the USB charger.
Note: After taking this picture, I added a cover made from a cut plastic bottle to make sure that the sourdough does not dry out because of the holes in the lid.
Reading the Grafana dashboards
Grafana data is going to tell you more about the environment in which your sourdough starter is growing and about the starter itself. In your graphs, you can see the temperature and humidity inside the jar, which might be different from conditions in the room. The warmer it is, the quicker it grows and the more often you have to feed your sourdough.
Moreover, I have been evaluating the height of the starter and when the starter doubled its size or started to shrink, I knew it was feeding time. I had actually set up alerts in Grafana that notified me when this happened.
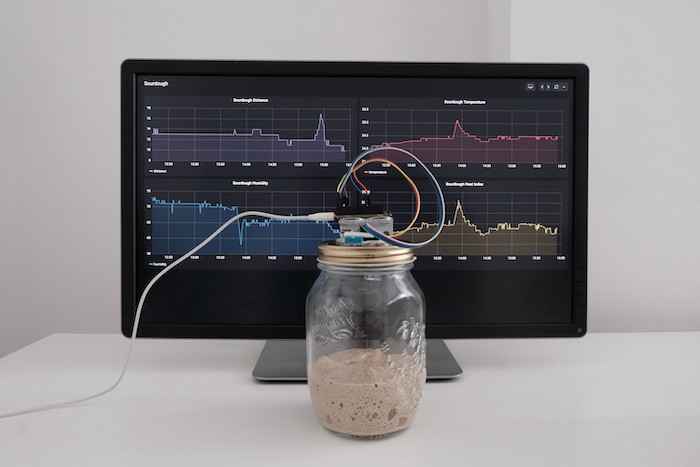
I really hope you will try this out and let me know how it went! Also, if you have some fun and interesting IoT ideas, I would ABSOLUTELY love to hear about them. Just tweet me @ivanahuckova.
Grafana Cloud is the easiest way to get started with metrics, logs, traces, and dashboards. We have a generous free forever tier and plans for every use case. Sign up for free now!


