How to monitor a Tesla with Grafana Cloud
One of the main reasons I joined Grafana Labs was because of the broad range of use cases and objectives that Grafana can solve. You can not only use the technology to monitor a Kubernetes environment or view metrics from Prometheus, traces from Jaeger, and logs from Elasticsearch all in one view, but it can also help keep a beehive colony healthy or run Doom. By embracing the Big Tent philosophy that Grafana lives by (which also inspired the title of our new podcast), the possibilities are endless.
And that was the inspiration for this blog.
For years, I have wanted to own a Tesla. The innovation and technology that encapsulates the brand is astounding and has always intrigued me. Fortunately last summer, during the hottest car market the world has seen, I stumbled my way into a Tesla Model 3. My experience with it has been fun, fast, and dumb (as I question why I bought a car that allows me to enable fart mode when my wife sits in the passenger seat).

Fast forward to March of this year, when I joined Grafana as a Senior Solutions Engineer. I was eager to get to know Grafana better, and having seen that the Tesla APIs were available for use, it felt like a good learning opportunity. Plus, I thought it would be fun to look at all of the cool usage insights I could collect, from understanding if my over-the-air (OTA) updates succeeded, to keeping track of my charge state, how many miles I’ve driven in the last month, if I left a door unlocked, and more.
Now I’d like to share my experience for any current or future Tesla drivers.
(For another take on analyzing electric car data with Grafana, check out what Ed Welch did with his Nissan Leaf.)
What you’ll need
A Raspberry Pi 3 or above (I ran mine on a 3 with only 1GB of memory and had no problem; 32GB+ storage is recommended) and the components needed to interact and use the Pi, like a mouse/keyboard/etc.
Software loaded and ready to go:
- Raspberry Pi OS installed
- Git
- ./setup.sh
- wget
A Tesla
Plus:
- A Grafana Cloud account
- Prometheus (local install on Raspberry Pi)
- This teslafi_exporter
Step 1: Install Grafana and Prometheus on Grafana Cloud
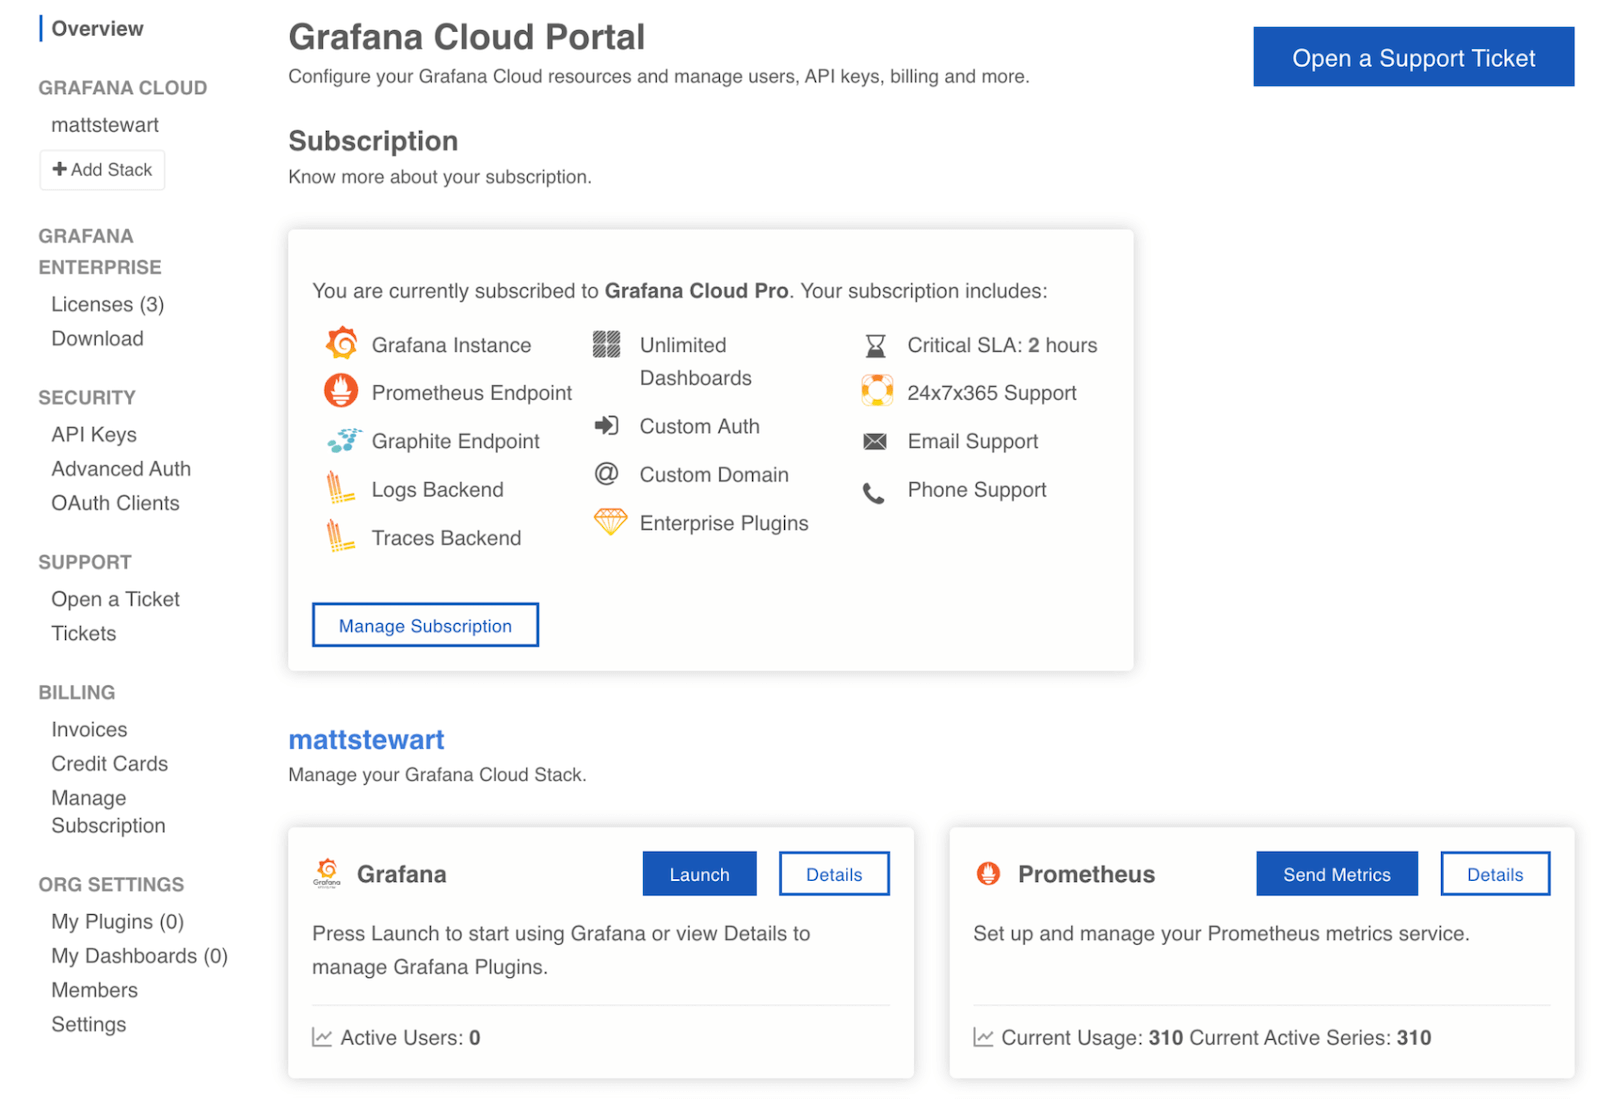
First, you’ll want to set up an account on Grafana Cloud so you can visualize your Tesla’s data. (If you already have an account, you can skip this step. If not, sign up for free here.)
Once you have Prometheus and Grafana up and running in Grafana Cloud, you can focus on the setup of the Raspberry Pi and the data collection from Teslafi.
Step 2: Install Prometheus locally on the Raspberry Pi
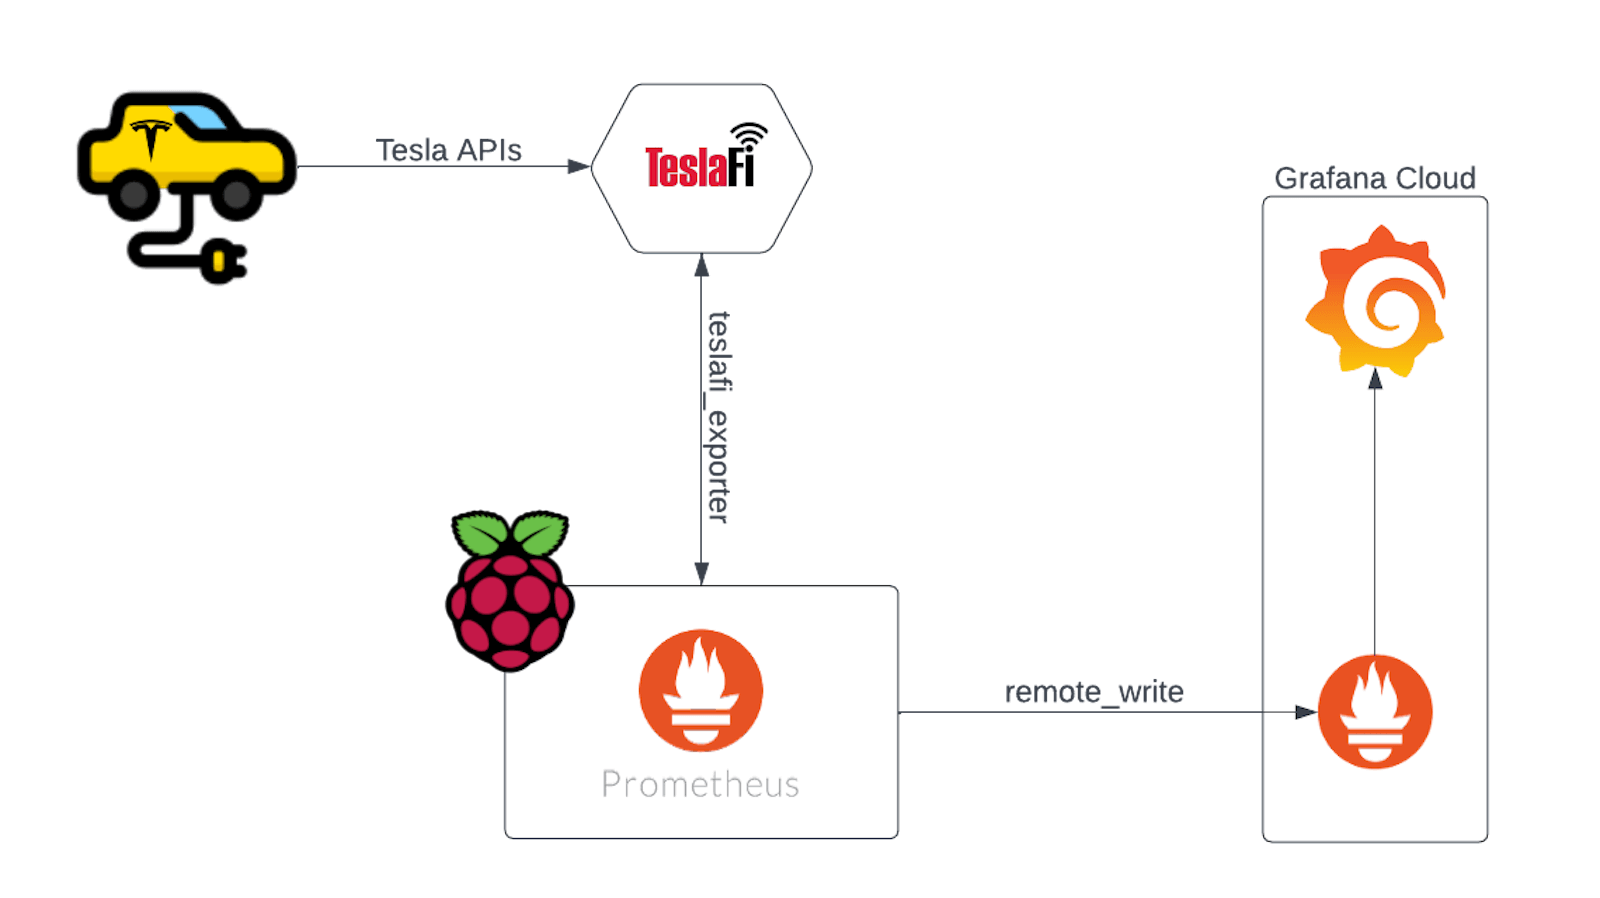
As you can see in the architecture diagram below, you need an instance of Prometheus also running on the Pi. Once your data lands in the local instance, you will then remote_write it to the larger, highly available, and more stable instance of Prometheus in Grafana Cloud.

To start, you will need command line access to the Pi via ssh or directly. I don’t have a wired keyboard and external monitor for use with my Pi, so I set up ssh access to my Pi with a headless setup. I used this blog to get that running.
To install Prometheus, you can grab it right from the official website. Make sure you are downloading a compatible version for your Pi. Mine is an older 32 bit model, so I installed the armv7. This is a helpful guide that the following few steps will be based on.
Begin with:
sudo apt-get updatewget
https://github.com/prometheus/prometheus/releases/download/v2.34.0/prometheus-2.34.0.linux-armv7.tar.gzNext, unzip:
tar -xzvf prometheus-2.34.0.linux-armv7.tar.gzRename the file:
mv prometheus-2.34.0.linux-armv7/ prometheus/mv prometheus-2.34.0.linux-armv7/ prometheus/
sudo vi /etc/systemd/system/prometheus.serviceInsert the following into the file:
[Unit]
Description=Prometheus Server
Documentation=https://prometheus.io/docs/introduction/overview/
After=network-online.target

[Service]
User=pi
Restart=on-failure

ExecStart=/home/pi/prometheus/prometheus \
  --config.file=/home/pi/prometheus/prometheus.yml \
  --storage.tsdb.path=/home/pi/prometheus/data

[Install]
WantedBy=multi-user.target
Save the file with esc, and then type :wq!
Now you can enable your service.
sudo systemctl enable prometheusThen start Prometheus.
sudo systemctl start prometheusCheck to see if Prometheus is running with:
sudo systemctl status prometheusYou should see an output similar to this:

You should also be able to see that Prometheus is running by heading to its web UI at on port 9090 or: your_pi_IP_address:9090.
You can stop this output by entering CTRL + C
And now you can stop Prometheus for the moment.
sudo systemctl stop prometheus
Step 3: Setting up the teslafi_exporter
Create a directory for teslafi:
mkdir teslafi
cd teslafi
Then clone the teslafi_exporter repo:
git clone https://github.com/neredera/teslafi_exporter.gitNext, you’ll need to head to Teslafi to grab your API token. While there are ways to access the Tesla APIs directly, using Teslafi was an easier approach.
You can access the Teslafi API location here after logging in. You will want to create a token if one has not already been created, and then copy down the Current Token number/letter string, not the whole link or anything further down on the page. (The one here is for reference only.)

Head back to your command line, and navigate to the teslafi_exporter.service file.
cd teslafi
cd teslafi_exporter
vi teslafi_exporter.service
There are three sections in the teslafi_exporter.service file that you need to alter: the filepath locations in both the WorkingDirectory and ExecStart and the token that you just got from Teslafi. Paste it into the enter_token_here location. Your config should look something like this (with your token inserted):
[Unit]
Description=Prometheus exporter for TeslaFi
After=multi-user.target

[Service]
Type=simple
User=teslafi_exporter
WorkingDirectory=/home/pi/teslafi/teslafi_exporter
ExecStart=/home/pi/teslafi/teslafi_exporter/exporter.py --teslafi_api_token enter_token_here
StandardInput=tty-force

[Install]
WantedBy=multi-user.target
Save the file with:
Esc and then :wq!
Step 4: Configure prometheus.yml
The final configuration you need to work on is your prometheus.yml. This can be found in the prometheus directory.
In this .yml, you will need to add a target scrape location and a section for remote_write that will allow you to send the data off to your Grafana Cloud Prometheus instance.
The final config will look something like this:
vi prometheus.ymlglobal:
scrape_interval: 120s
evaluation_interval: 120s
scrape_configs:
- job_name: teslafi
static_configs:
- targets: ['your_raspberrypi_ip:9998']
remote_write:
- url: https://your_prometheus_url_here
basic_auth:
username: your_username_here
password: your_password_hereIn order to get your url, username, and password for the remote write section, navigate to your Cloud admin area which can be found at https://grafana.com/orgs/your_org_name_here

Click on Prometheus -> Details
Copy the Remote Write Endpoint and insert it into the url section in your prometheus.yml config.
Copy the Username/Instance ID and insert it into the username section in your config.
Under Password/API Key in the Cloud Admin page, click on the blue ‘generate now’ link. Give your API Key a name and Admin access. Then copy the API key, and insert it into the Password section on the config.
Now you can save your config with esc and then :wq!
And you’re finished with config setup!
Step 5: Start up your instances
At this point, you should be able to visualize your data in Grafana after starting all of your services.
First, navigate to the prometheus directory and start Prometheus with:
sudo systemctl start prometheusTo check if it has started you can submit:
sudo systemctl status prometheusYou should see the same Active response that you saw when you did this earlier.
Next, start your teslafi_exporter. Navigate to the teslafi_exporter directory.
Change the permissions of the setup.sh file with:
chmod +x setup.shAnd then start the exporter with:
sudo ./setup.shConfirm that the exporter is active and up and running.
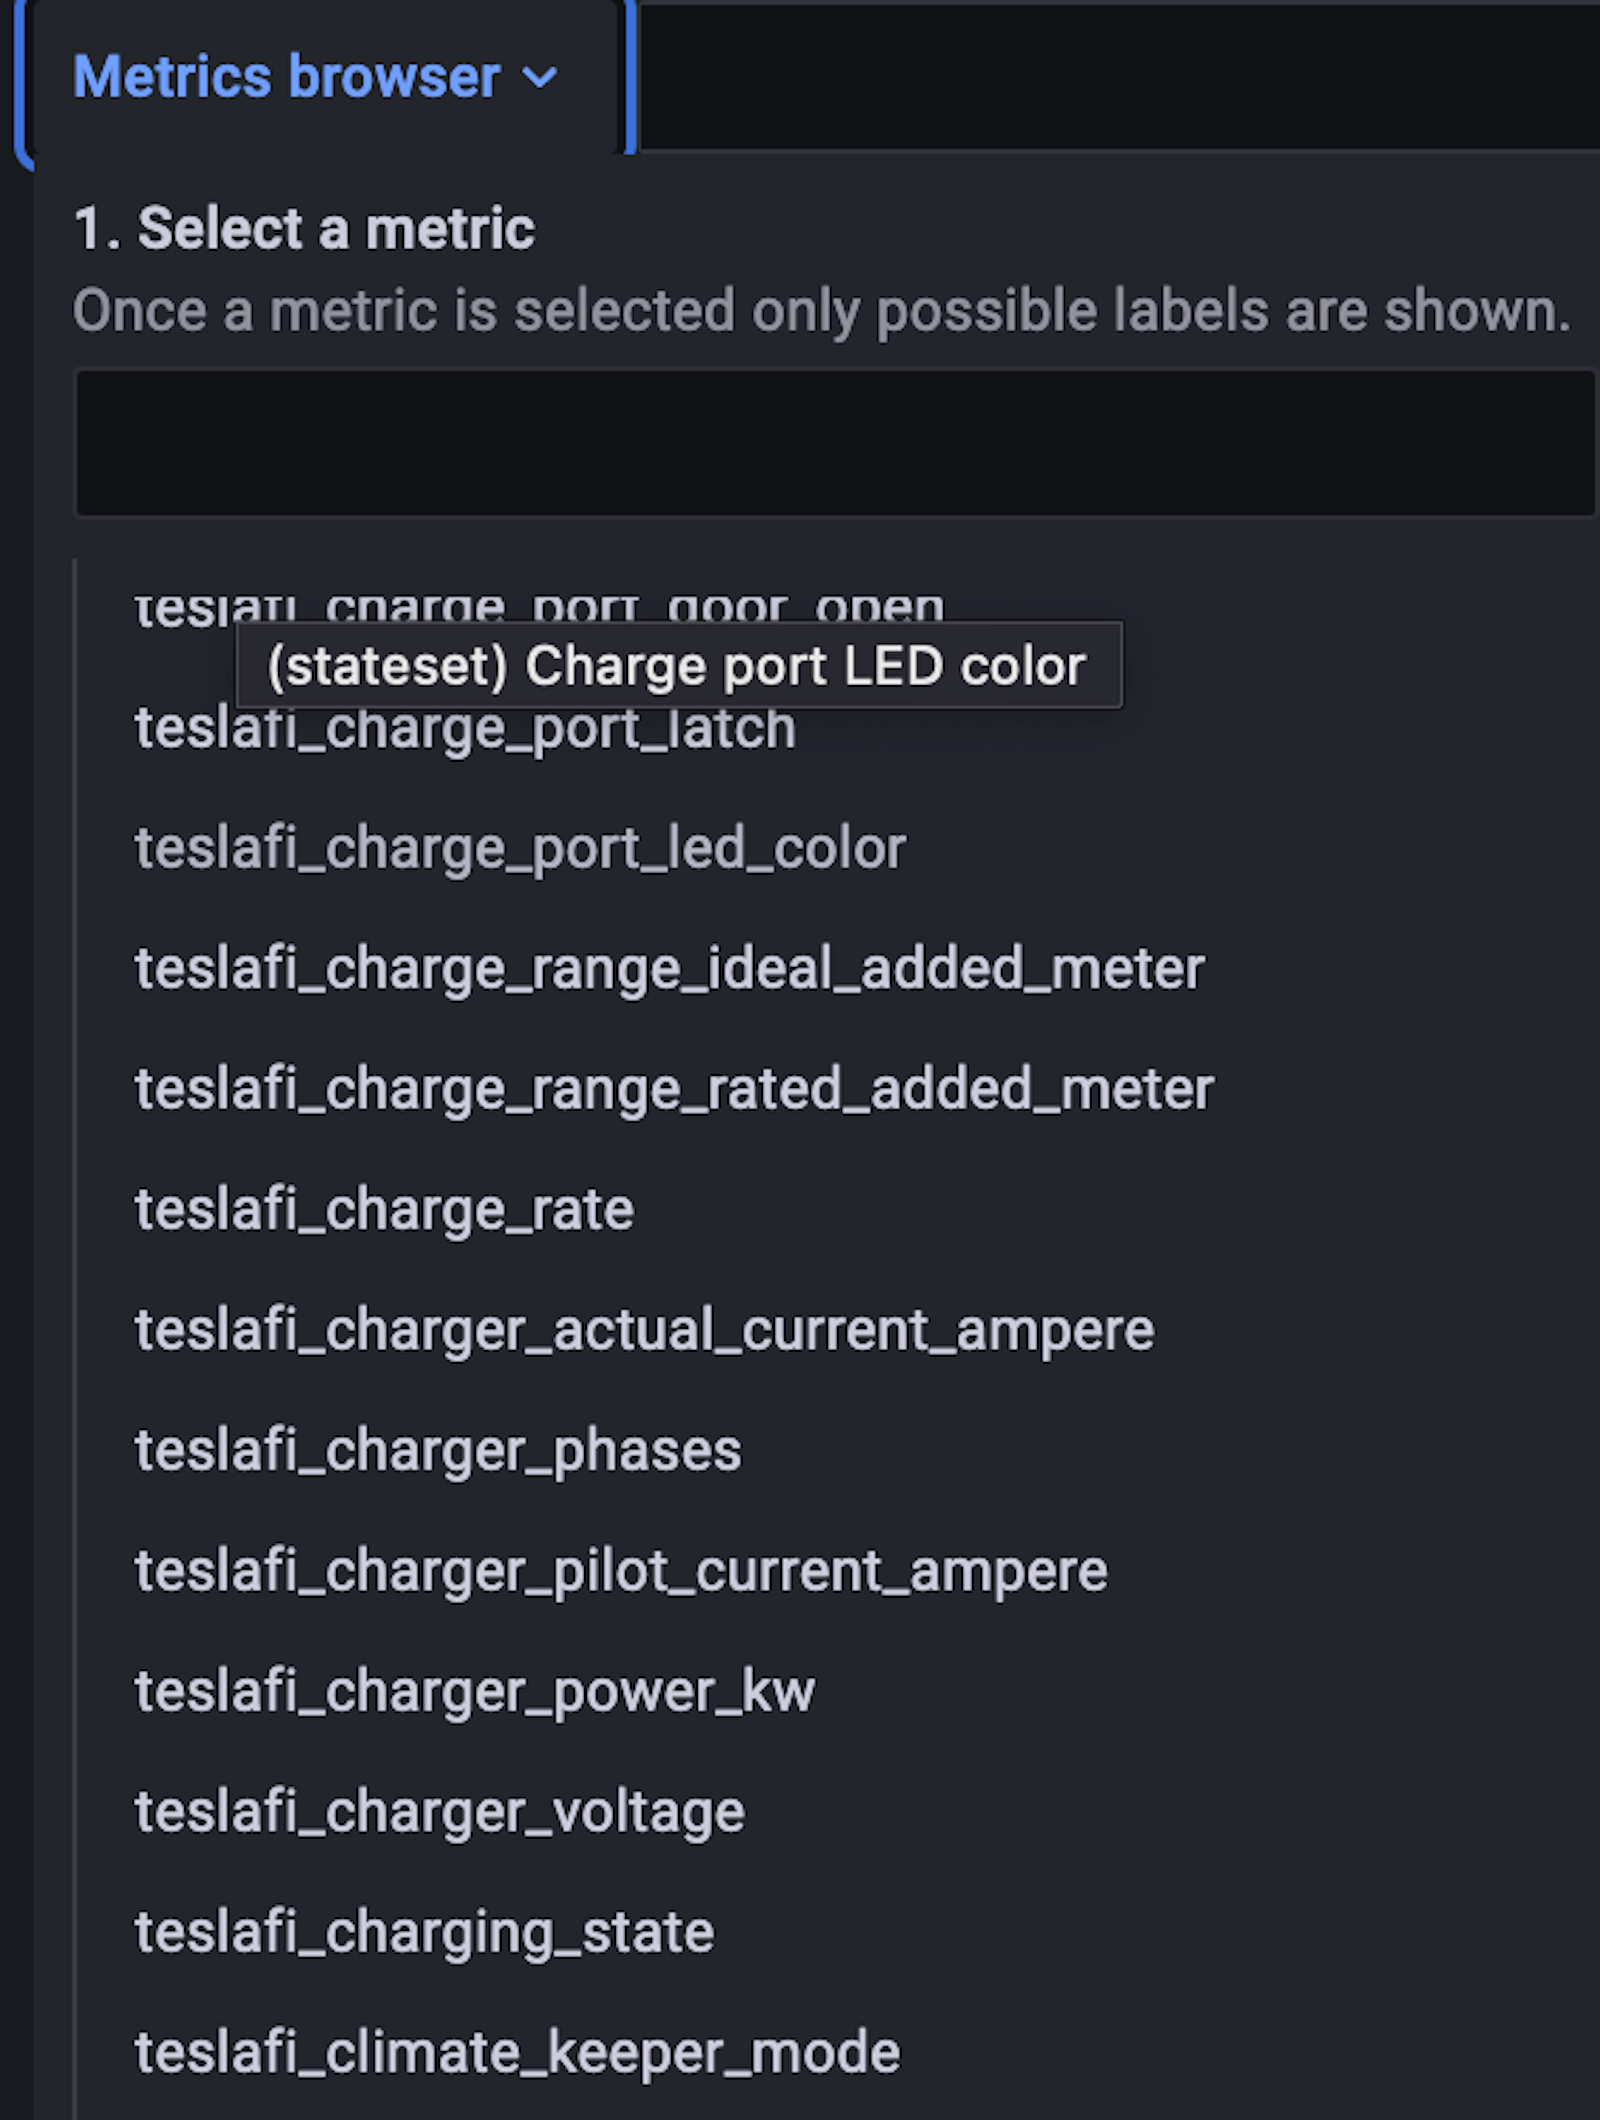
sudo systemctl status teslafi_exporter.serviceNavigate to Grafana, head to Explore, and select the grafanacloud-yourorgname-prom data source. Open the Metrics explorer, and you should now see data with the teslafi labels available to use.

Congrats! The Teslafi data is now being scraped and is usable inside of your Grafana Cloud and Prometheus deployments.
More to come
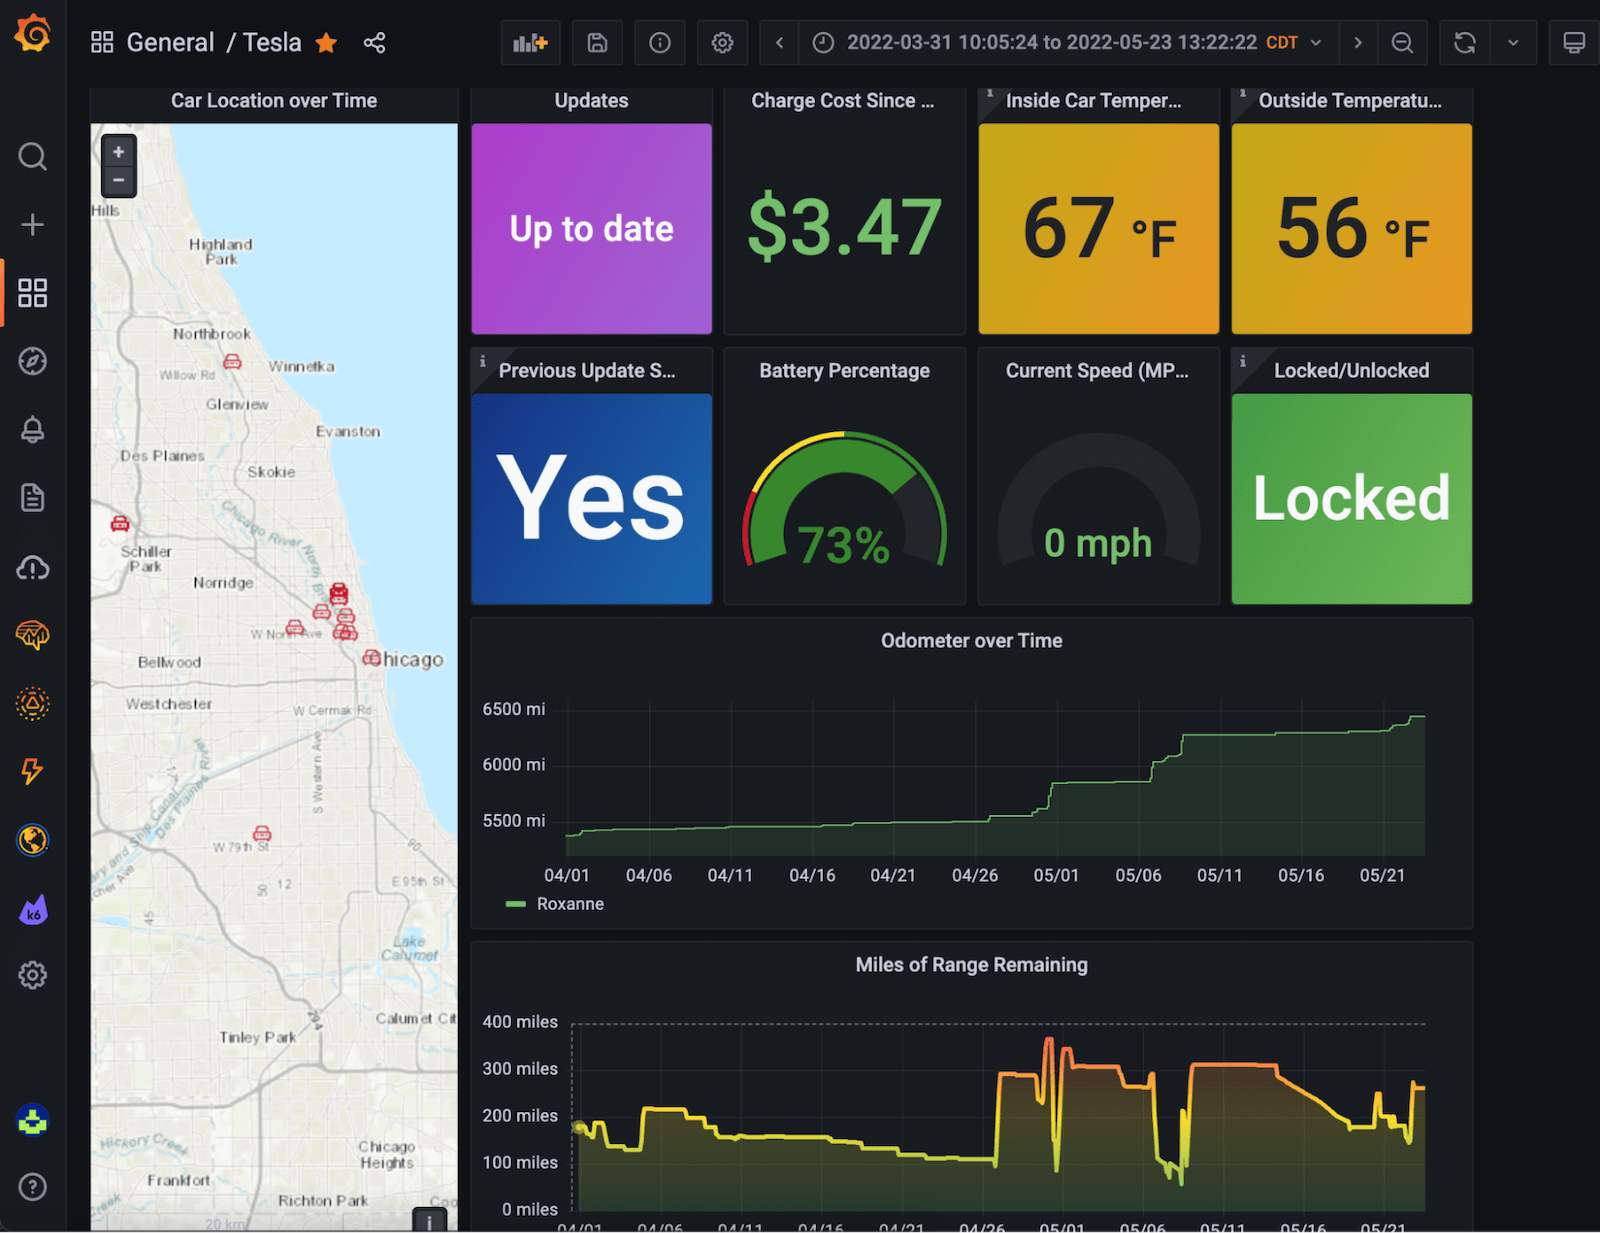
So what can you visualize with all of the data? I’m working on another blog that will focus on dashboarding some of this capability. Here’s a sneak peek!

Thank you for tuning in. If you have any questions feel free to reach out to me on Github (@stewam7), or on Twitter (@stew_grafana).
Grafana Cloud is the easiest way to get started with metrics, logs, traces, and dashboards. We have a generous free forever tier and plans for every use case. Sign up for free now!


