How to monitor an Umbrel server running a Bitcoin node with Grafana Cloud
Most people in the world are familiar with legal tender paper money — also known as fiat currency — and how to access it online through a bank website, ATM, or mobile app. The idea of “digital money” or cryptocurrency — such as Bitcoin — remains a relatively new concept. One thing that sets it apart from fiat currency is that its compute infrastructure is distributed in a trustless peer-to-peer network of server nodes run by businesses and everyday individuals alike.
Crypto and fiat currency have a major need in common: The servers supporting their networks must be secure, reliable, and up-to-date so that transactions can occur at any time.
A popular tool among Bitcoin enthusiasts is Umbrel, a personal server that can be run out of a home and lets users run their own node. With Grafana Cloud, Graphite, and Python, it’s possible to monitor an Umbrel server’s storage, memory, and temperature metrics so that your node is always online and readily available to transact.
Below, I’m going to walk through how to do that, but first I want to explain a little more about Bitcoin basics.
Money matters
One hundred years ago, a person would typically make an exchange using coins or paper money in person; today, transfers often take place electronically on computers. Virtual exchanges have become even more common during the last 10 years, with digital money becoming increasingly defined by decentralized networks of computers that audit the crypto supply and transactions.
When a person uses a traditional fiat currency via digital means, they must trust and utilize the servers from a private bank. In these conventional scenarios, banks deploy their own computers to keep a tally of all their customer account balances and transactions. In the end, customers don’t have access to the servers behind it all.
With digital money, on the other hand, each network server node is an equal participant that can verify the participation of any activity on the network, and the burden of running an individual node is lightweight. A Bitcoin node can operate successfully on typical consumer hardware, such as a personal laptop or Raspberry Pi.
Now on to the setup . . .
Connecting Umbrel to Grafana Cloud
The following instructions assume that you are running an Umbrel server on a Raspberry Pi 4 running Debian.
By the end of this tutorial you should be able to send memory, storage, and temperature metrics from Umbrel to Grafana Cloud’s Graphite metrics backend.
Instructions
Step 1: SSH into your Umbrel server to access the server’s file system:
ssh umbrel@<lan-ip-of-your-umbrel-server>
Step 2: Create a new folder for your Grafana monitoring script:
mkdir grafana
Step 3: Navigate to your new folder:
cd grafana
Step 4: Create a new python file for executing fetching your node’s metrics:
touch umbrel-metrics.py
Step 5: Install dependencies for editing and running the python script:
sudo apt install vim
sudo apt-get install python-requests
sudo apt-get install python-json
Step 6: Copy and paste the following script into the python file:
vim umbrel-metrics.py
# Import necessary libraries
import requests
import json
import time

# Initialize metric variables
int_metric_timestamp_seconds = int(time.time())
int_metric_interval_seconds = 600
float_metric_memory_value = 0
float_metric_storage_value = 0
float_metric_temperature_value = 0

# Read metric values
with open('/home/umbrel/umbrel/statuses/memory-status.json') as status:
    json_status = json.load(status)
    int_metric_memory_value = float(json_status['used'])

with open('/home/umbrel/umbrel/statuses/storage-status.json') as status:
    json_status = json.load(status)
    int_metric_storage_value = float(json_status['used'])

with open('/home/umbrel/umbrel/statuses/temperature-status.json') as status:
    int_metric_temperature_value = float(status.read().rstrip())

# Prep metric data
array_metrics = [['umbrel.memory',int_metric_memory_value],
                 ['umbrel.storage',int_metric_storage_value],
                 ['umbrel.temperature',int_metric_temperature_value]]
array_request_data = []

for metric in array_metrics:
  metric_data = {
     "name": metric[0],
     "interval": int_metric_interval_seconds,
     "value": metric[1],
     "time": int_metric_timestamp_seconds
  }
  array_request_data.append(metric_data)

json_request_data = json.dumps(array_request_data)
string_request_data = str(json_request_data)

# Emit HTTP POST request to Grafana Cloud
request_headers = {
  'Content-Type': 'application/json',
  'Authorization': 'Bearer <grafana-instance-id>:<api-key>'
}

string_request_url = '<grafana-cloud-endpoint>/graphite/metrics'

try:
  response = requests.post(string_request_url,
                           headers = request_headers,
                           data = string_request_data)
  response.raise_for_status()
except requests.exceptions.HTTPError as error:
  print(error)
Before you run the script, make sure to replace the Grafana Cloud Graphite metrics endpoint and the header Authorization values.
The script fetches the latest memory, storage, and temperature values from your Umbrel server and sends the data to Grafana Cloud’s hosted Graphite service.
Step 7: Edit your Raspberry Pi’s crontab config to send metrics every 10 minutes to Grafana Cloud:
vim crontab -e
\*/10 \* \* \* * cd /home/umbrel/grafana && python umbrel-metrics.py
Step 8: Explore your Umbrel server metrics using your Grafana Cloud instance. Visit the Explore page by clicking the Explore icon or navigating to the /explore path in your browser.
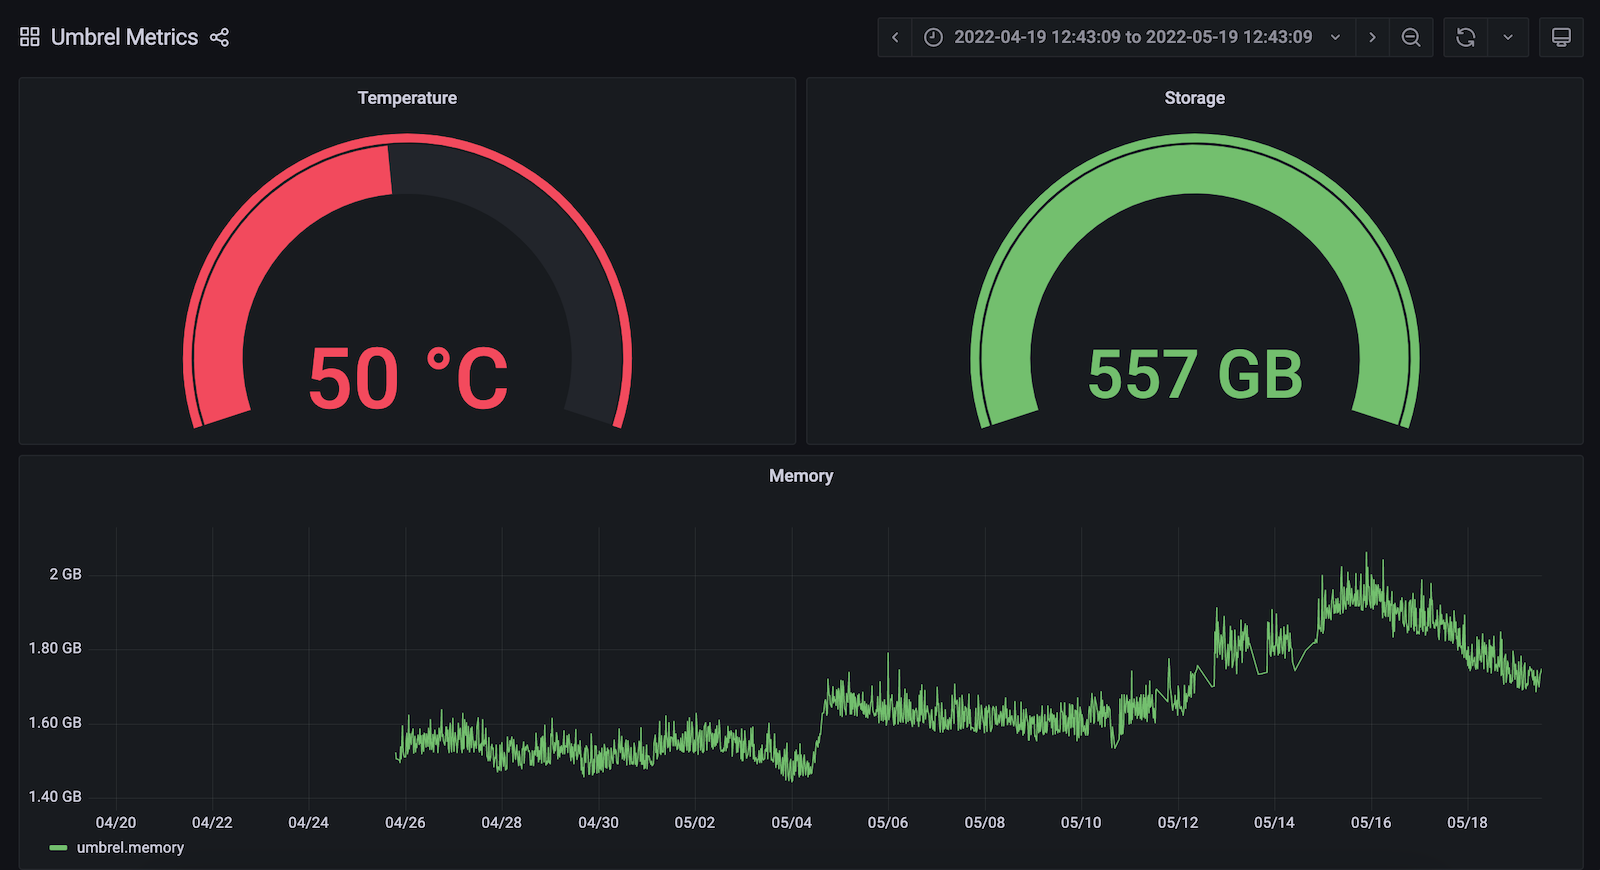
Here is an example of a dashboard showing temperature, storage, and memory metrics.

And that’s it! You can take things to the next level by creating custom dashboards, adding new metrics or alerts, inviting friends and family to visualize activity from your server, and much more. Enjoy!
Grafana Cloud is the easiest way to get started with metrics, logs, traces, and dashboards. We have a generous free forever tier and plans for every use case. Sign up for free now!


