
New in Grafana 8.5: How to jump from traces to Splunk logs
The recent release of Grafana 8.5 marks the start of enabling the jump from traces directly to Splunk logs. It’s a big leap that now allows you to draw a straight line between your traces — whether they are coming from Tempo, Zipkin, or Jaeger — to even more third-party logging data, all from the comfort of your traces view. Previously, the Grafana trace to logs enablement included only Loki logs. But with the introduction of this new feature, the deep insights offered by Splunk logs are now one click away.
Why link from traces to Splunk logs?
Traces tell you that something happened, or more specifically, what part of your request path caused the error. But what if you were also empowered to connect the dots even further to understand why it happened as well? This feature helps you do just that, telling you why and when an incident happened. So, in combination, traces to logs is really powerful.
Grafana handles the task of sifting through your immense log data simply and powerfully by allowing you to filter logs by trace ID and/or by span ID, in addition to filtering by any other tags and metadata that may be contained in your logs.
This was a heavily requested feature from our customers whose data is deeply embedded with Splunk; and now those users can add to their all-in-one approach to working in Grafana.
For more information about the Splunk Enterprise plugin, which is available for customers with a Grafana Cloud account or with a Grafana Enterprise license, check out the Splunk solutions page or contact our team.
How to jump from traces to Splunk logs
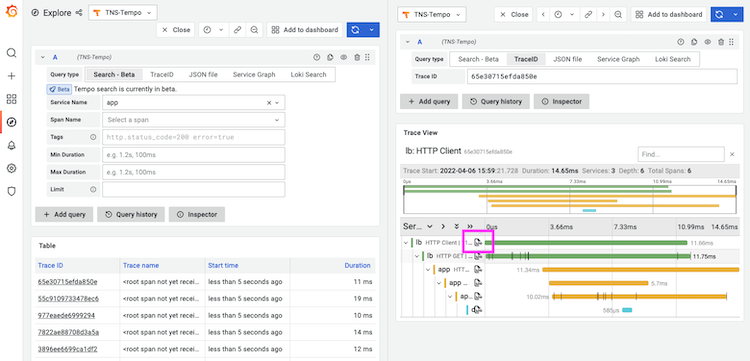
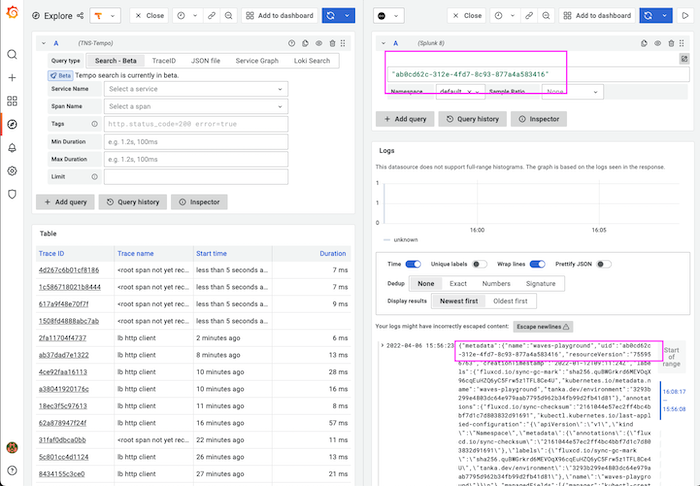
Much like the trace to logs feature for Loki, if trace to logs for Splunk is enabled in your data source (see Get started below), we will automatically generate a query link that, when clicked from the trace view, opens a Splunk tab in Grafana.
This query is offset by 1,000 milliseconds (or 1 second), which is required by Splunk in Grafana to create a valid query. This allows us to return results faster, but it also means that you may need to adjust the time range in the user interface to a longer interval to see relevant results (more details in the instructions below).
Just as with Loki logs, this traces to Splunk logs functionality is reflected in the URL, allowing the ability to save and share queries.
Get started
If you already have one of the tracing systems installed and your Splunk data source configured, all you have to do is the following:
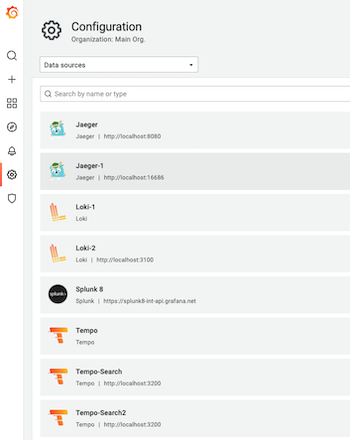
- Go to Configuration and choose your Trace data source.
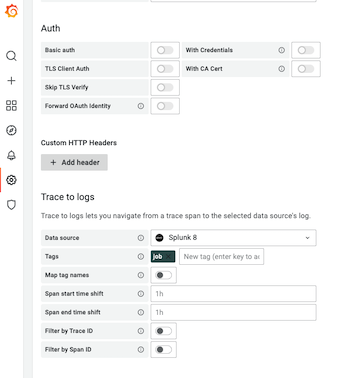
- From your traces settings page, locate the Trace to logs section. From the Data source dropdown menu, select your configured Splunk data source. Add any tags contained in your data (e.g.,
jobas shown here), toggle the filter by trace ID and/or span ID feature if desired, and change any other settings you would like to here. Then click Save & test.
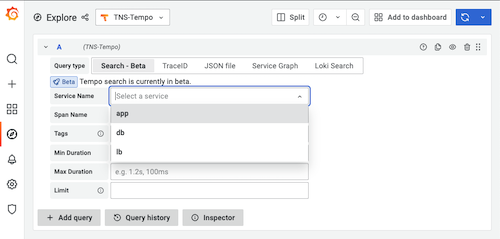
- Then, from Explore, select Service name, then run the query to see trace views.
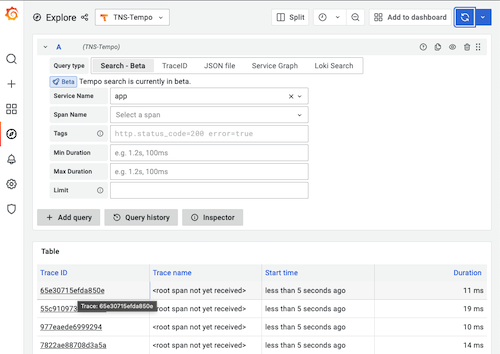
- Click the Log link icon from your trace view.
- If you have any metadata that you’d like to search for that is contained in the
_rawcolumn of Splunk logs (e.g.color=white), you can query those key-value pairs directly in the query search section, or just search for specific strings in the data. Be sure to adjust the time range to get your desired data.
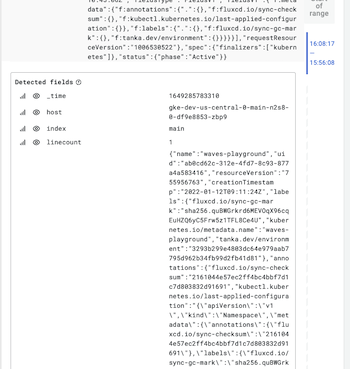
- Depending on the Select fields you set up in Splunk, they will appear as the Detected fields in the trace to logs view in Grafana; and you can query those directly by key and/or by value. The default fields
host,source, andsourceTypeappear in every log event.
Happy trace to logging!
To learn more about the latest features in Grafana 8.5, you can also check out our What’s new in Grafana 8.5 documentation.
If you’re not already using Grafana Cloud — the easiest way to get started with observability — sign up now for a free 14-day trial of Grafana Cloud Pro, with unlimited metrics, logs, traces, and users, long-term retention, and access to one Enterprise plugin.


