Monitoring next-generation maritime vessels at Royal IHC with Grafana Cloud
With a storied past in Dutch maritime history, Royal IHC is known for delivering reliable, integrated solutions for their customers. These clients rely on sophisticated vessels to create new ports, maintain navigable waters, clean up pollution, and slow shoreline erosion through the process of dredging, which involves removing sediment and debris from the water.
Each dredging vessel comes equipped with anywhere from 200-500 sensors generating data on performance, speed, environmental readings, and more. A typical dredging fleet might include several ships, which adds up to more than 1,000 sensors generating data the moment they are put to sea.
Dredging up a modern maritime monitoring solution
As a Royal IHC project leader who consults on dredging solutions, Guus Derksen was looking to offer his clients a more efficient, helpful strategy for monitoring their equipment. Because dredging fleets are often working near shorelines and on specific time constraints, keeping track of the location, condition, and performance of each vessel helps the companies make sure that projects can continue safely, all while meeting time and budget constraints.
Derksen’s team experimented with a number of options ranging from Python to Excel, but none of them provided the freedom the team wanted. They were looking for a solution that would provide greater flexibility for integrating various data sources, support custom visualizations, and ensure secure access for a variety of clients at a more cost-effective price point.
Getting started with Grafana OSS
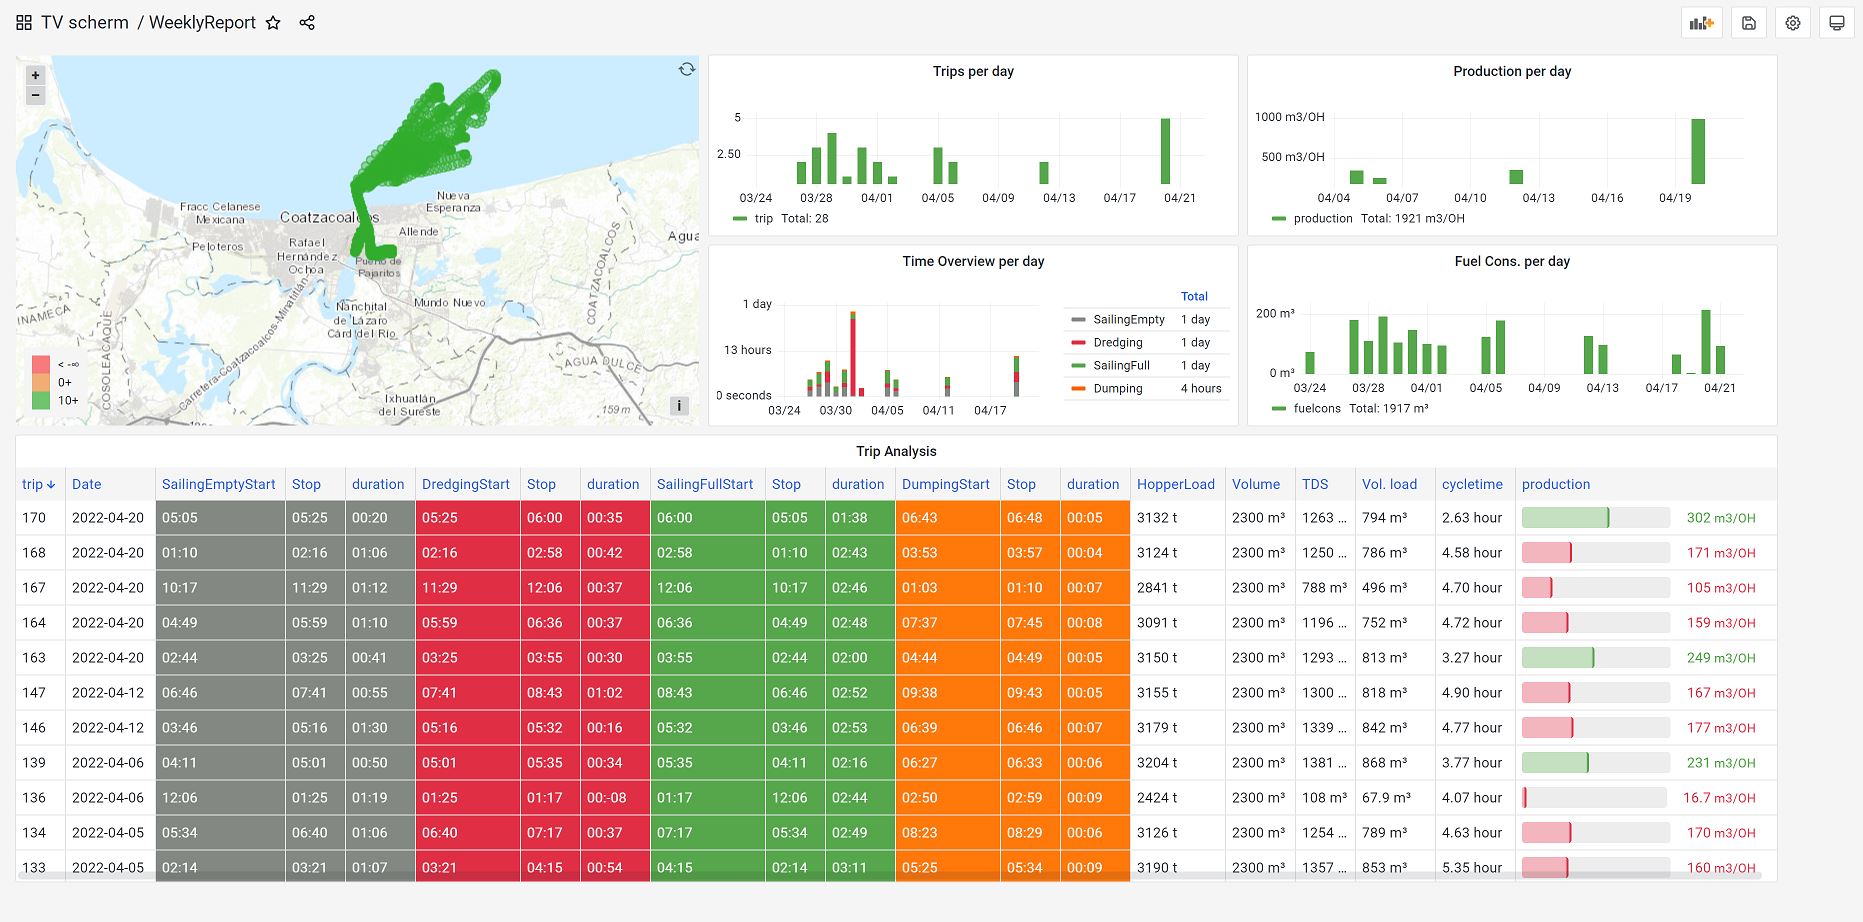
That’s when Derksen’s team tried visualizing their data with the OSS version of Grafana. The team quickly created dashboards that showcased important metrics like performance, fuel, and even environment statistics – temperature, wave height, and wind speed.

A sample Grafana dashboard showcases key performance metrics like production, fuel consumption, service hours, atmospheric conditions, and alarm status.
Each Grafana dashboard provides a high-level view of a fleet with the option to drill down into more specific data. It’s a comprehensive monitoring page for each fleet of vessels, complete with an overview of parameter sets to compare them and options to monitor different types of equipment.
Now, Royal IHC’s clients get up-to-the-minute information that helps them make decisions faster. If weather conditions are trending negatively, a client can quickly plan their next move for that vessel. And if dredging output or performance is not tracking as expected, issues can be addressed right away.
“With Grafana, we’re able to present vessel performance and status information much more effectively for our clients,” said Derksen. “It’s a huge improvement over legacy solutions and an advantage for Royal IHC to be able to offer such a cutting-edge approach to vessel monitoring.”
Transitioning from OSS to Grafana Cloud
Derksen’s team soon moved to the Grafana Cloud Advanced plan to take advantage of its built-in access and security features. Now, they can provide secure access and dashboards for multiple clients at once. Derksen said, “I’m Dutch, and I’m honest. If I wasn’t happy to share how beneficial Grafana has been for us, I wouldn’t be here talking about it today.”
Learn more about the dashboards Derksen’s team maintains for their clients and hear what’s next for Royal IHC’s observability journey in the full Grafana success story.
Grafana Cloud is the easiest way to get started with metrics, logs, traces, and dashboards. We have a generous free forever tier and plans for every use case. Sign up for free now!


