How Theia Scientific and Volkov Labs use Grafana and AI to analyze scientific images
Dr. Christopher Field is Co-Founder, President, and Principal Investigator at Theia Scientific. With formal education in analytical chemistry and instrumentation, Chris has expertise in scientific hardware and software design, deploying embedded Linux devices for Internet of Things (IoT) and sensor fusion applications, and developing computer vision and image processing pipelines for cell analysis.
Mikhail Volkov is Founder/CEO at Volkov Labs, where they are developing open source and commercial custom plugins for Grafana.
Click-drag-click. Researchers, technicians, and engineers who use microscopes know that mouse operation well. This simple repetitive action can lead to significant outcomes: determining if a patient is sick, if a structural steel for power plants is flawed, or if a factory line is creating defective computer chips. The continuous clicking and dragging can take several seconds or hours, which is the benefit and curse of any quantitative digital microscopy workflow. We can assess the world around us, but it’s a repetitive and ultimately laborious process.
Recently, efforts have been made to transform digital microscopy workflows into a single click that unleashes an Artificial Intelligence (AI) algorithm. For materials science, it could be looking for flaws at the nanoscale, such as extra or missing material; for medical research, it could be finding a tumor cell in an MRI. It’s the same algorithm that helps autonomous vehicles find and quantify features in the blink of an eye. This work has demonstrated that human-like performance is achievable, but at the moment, there is no widely available solution that truly enables one-click AI analysis of scientific images — and none provide real-time quantification and visualization while running a microscope.
Theia Scientific (experts in edge computing architectures for scientific instrumentation, data analytics, and AI model development) and Volkov Labs (an agency specializing in custom plugin development for Grafana) have teamed up to change that. We have created the Theiascope™ platform, which includes an application specifically designed for AI-enhanced microscopy that makes real-time analysis on any digital microscope possible.
The application was initially prototyped as a standalone web application with tight integration between a simple website and REST API. It used a separate Grafana instance used for visualization and plotting. Constantly switching between two separate applications while doing experiments was inconvenient, so Theia Scientific migrated the AI model management and image acquisition interface into Grafana for a single interface with a better user experience (UX).

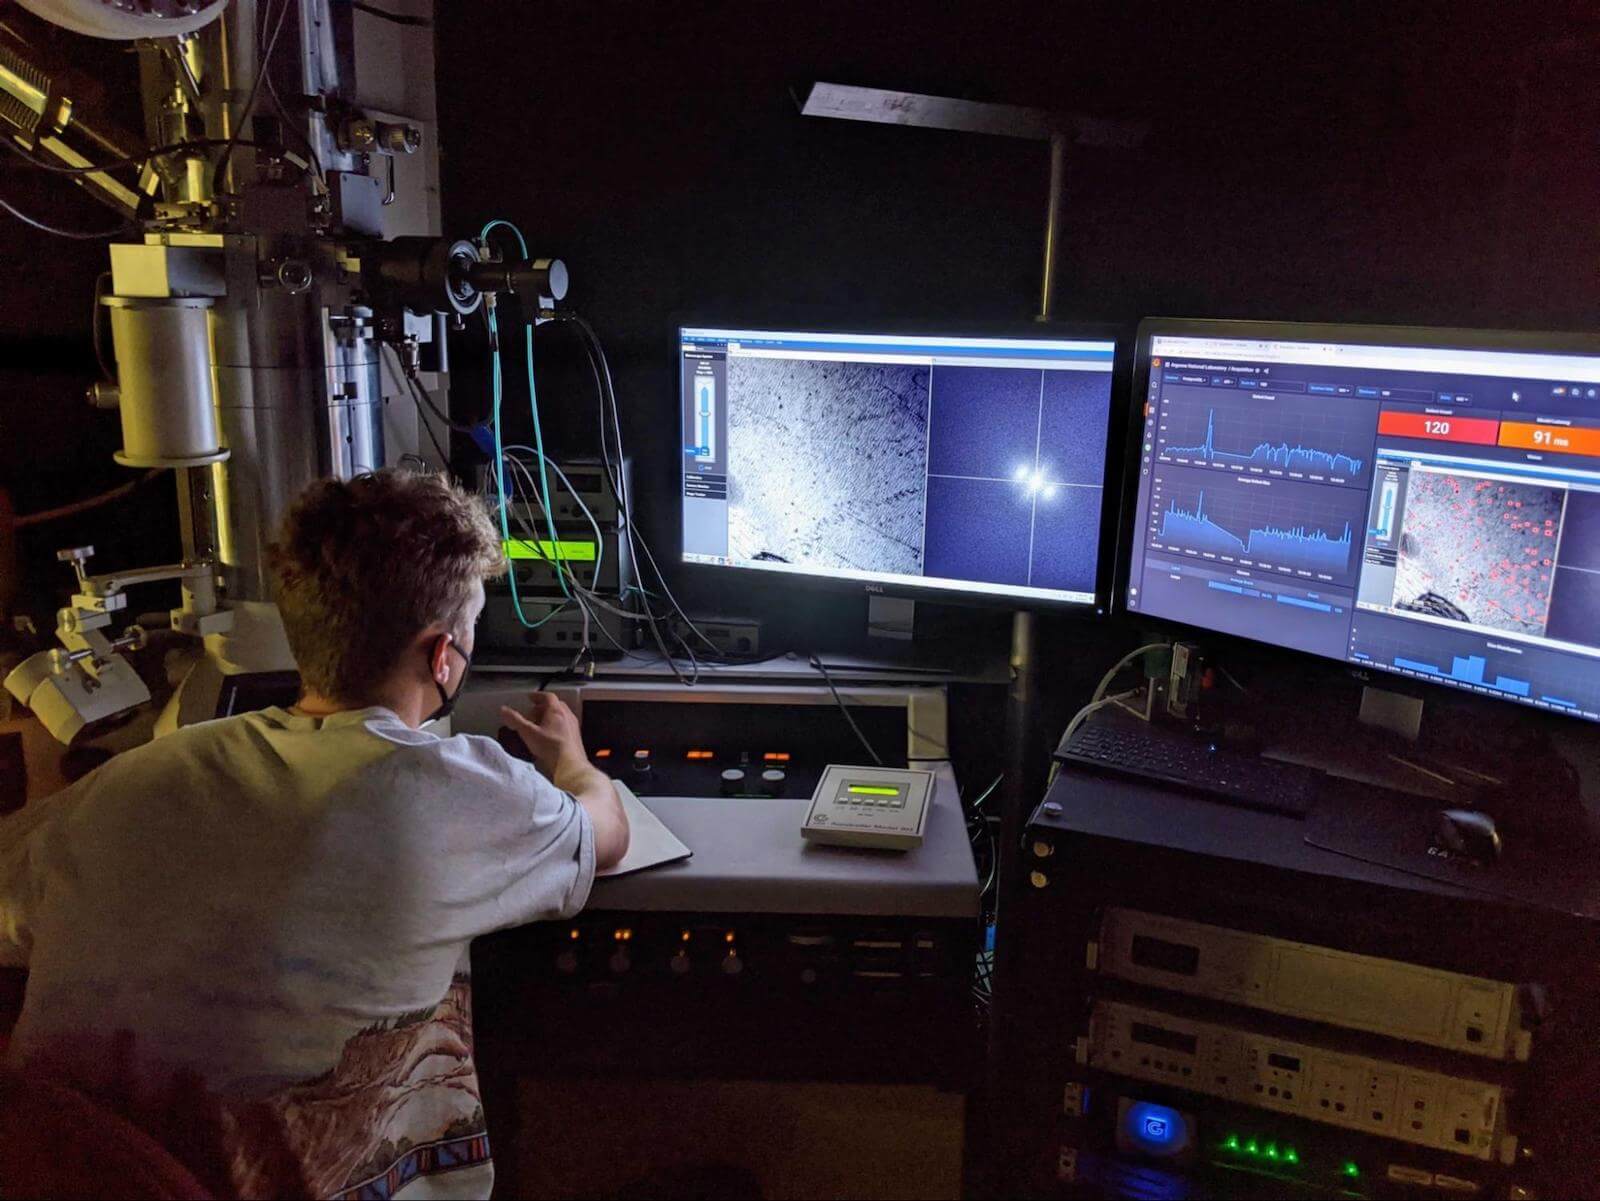
A University of Michigan microscopist during a site visit at Argonne National Laboratory’s IVEM facility using the electron microscope’s control software on the left monitor, and Theiascope™ platform for real-time image analysis and quantitation on the right monitor.
Solution architecture
The Theia application is based on the Grafana platform. It provides all required tools and components to interact with REST API and visualizes results in dashboard panels using custom plugins. To allow native Grafana dashboard customization, all components were separated into custom panels.
Images are acquired using various web protocols supported by all modern web browsers; individual frames are streamed into a PostgreSQL database. Then, a REST API is utilized to visualize both the acquired images and the AI-powered quantitation results within fully customizable dashboards. This powerful combination enables scientists and engineers using various forms of electron and optical digital microscopy to fully customize the UI on a per-user, per-microscope, and per-experiment basis.

Architecture diagram of the Theia Application plugin for Grafana.
The Theia application plugin created for the Grafana platform consists of the Theia API Data Source, which manages AI models (detection algorithms), acquires images, and performs AI-powered quantitation. It has five custom panels:
- The Acquisition Panel captures images from various sources and sends them to Theia API Data Source for processing.
- The Model Management Panel is used to upload, configure, and initiate various families and architectures of AI models, such as YOLO, UNet, and RCNN.
- The Navigation Panel is for reviewing and replaying scientific experiments.
- In the Vision Panel, users can see acquired images with AI-powered analysis and quantitation results.
- The Time Panel checks and adjusts time synchronization.
The application provides several dashboards, which are easily modified according to the user, microscope, and/or experiment.

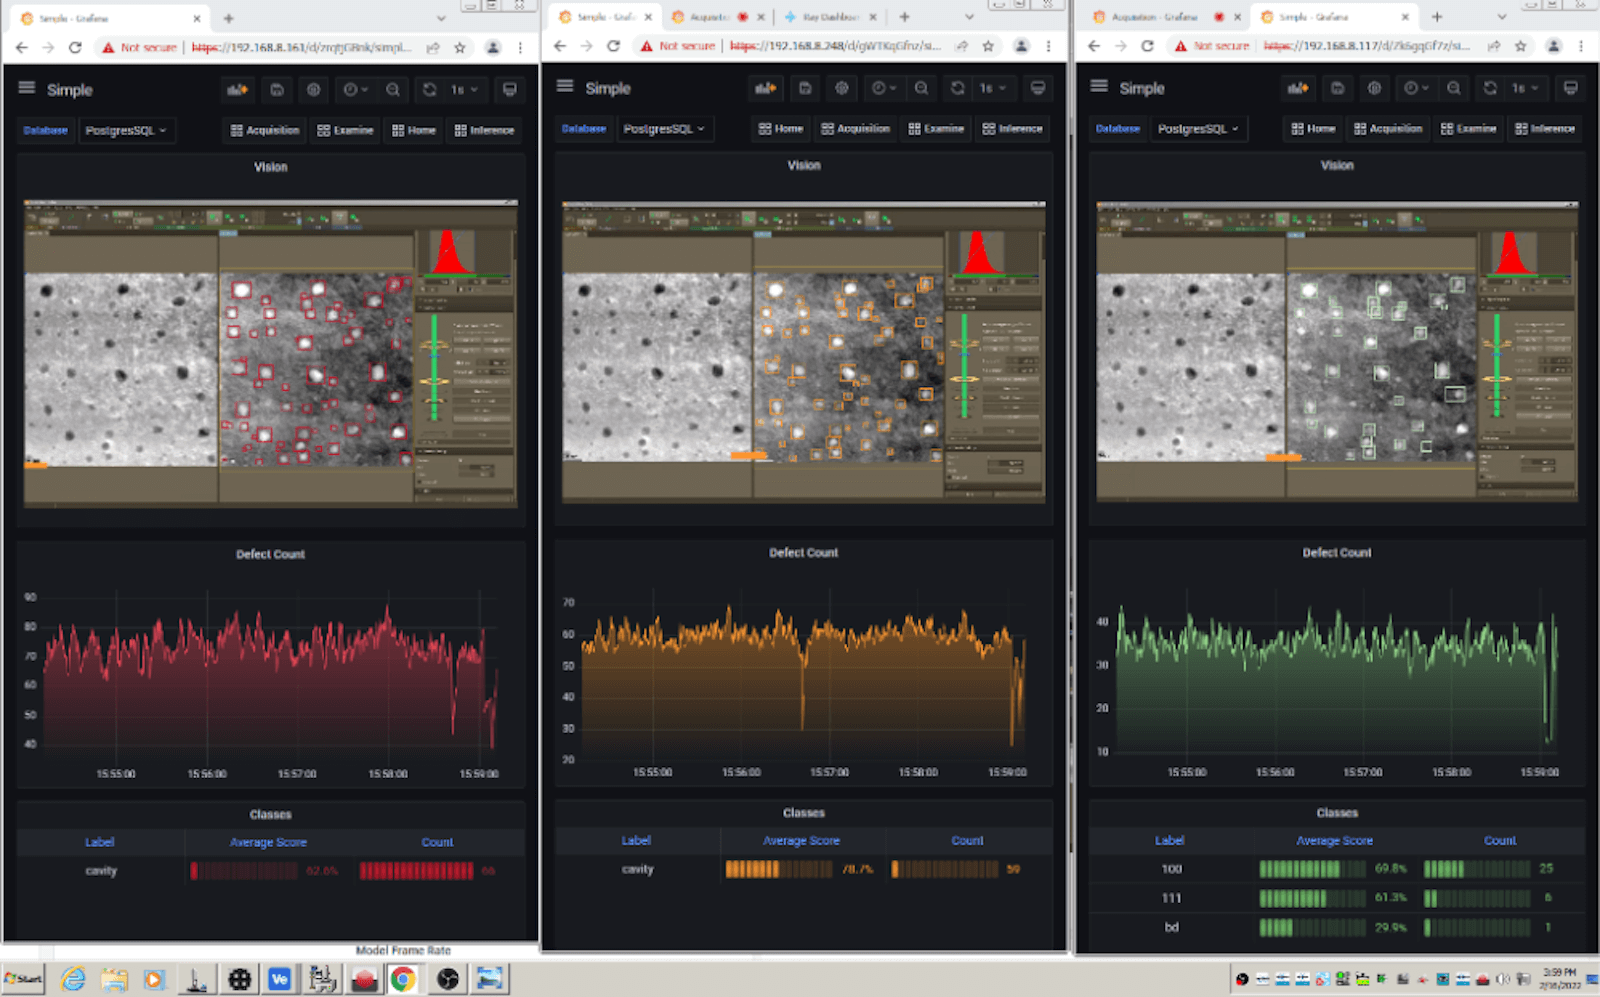
Grafana allows the creation of fully customizable dashboards using custom panels. Three different AI models are running simultaneously while operating an electron microscope. The results are color-coded specifically for the experiment and AI models by the user.
Most universities, national laboratories, and industrial environments have restricted internet connectivity with respect to scientific instrumentation and inspection equipment. As a result, all community panels and data sources were incorporated into the Theia application to avoid external connectivity issues.
The Theia application uses the following Grafana community plugins:
- Calendar plugin to see the book of experiments for the current month.
- Environment Data Source to retrieve environment variables from the run-time environment.

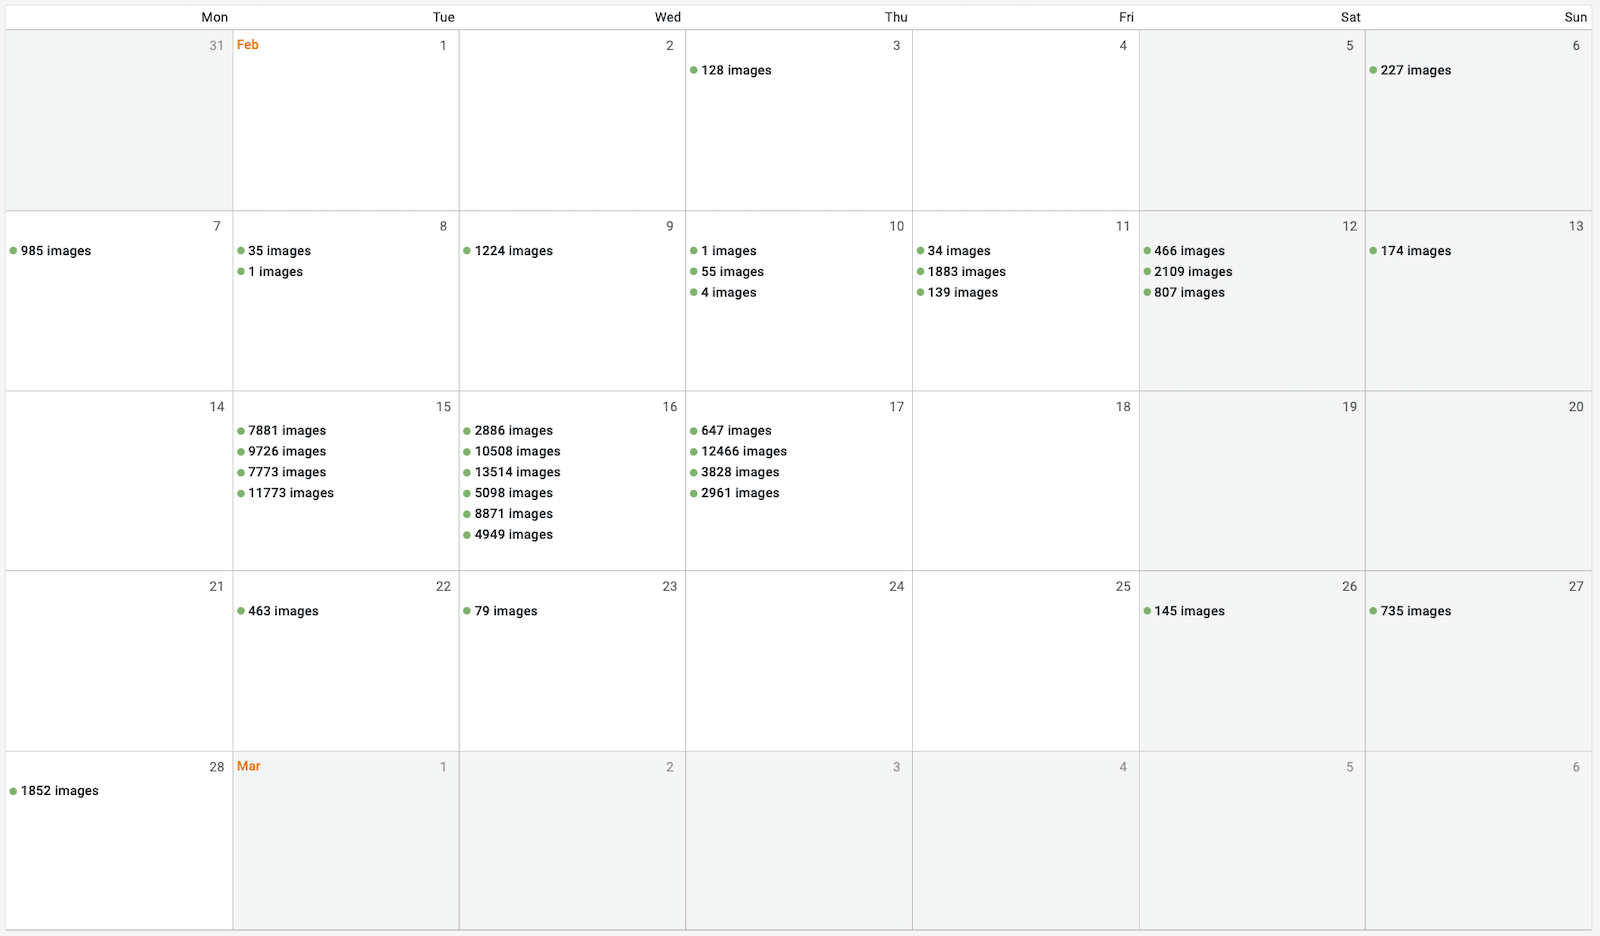
The home page with the Calendar panel allows viewing the individual microscopy sessions that used the Theia application for the current month.
Power of the panels
Here is a further breakdown of how Theia’s Grafana panels work and what users can monitor and observe using them.
Model Management and Acquisition
In the Model Management panel, a user can add AI model configuration files and create model run-time environments based on the added and stored configuration files. The panel uses the Theia API Data Source interacting with REST API to load the model onto a device’s Graphical Processing Unit (GPU) for hardware-accelerated image analysis and quantitation. After the model is loaded onto the GPU, it can be used to capture experimental data and obtain quantitative results while running any digital microscope.
When the model is selected, the user gains access to an acquisition dashboard with buttons to start the acquisition process and stream images to the AI model running on the GPU. Several parameters and controls are provided in the Acquisition panel, such as selecting a Field of View (FOV) and positioning a scale bar for translating pixel measurements into engineering units.
There’s supposed to be a video here, but for some reason there isn’t. Either we entered the id wrong (oops!), or Vimeo is down. If it’s the latter, we’d expect they’ll be back up and running soon. In the meantime, check out our blog!
An animation demonstrating AI model initiation and starting image acquisition with the Grafana-based Theia web application running the Theiascope™ platform for general object detection and image quantitation.
The Model Management panel allows users to manage simultaneous AI models by switching between each model for smooth image acquisition. The results can be shared on remote displays, such as a TV, office computer, or even a mobile device like a tablet or smartphone.

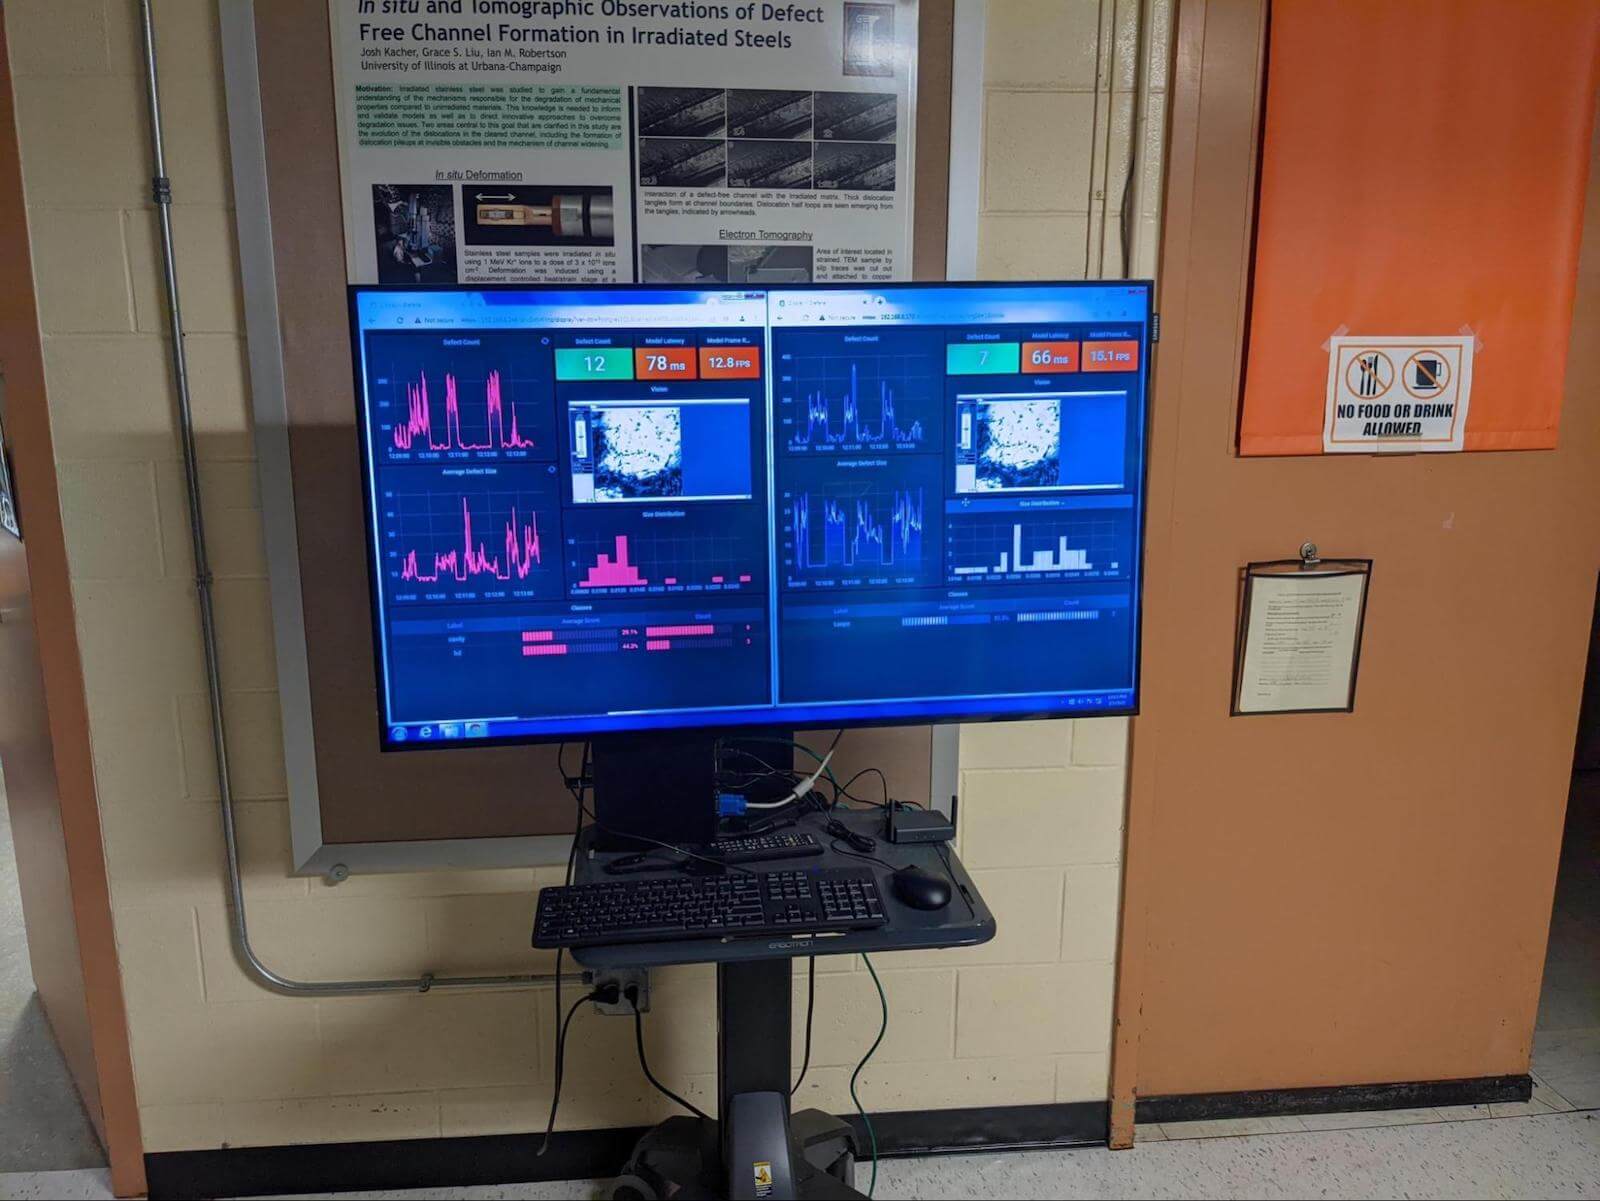
Live results of a scientific experiment from two AI models were viewed on a remote display while microscopists operated the electron microscope at Argonne National Laboratory.
Vision and Navigation Panels
These two panels were developed to review and replay scientific experiments. In the Vision panel, users view the captured images and visualize the AI-powered analysis results as bounding boxes overlaid onto the acquired image based on the selected model.
The Navigation panel provides a toolbar-like series of buttons that are similar to those on a video player. Users can review the previous, next, first, and last images with a start/pause playback button and play through the selected time interval at different speeds (which can be adjusted in the panel’s options).
There’s supposed to be a video here, but for some reason there isn’t. Either we entered the id wrong (oops!), or Vimeo is down. If it’s the latter, we’d expect they’ll be back up and running soon. In the meantime, check out our blog!
The Navigation Panel allows reviewing of defect growth for post-acquisition data analysis and scientific discovery.
Examining the challenges
During the development process, we encountered some challenges with distributed applications based on the Grafana platform.
To address the time synchronization issues with connected devices and unavailability of NTP server in a restricted environment, we created a special Time Synchronization panel. That made it possible to see the difference between an end-user browser and the system time on a GPU-powered edge computing device running the Theia application. We will improve the panel in future versions to allow adjustment of the system clock and time zone of the edge computing device.
Using Grafana for distributed and/or embedded applications is an uncommon use case. Because of that, the community hadn’t created some of the valuable components required for applications deployed on edge computing devices in network-constrained environments, such as the Theiascope platform. This was also an issue in the operating environment of research and development laboratories that use cutting-edge microscopes. One specific problem we encountered was that environment variables are not available for the dashboard to identify devices and see assigned parameters. To fill this gap, we created the Environment Data Source, which returns environment variables to display on your dashboard or use as variables to retrieve data.
The Theia application consists of multiple containers, which seamlessly work together. Some containers provide Prometheus metrics, but we would like to have a more detailed view of the running AI models and use resources to help our customers troubleshoot any issues that arise. We are working on creating additional data sources and will share them with the community when ready.
What’s next
The Theiascope™ technology and the Theia application based on the Grafana platform have been successfully tested in production environments at the University of Michigan, Idaho National Laboratory, and Argonne National Laboratory. Grafana’s simplicity allows users to feel comfortable doing experiments within minutes.
After the Theia prototype was designed, it took less than two months for the application to be created, which is the average time it takes to make a Minimum Valuable Product (MVP) application plugin for Grafana. We will continue to add new features to transition from an MVP to a full-featured platform that will be able to compete with legacy scientific data analysis desktop applications.
Acknowledgments
Those of us at Theia would like to thank the staff and personnel at the University of Michigan-Ann Arbor, Idaho National Laboratory, and the Argonne National Laboratory for hosting us during our site visits and technology demonstrations. Specifically, we would like to thank Lingfeng He and Laura Hawkins at Idaho National Laboratory, Wei-Ying Chen at Argonne National Laboratory, and Priyam Patki and Kai Sun at University of Michigan for working with us to run the Theiascope™ technology on their electron microscopes and the extensive user feedback. We would also like to thank graduate students, Kesley Green and Robert Renfrow, of the NOME Lab group at the University of Michigan-Ann Arbor for enabling the electron microscope experiments during the site visit at Argonne National Laboratory.
This material is based upon work supported by the U.S. Department of Energy, Office of Science, Office of Nuclear Energy under Award Number DE-SC0021936.
You can find out more about Theia at Field and Volkov’s GrafanaCONline 2022 session on June 15.
Learn more about all of the GrafanaCONline 2022 events — and register for free! — here.


