eCommerce giant Blinkit's journey from ELK Stack to Grafana Cloud
The promise: Order any groceries and essentials from Blinkit’s mobile app, and they’ll be delivered to your doorstep within 10 minutes.
The process: Very difficult with a legacy logging tool.
For Blinkit, the instant delivery service formerly known as Grofers that serves millions of consumers across India, their tech stack was beginning to interfere with business operations at a time when the company was hyperscaling due to its popularity.
The problem was that Blinkit’s existing logging tool, running on a self-managed version of the Elastic Stack, was getting in the way of developers improving the shopping experience for customers with additional and enhanced services.
Instead, “we were spending half of our time making sure everything was up and running with the ELK Stack and tuning our logs continuously so that we wouldn’t crash,” Blinkit Engineering Manager Viabhav Krishna says.
Choosing Grafana Loki for customer success
Krishna recognized that this was no way to operate a team, let alone a $1 billion-dollar business in a fiercely competitive landscape. After surveying a host of new alternatives, Krishna settled on adopting Grafana Loki because it was an open source tool that easily fit into their environment.
“Grafana Loki, our new log aggregation system, stores and allows us to query logs from all applications and throughout the infrastructure,” says Krishna. “It fits very well into our ecosystem.”
The team was already leveraging open source software, such as Grafana for its dashboarding and Prometheus, which streams about 1.5 million metrics per month in a Kubernetes environment on AWS. With the addition of Grafana Loki to their stack, Blinkit now feeds all its application logs into their Loki instance, which can total up to 60TB of log data every month.

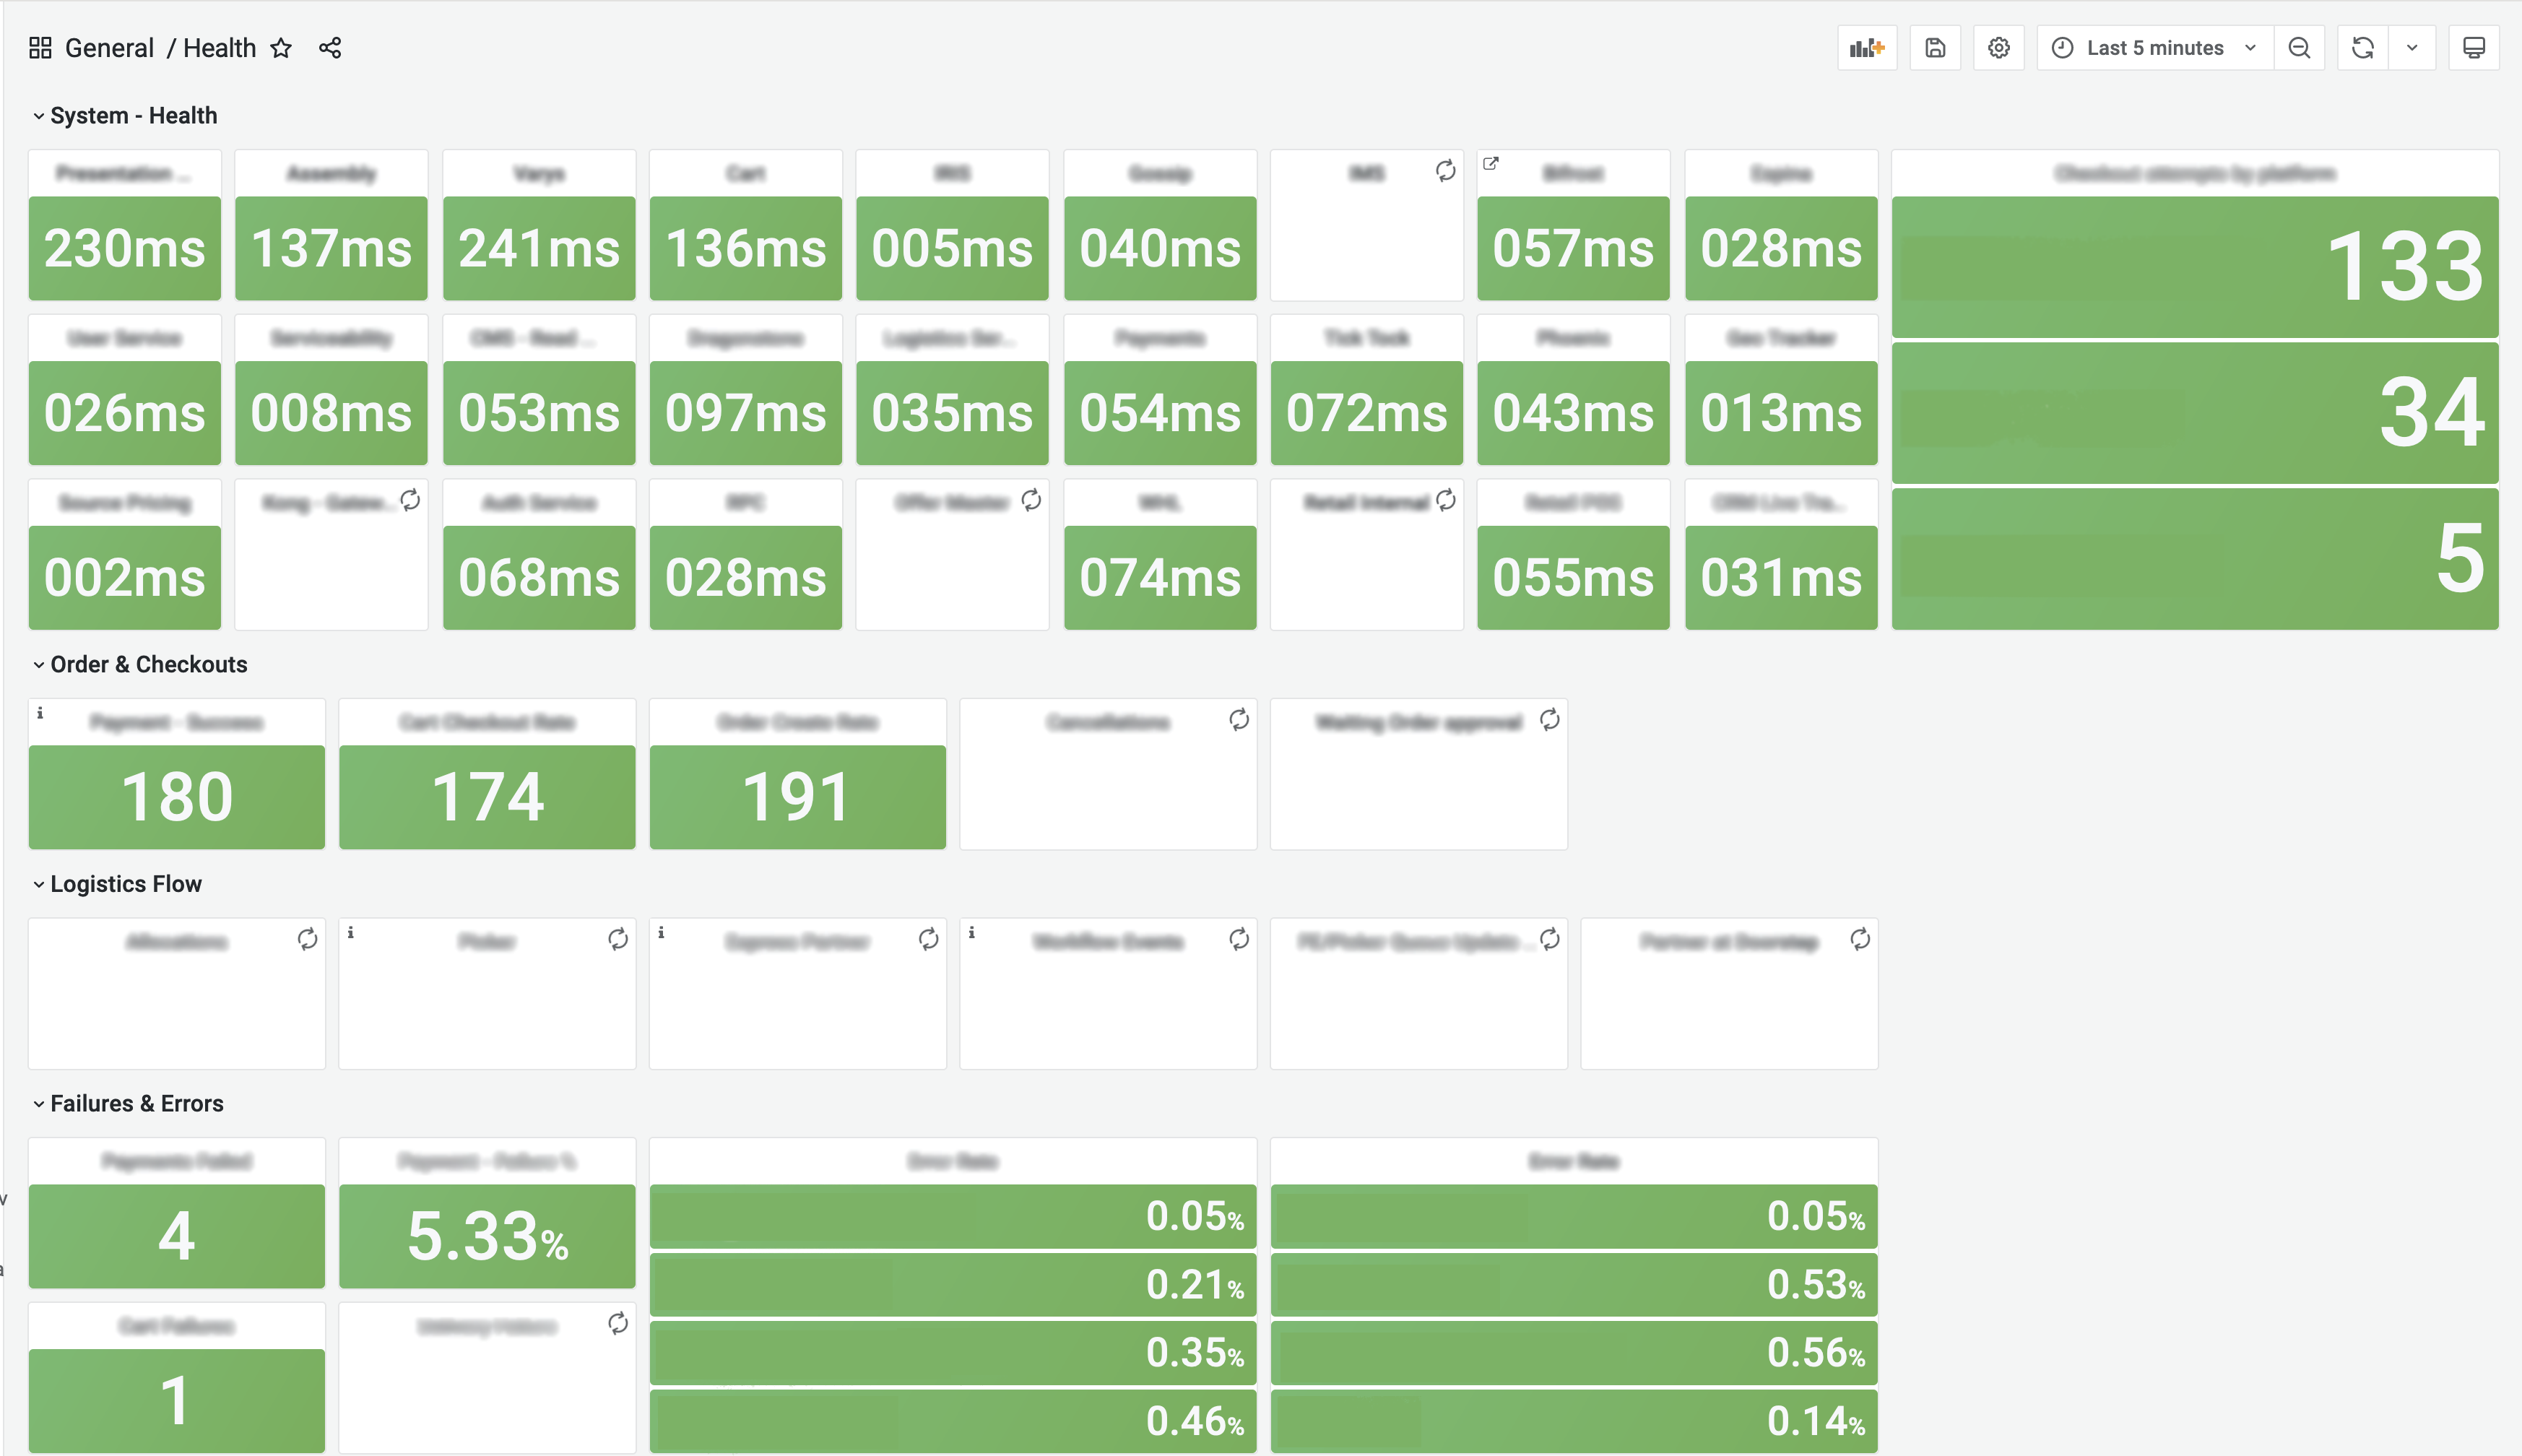
Above: Blinkit’s internal Grafana homepage with customized stat panels showcasing key production and application data.
Though the team started with a self-hosted Loki instance, they quickly realized they didn’t want to repeat previous mistakes. So — in addition to using InfluxDB and AWS CloudWatch for legacy systems — they quickly migrated over to the hosted Grafana Cloud Logs service, which now allows Blinkit to seamlessly integrate their metrics and logs in one place and use the comprehensive data in new, impactful ways.
“Between Loki and Grafana you can get your logs and metrics from your logs in one place,” says Krishna. “In certain use cases, Grafana Loki is the key monitoring tool, and we have started relying on Loki as one of our main metric sources as much as we do Prometheus.”
Now, Krishna’s team can focus more on product enhancements, and less on maintaining their logging environment. “We’re able to move faster because of Grafana,” Krishna says.
Winning with Grafana’s open source community
Krishna says the Grafana open source community and Grafana Labs were always available to help with issues, regardless of their complexity.
“We are very motivated by the open source component of Grafana,” Krishna says. “We love engaging with the community. It’s easy to tell that Grafana puts in a lot of effort to build and maintain a vibrant community. I think that’s cool.”
Blinkit has also developed an open source tool to contribute back to the community. The tool, called Legend, enables users to make Grafana dashboards, complete with pre-filled metrics and alerting. Krishna recently gave a deep explainer about Legend during Grafana Labs’ ObservabilityCon, which you can watch on demand.
Blinkit’s future looks bright with Grafana
Krishna says Blinkit is envisioning adding to the Grafana Stack with distributed tracing and Grafana Tempo. He’s also analyzing alerting and monitoring SLAs and SLOs with Grafana.
“Blinkit is excited about the future of Grafana Cloud, which we will continue to embrace as we scale to remain India’s leading instant delivery platform,” Krishna says.
Get all of the details on Blinkit’s migration to Grafana Cloud and see what else is in the works for their team in the full success story.
Grafana Cloud is the easiest way to get started with metrics, logs, traces, and dashboards. We have a generous free forever tier and plans for every use case. Sign up for free now!


