New in Grafana 8.5: updated panels, new RBAC features, simplified reporting, and more!
Grafana 8.5 is here!
We’ve worked on a variety of improvements that focus on Grafana’s usability, data visualization, and security. For a full list of new features and capabilities, check out our What’s New in Grafana 8.5 documentation.
You can get started with Grafana in minutes with Grafana Cloud. We have free and paid Grafana Cloud plans to suit every use case — sign up for free now.
Here’s a quick glance at some of the greatest hits of Grafana 8.5.
New in Grafana dashboards
Updated panels
Atom feeds in the News panel
In addition to RSS feeds, the News panel now supports Atom feeds, allowing you to display a wider range of data and information in Grafana.
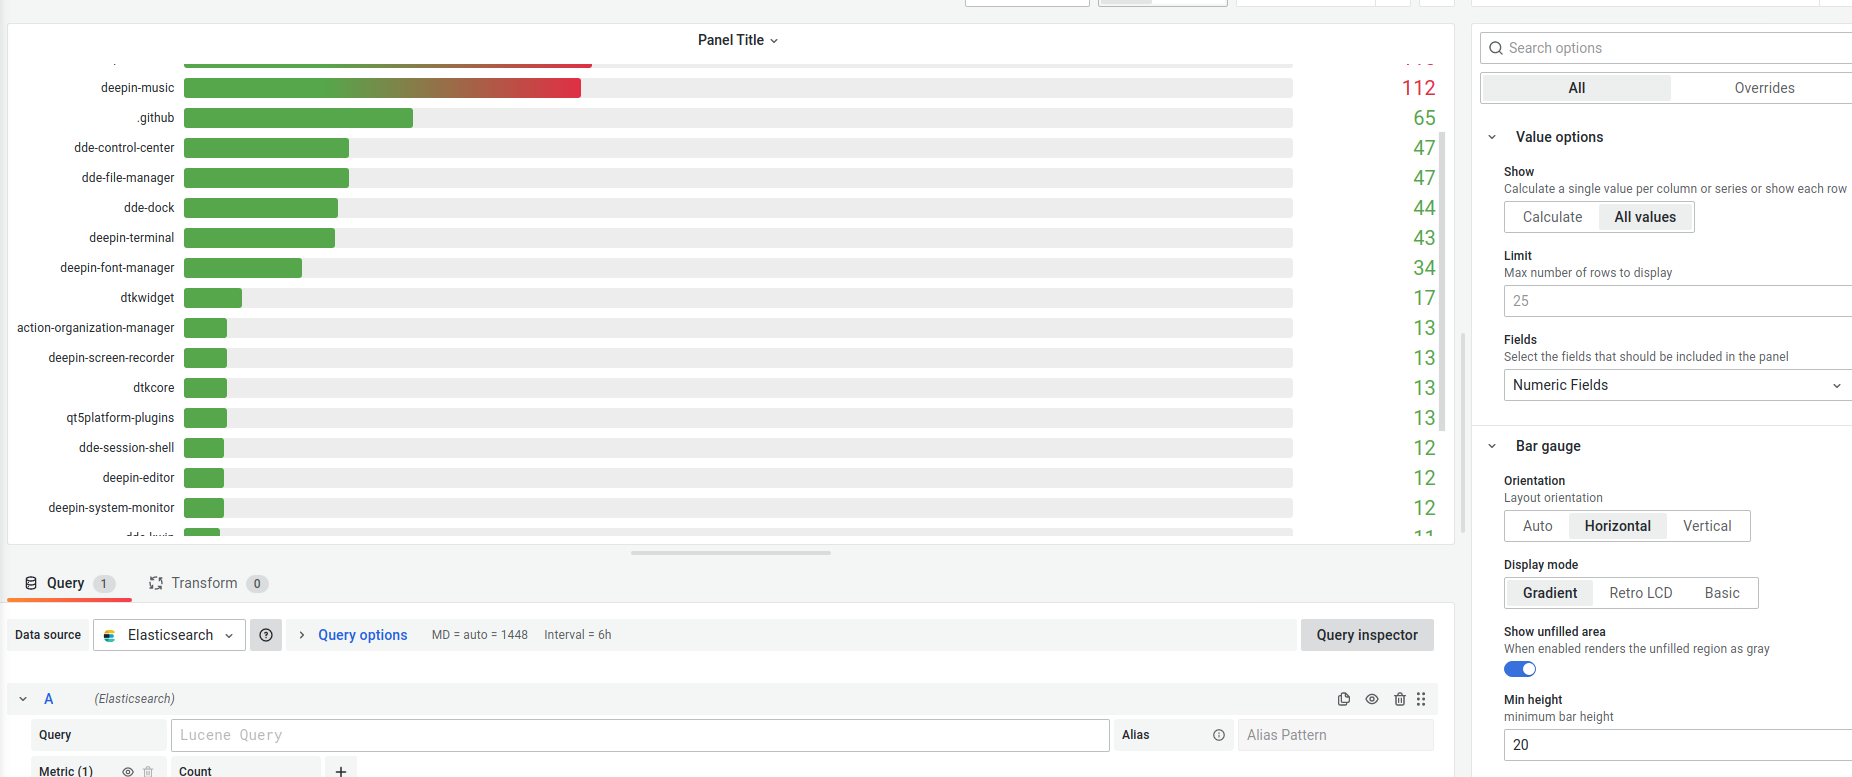
Scrolling in the bar gauge panel
The bar gauge panel in Grafana now supports scrolling to support displaying large data sets while maintaining the readability of labels. You can set a min width or height for the bars (depending on the chart’s orientation), allowing the content to overflow in the container and become scrollable.


Added transformations
Template variable substitution
We’ve added support to substitute template variables to transformations. This allows dashboards to be more interactive with transformations when a user inputs calculations and $__interval and $__interval_ms.
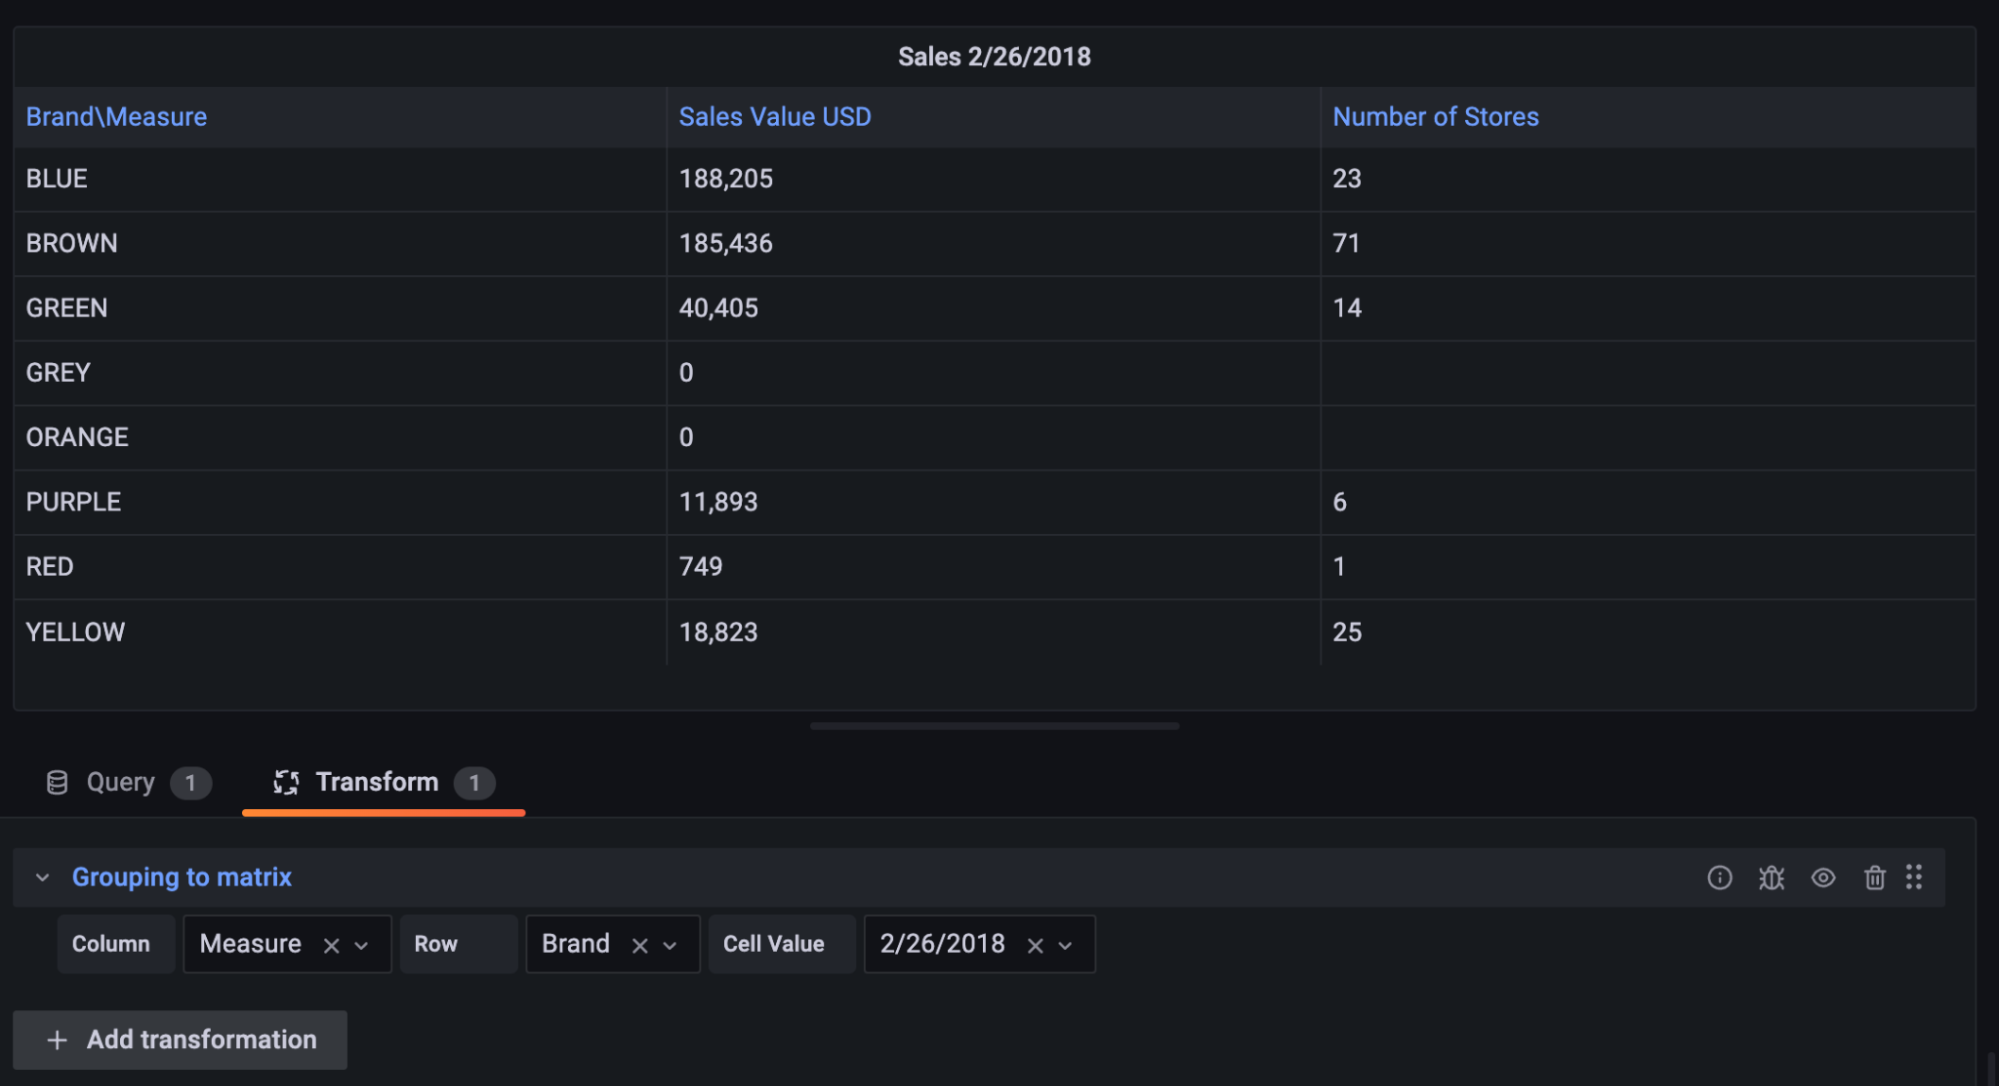
Grouping to matrix
A new transformation is available that helps you structure data in a matrix format using the Grafana table plugin.

Easy Explore to dashboard query workflow (beta)
In the past, when you would author queries in Explore and then add the ones you need to dashboards, getting the query into a dashboard was pretty painful. With Grafana 8.5, it can happen with one simple click of a button.
An Add to Dashboard button has been added to the Explore page. So now you can select a new or existing dashboard, and the queries are automatically added as new panels.
New in navigation
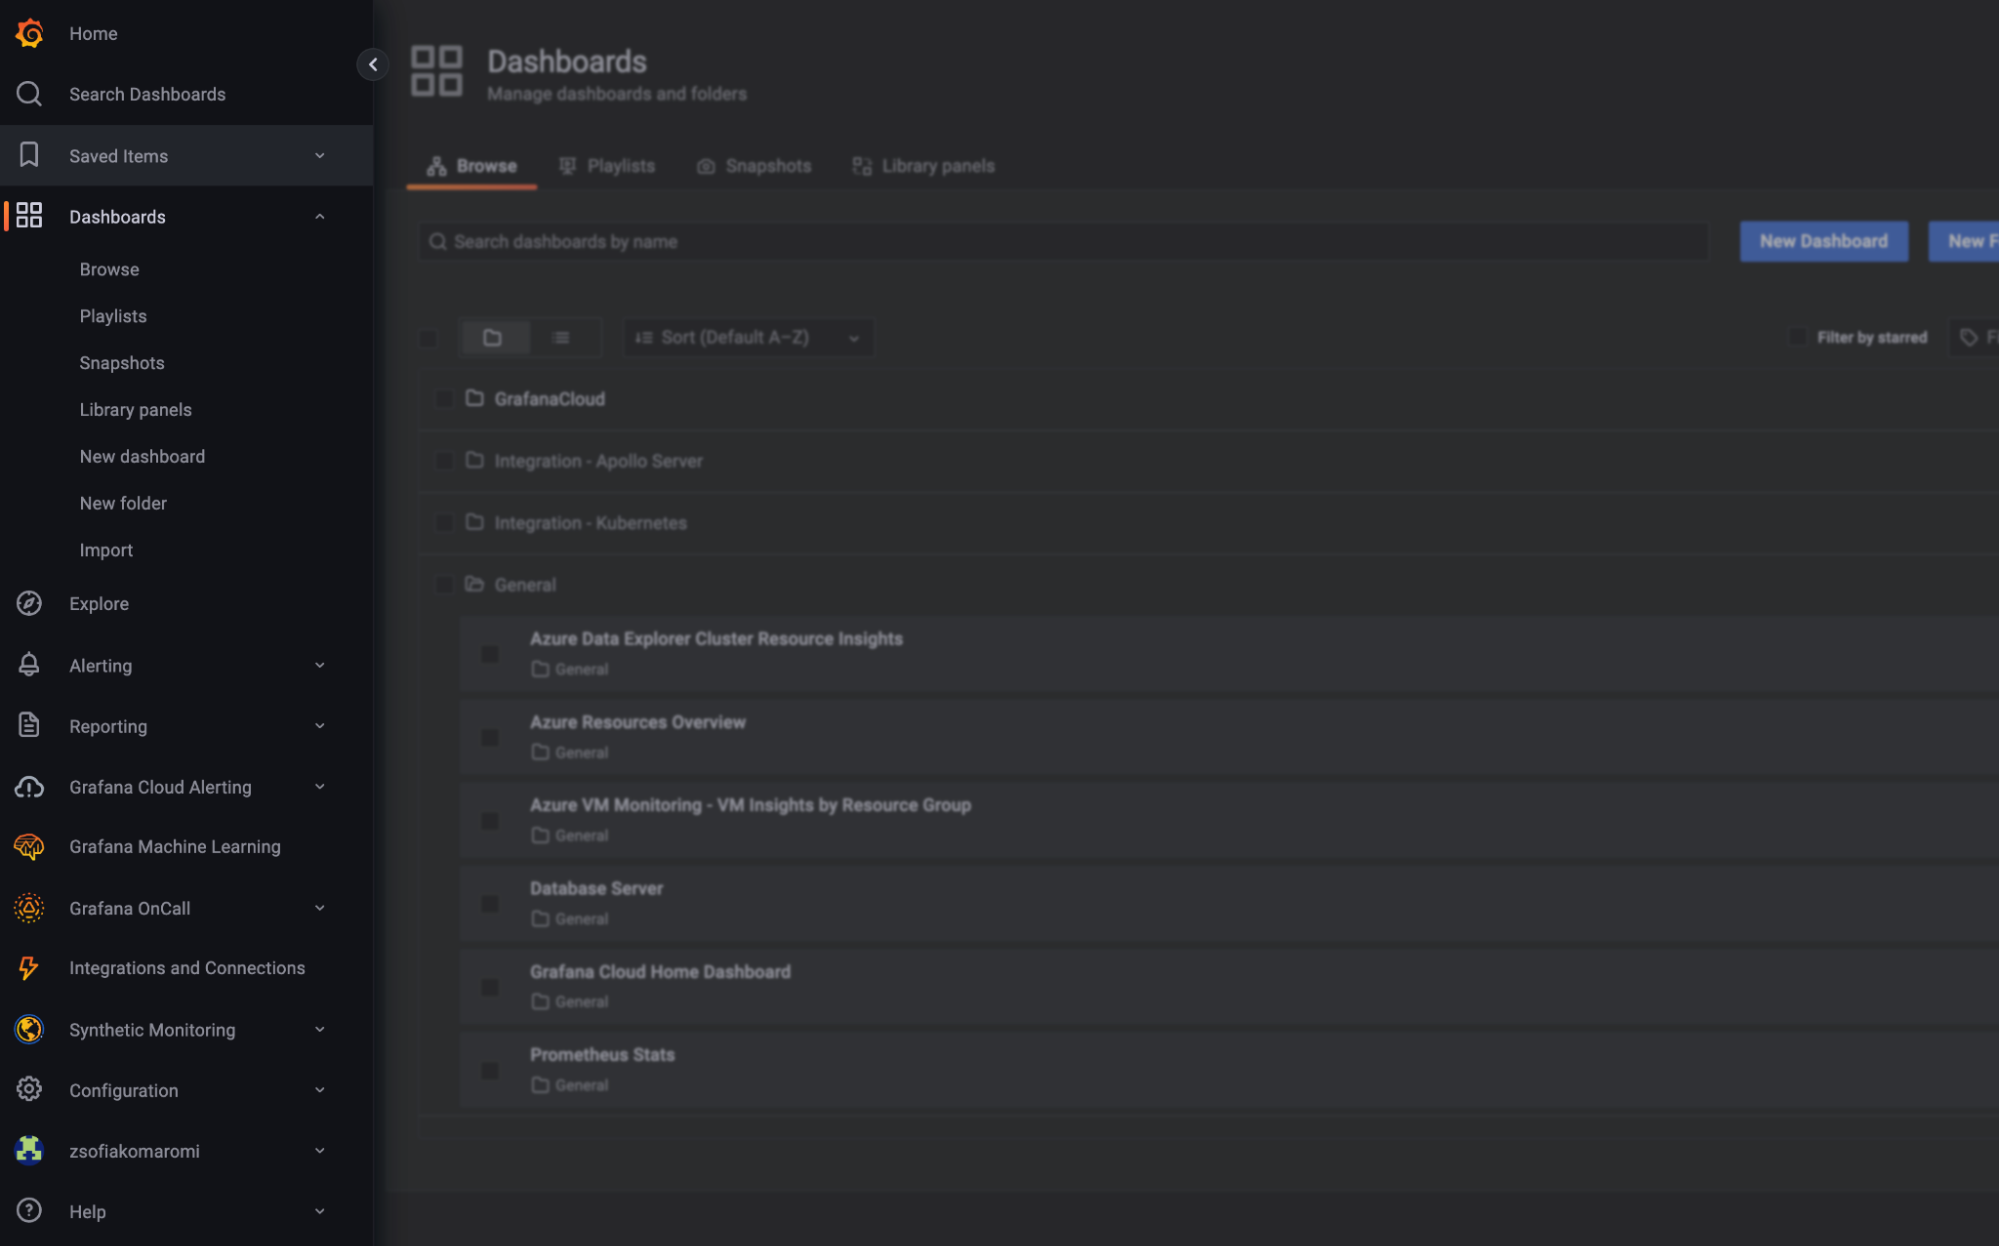
Expanded navigation menu (beta)
We’ve added a lot of functionality to Grafana over the past couple of years, and our navigation menu is evolving to accommodate it. The new expanded navigation menu makes it easier to find specific pages, so you can better take advantage of all that Grafana has to offer. Try it out by switching on the newNavigation feature toggle.
We would appreciate your feedback! You can sign up for a call with the Grafana team: If you are in the U.S., U.K., Canada, Australia, France, Germany, or South Africa, sign up here. Everywhere else in the world, sign up here.

New tracing functionality
Trace to Logs for Splunk
With Trace to Logs, you can view relevant logs for a trace or span with one click by linking to Splunk logs from your tracing data source. In your tracing data source, configure Trace to Logs by selecting the Splunk data source and relevant query options like tags to include in the query.
For more information about the Splunk plugin, which is available for customers with a Grafana Cloud account or with a Grafana Enterprise license, check out the Splunk plugin page or contact our team.
New in alerting
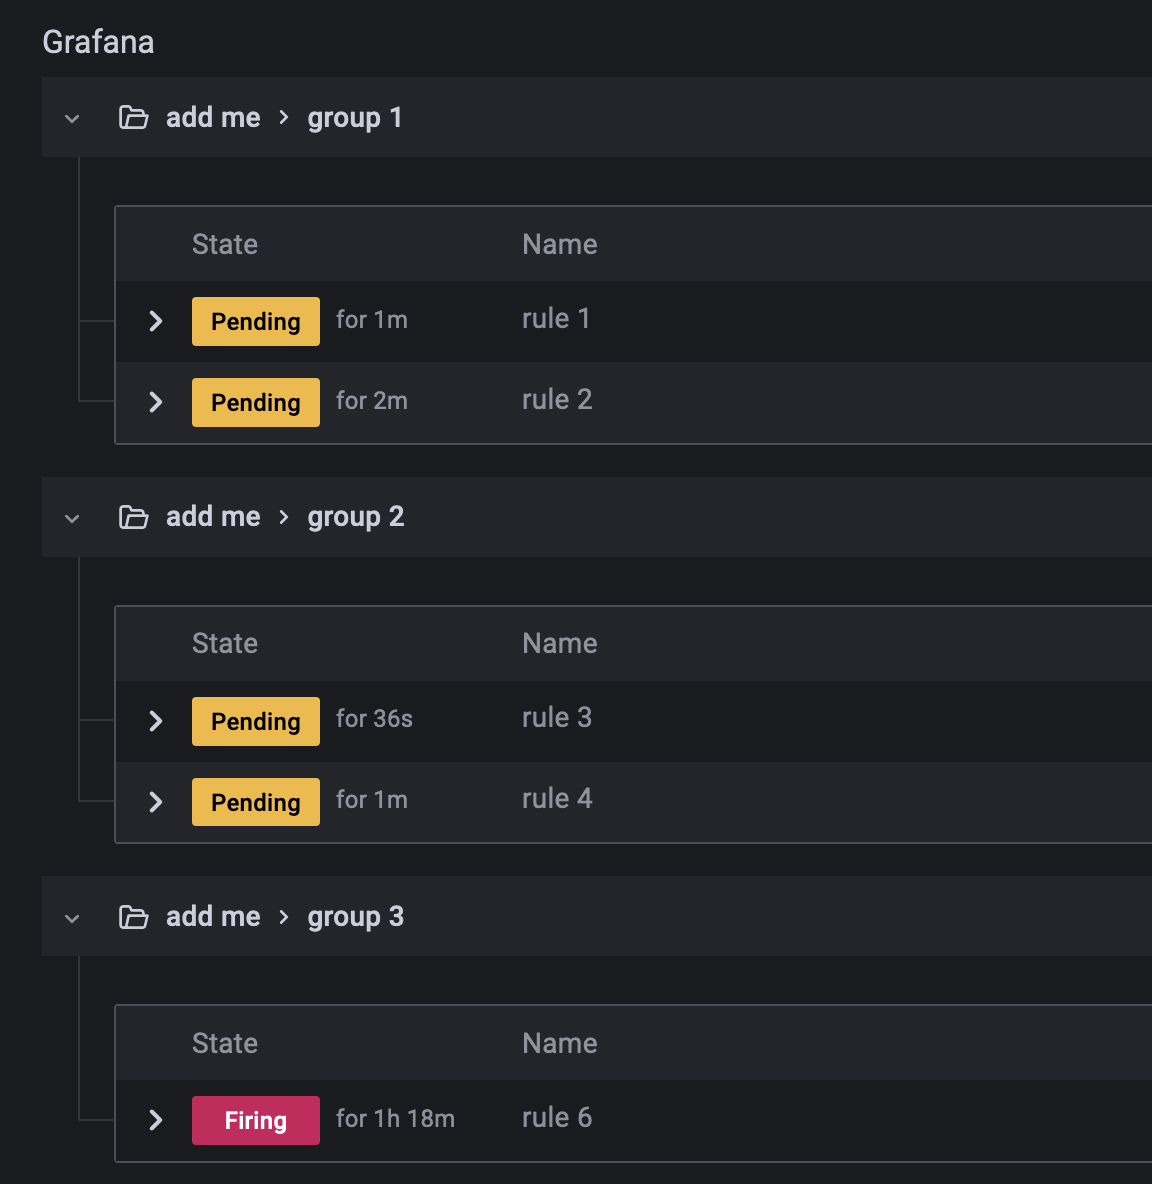
Group names for Grafana-managed alert rules
It’s been tricky to work with more than a small number of Grafana-managed alert rules without groups in namespaces. They’ve also been inconsistent with the Prometheus Alert Generator Compliance Specification, which made working with Grafana-managed and Prometheus-managed alerts a confusing experience. With Grafana 8.5, you can still see flattened Grafana-managed alerts in the List tab, or use the new Grouped tab to work with groups:

Choose useful group names and move alert rules between groups.

Rules in a group are evaluated together, so you can also set the interval for the entire group.
RBAC for alerting (beta)
Lots of our users use as-code pipelines to configure alerts. Grafana is a convenient place to see alerts and respond to them, but if users mistakenly edit provisioned alerts from the UI it can lead to inconsistencies or prevent important alerts from firing.
With Grafana 8.5, we’ve implemented fine-grained access control for alerting rules, notification policies, and contact points in Grafana Enterprise. Now Grafana Enterprise administrators can dial in read and write access to alert rules, silences, and notifications per user, team, or role.

RBAC for dashboards, folders, and annotations (beta)
Every administrator has a different idea for which users should be able to do what in Grafana. To help users customize Grafana for their team or organization, role-based access control (RBAC) is rolling out across every service so that you can dial in permissions to fit your needs.
With Grafana 8.5, Grafana Enterprise administrators can decide which users and/or teams can create, read, update, delete, and share dashboards, folders, and annotations. Fine-grained access control is currently in beta, but general availability is just around the corner — it’s planned for our Grafana 9.0 release, which we’re launching at GrafanaCONline 2022.

New in analytics
Better software update notifications
You can now check for Grafana version updates and updates to versions of Grafana plugins separately by using a new configuration option that will enable plugin version update checks separately. The prior configuration to check for updates now only controls Grafana version update checks.
When enabled, the updated configuration will run a check every 10 minutes. It will notify, via the UI, when a new version is available. The checks will not prompt any auto-updates of the Grafana software, nor will it send any sensitive information.
Plugin update available:

Grafana update available:

Simplified reporting UI
Reports are a great way to share Grafana dashboards by email with users who don’t regularly sign in to Grafana. But while reporting has become more powerful with options like selecting template variables, attaching CSVs, and formatting emails, these options also make it more complex to set up a report. In Grafana 8.5, we’ve revamped the report authoring UI in Grafana Enterprise to make it quicker and easier for you to create reports. Now you can follow a step-by-step process to set up a report, instead of a big, weighty form.
Also, Grafana will now emit a log every time a report is sent, so you can confirm its status or learn about send errors. Learn more in our Reporting docs for Grafana Enterprise.

Learn more about Grafana 8.5
For a quick overview of more new features, have a look at our What’s new in Grafana 8.5 page. For a complete list of new features, changes, and bug fixes, check out the Grafana documentation and the Grafana 8.5 release notes.
Join us on our community forums to discuss any of the new features, workflows, or how to incorporate these changes into your dashboards, queries, and visualizations.
Upgrade to Grafana 8.5
Download or try Grafana 8.5 on Grafana Cloud today.
Refer to our Upgrading documentation for more information about upgrading your Grafana installation.
Thank you to the Grafana community!
As always, a big thank you goes out to all the Grafana users who contributed by submitting PRs, bug reports, and feedback!
And we hope to see all of you at GrafanaCONline 2022, our largest Grafana community event of the year. From June 13 to 17, more than 40 speakers from around the world will be leading sessions about how they use Grafana as well as sharing their insights, best practices, and of course, dashboards. Check out the full GrafanaCONline 2022 agenda and register for free today!


