How to use WebSockets to visualize real-time IoT data in Grafana
Mike Szczys is a Developer Relations Engineer at Golioth. His deep love of microcontrollers began in the early 2000s, growing from the desire to make more of the BEAM robotics he was building. When he’s not reading data sheets, he’s busy as an orchestra musician in Madison, Wisconsin.
At Golioth, a commercial IoT development platform, we love using the power of Grafana to easily visualize data from IoT installations where tens, hundreds, or even thousands of devices are reporting back. Our platform creates secure connections to all of your devices in the field, making it easy to not only collect the data, but also provide a number of ways to seamlessly connect it to other platforms.
WebSockets are one of the ways Golioth makes real-time data available. In order to graph this data, we’ve written a Grafana plugin that connects to any WebSocket data source that is using the JSON format.
Since WebSockets deliver real-time data without polling, when you’re using the new WebSockets data source plugin, your Grafana panels will automatically update as new data comes in. This makes live monitoring easy, whether you’re watching for a continuous stream of data or immediately want to see the results of alert data that arrives infrequently.

Getting started with WebSockets and Grafana
The new WebSocket data source plugin is already part of Grafana and can be added using the normal plugin process which I’ll go through below. (We have also published a Websockets demo that shows the workflow of sending data from a device to visualizing it with Grafana.) The plugin is open source, and you can find the code on GitHub.
Step 1: Add the WebSocket data source plugin

- Log in to Grafana or sign up for Grafana Cloud if you don’t already have an account.
- (Optional) If you are redirected to grafana.com/orgs/, click on “log in” under the Grafana heading.
- Click the gear icon in the left sidebar and choose Plugins.
- Search for WebSocket in the Search Grafana plugins box.
- Click on the WebSocket API tile and then click Install via Grafana.com.
- Click the “Install plugin” button on the next screen.
- Return to the WebSocket plugins screen in your Grafana dashboard.
- Refresh the page and you will now see a Create a WebSocket API data source button.
Step 2: Get your WebSocket URL and API key
The WebSocket plugin is generic to any source that provides WebSocket outputs to other websites. We’re going to show the Golioth flow, as this is one of our standard outputs from our platform to sites like Grafana. If you want to see the entire process without generating any data, check out the aforementioned demo on the Golioth blog, or get started generating data following the Golioth Getting Started Guide.
To generate an API key on the Golioth Console, you will need to know your WebSocket URL. The API URL is shown, but we want to use the WebSocket version: wss://api.golioth.io/v1/ws/ (note the wss:// prefix and ws/ suffix). It’s a good idea to keep the host URL to a more general endpoint rather than pointing to the specific piece of data you want to access. This provides more flexibility when setting up your panel.

You can see here that the Path entry /projects/environment-monitor will be used later when we configure the Path setting of the Grafana panel. By using this approach in the configuration, your data source can be used for endpoints that reach multiple projects or devices.
For more help with this step, you can follow our guide on Golioth IoT Websocket access using Grafana Cloud. Otherwise, please consult the Webhook API documents for your specific platform.
Step 3: Configure the WebSocket data source
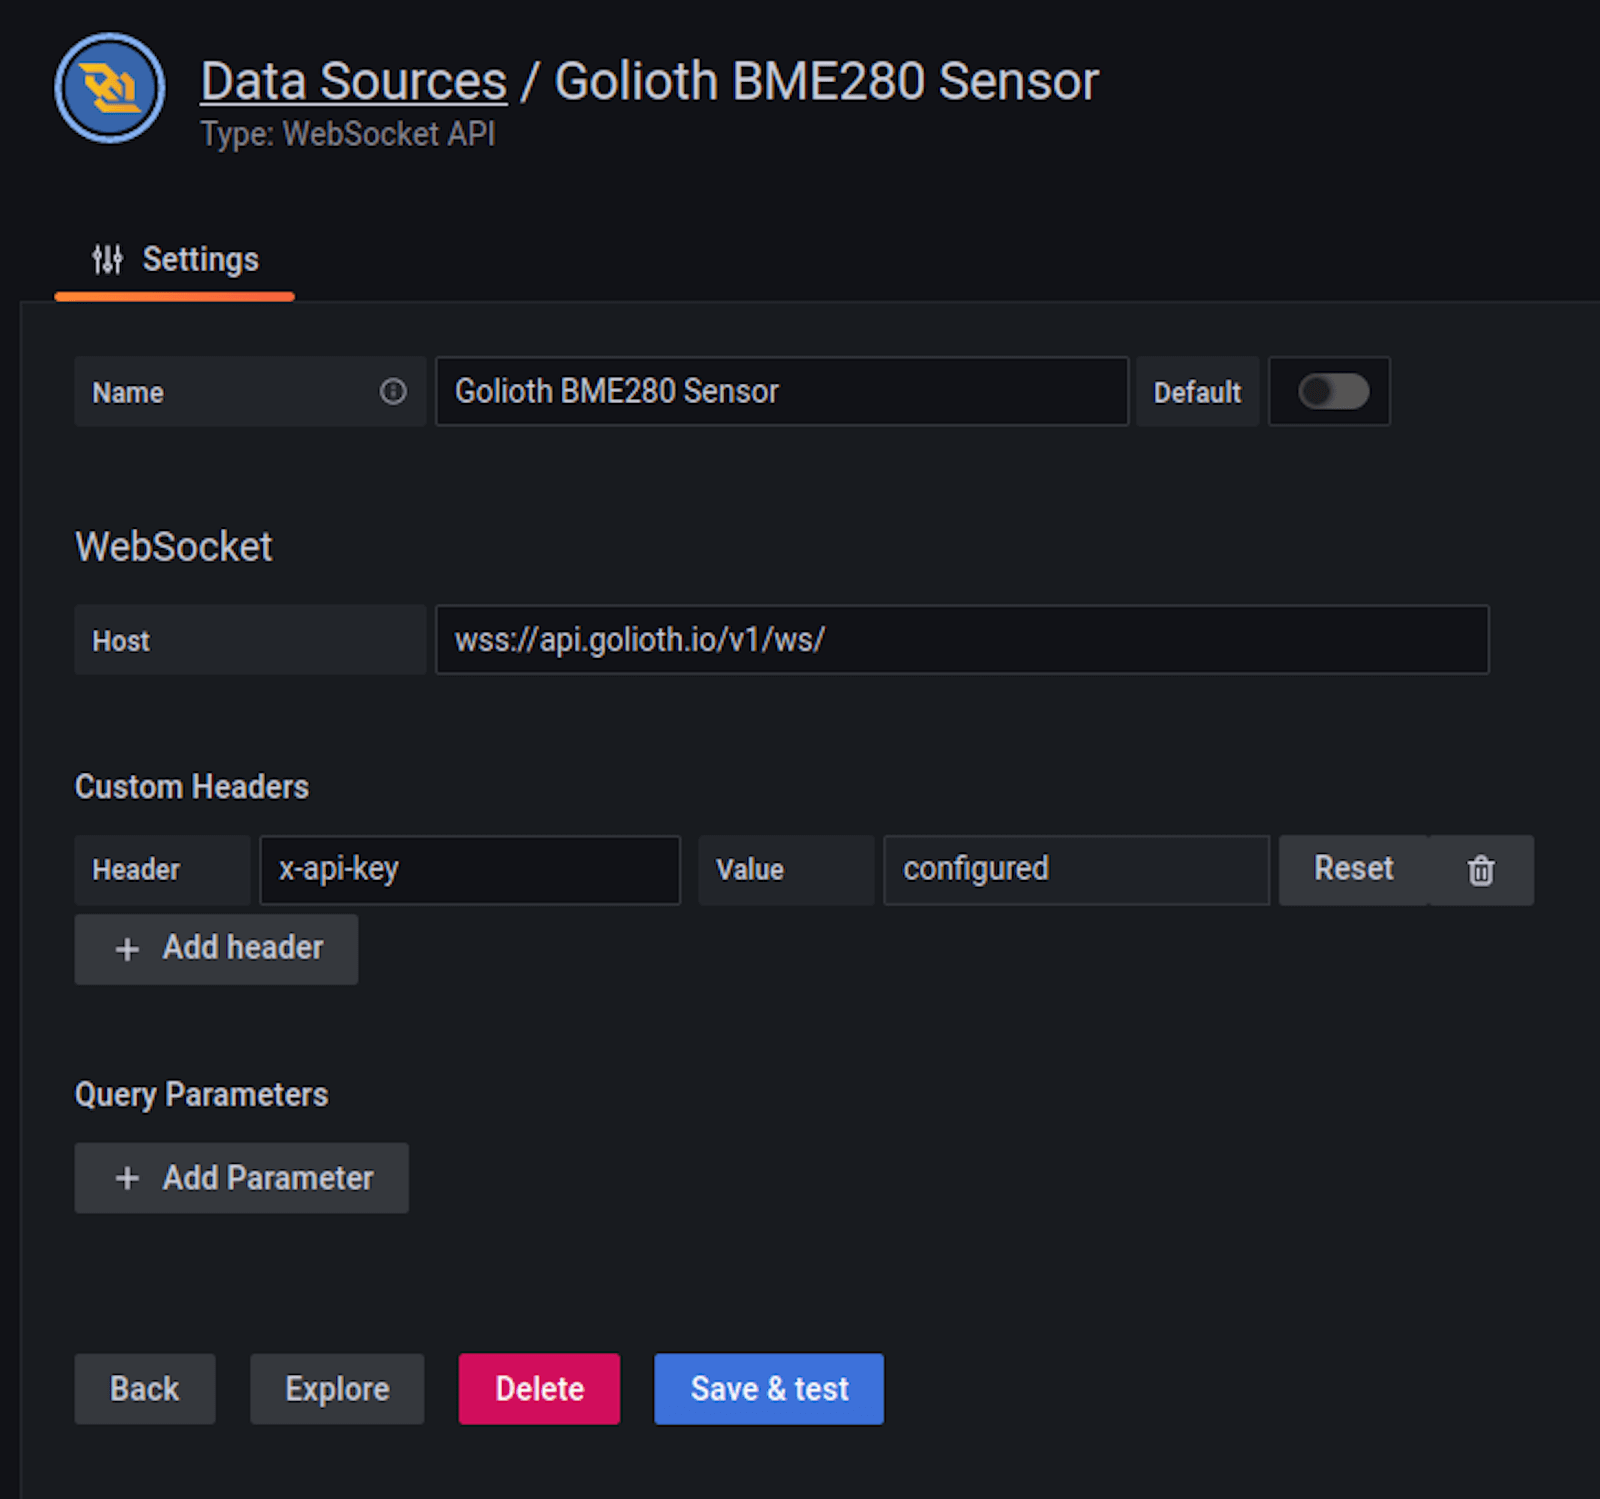
Once the plugin is selected as a data source, choose a descriptive name.

Enter your WebSocket URL in the Host field. You will also need to add headers in the Grafana data source for any custom headers or query parameters necessary for your WebSocket services. Because Golioth uses API keys to manage access, you can see that I have added the “x-api-key” as a header and saved the API key as the value.
After hitting the “Save & test” button, you should be greeted with a success message. Now you’re ready to add a panel to visualize the incoming data.
Step 4: Configure panel to display data
- Use the + icon in the left sidebar to add a new panel.
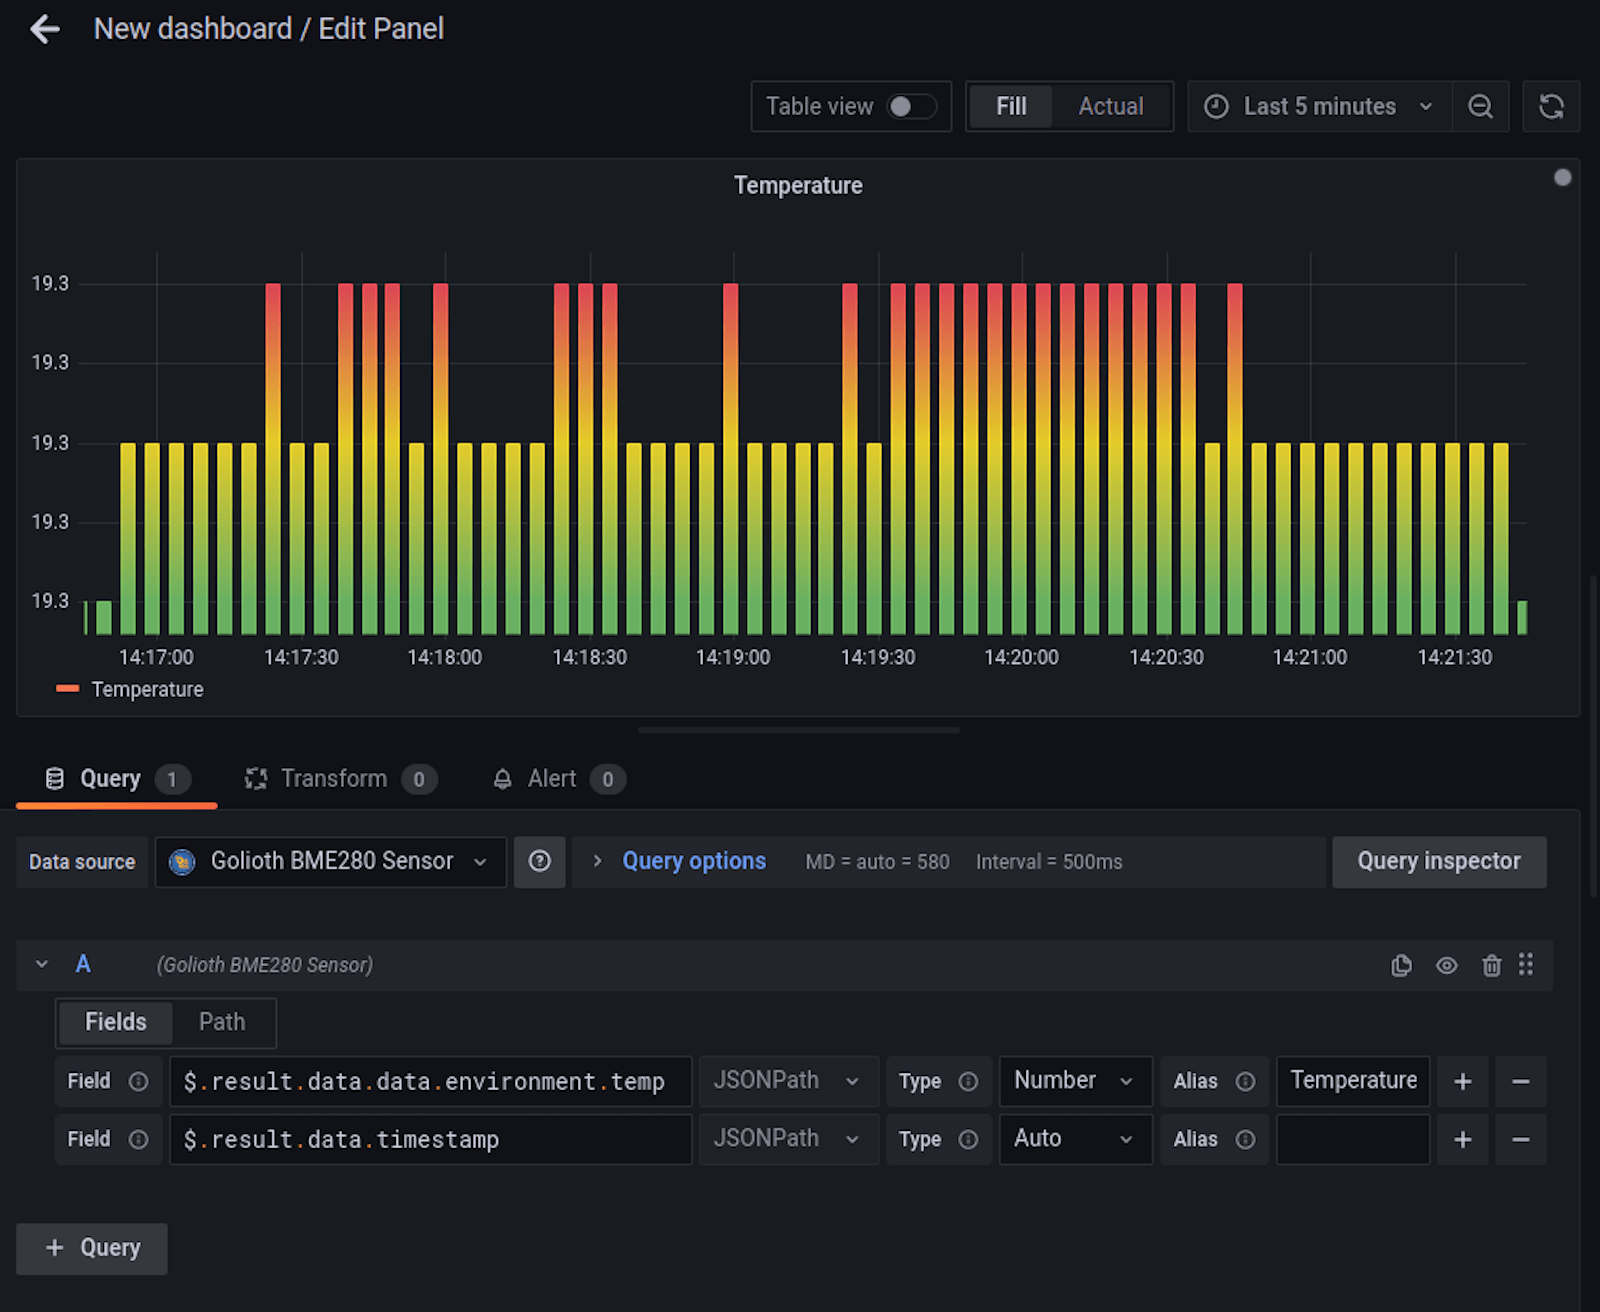
- From the “Data source” menus, select the WebSocket source you just configured.
- Add your target endpoint in the Path field on the Path tab.
- As noted previously, the Golioth API key interface indicates the Path. I’m accessing stream data so I append that as well:
/projects/environment-monitor/stream
- As noted previously, the Golioth API key interface indicates the Path. I’m accessing stream data so I append that as well:
- Use the Fields tab to select data from the endpoint’s JSON packets.
- I’ve formatted my Fields to capture one piece of data and the timestamp:
$.result.data.data.environment.temp$.result.data.timestamp
- I’ve formatted my Fields to capture one piece of data and the timestamp:
And here’s an example of a panel:

When set up correctly, Grafana can automatically map your data to a visualization format. However, the Table view toggle at the top of the Edit Panel window will be extremely helpful in setting up the Fields.
Start by turning on table view and putting just $ into the fields tab. You should see the full JSON packet appear each time a WebSocket update is received. Remember, this is realtime data, so a new data packet must be sent for it to appear here.
And you’re done!
Real-time benefits
When managing fleets of remote hardware, seeing a heartbeat of data coming in provides immediate feedback on the health of your devices. Being able to visualize in real time using Grafana delivers this peace of mind for anyone monitoring the data, and it’s an immediate proof point to show customers what is happening.
Golioth has a free Dev Tier so that you can start building your IoT fleet right away. You’ll quickly have some devices online and generating data — a perfect chance to give this new WebSocket plugin a try!
Want to share your Grafana story and dashboards with the community? Drop us a note at stories@grafana.com.


