Monitor real-time distributed messaging platform NSQ with the new integration for Grafana Cloud
Today, I am excited to introduce the NSQ integration available for Grafana Cloud, our platform that brings together all your metrics, logs, and traces with Grafana for full-stack observability.
NSQ is a real-time distributed messaging platform designed to operate at scale, handling billions of messages per day. It’s a simple and lightweight alternative to other message queues such as Kafka, RabbitMQ, or ActiveMQ.
This will walk you through how to get the most out of the integration.
Getting started
NSQ can emit its metrics to StatsD daemon and does not support Prometheus metrics format natively. Grafana Cloud Metrics supports both Graphite and Prometheus time series databases, so to push metrics into Grafana Cloud we have three options:
- Run statsd near nsqd daemon and relay metrics to Graphite
- Use community Prometheus nsq exporter
- Use Grafana Agent to transform statsd metrics into prometheus format to store them in Grafana Cloud Prometheus
We chose the last option for this integration because if we use Prometheus, we can complement metrics with alerts to track nsq topics queues stacking up. It also makes deployment robust, because you are likely already using a universal Grafana Agent to get all types of observability data (metrics, logs, and traces) into Grafana Cloud.
In order for the integration to work, point nsqd to Grafana Agent with -statsd-address, like this:
nsqd -statsd-address=agent.default.svc.cluster.local:9125 \

 -e2e-processing-latency-percentile=1.0,0.99,0.95 \

 -e2e-processing-latency-window-time=1m0s
And configure Grafana Agent’s embedded statsd_exporter the following way:
integrations:
 statsd_exporter:
   enabled: true
   metric_relabel_configs:
     - source_labels: [exported_job]
       target_label: job
       replacement: 'integrations/$1'
     - source_labels: [exported_instance]
       target_label: instance
     - regex: (exported_instance|exported_job)
       action: labeldrop
   mapping_config:
     defaults:
       match_type: glob
       glob_disable_ordering: false
       ttl: 1m30s
     mappings:
      - match: "nsq.*.topic.*.channel.*.message_count"
        name: "nsq_topic_channel_message_count"
        match_metric_type: counter
        labels:
          instance: "$1"
          job: "nsq"
          topic: "$2"
          channel: "$3"

      - match: "nsq.*.topic.*.channel.*.requeue_count"
        name: "nsq_topic_channel_requeue_count"
        match_metric_type: counter
        labels:
          instance: "$1"
          job: "nsq"
          topic: "$2"
          channel: "$3"

      - match: "nsq.*.topic.*.channel.*.timeout_count"
        name: "nsq_topic_channel_timeout_count"
        match_metric_type: counter
        labels:
          instance: "$1"
          job: "nsq"
          topic: "$2"
          channel: "$3"

      - match: "nsq.*.topic.*.channel.*.*"
        name: "nsq_topic_channel_${4}"
        match_metric_type: gauge
        labels:
          instance: "$1"
          job: "nsq"
          topic: "$2"
          channel: "$3"

     #nsq.<nsq_host>_<nsq_port>.topic.<topic_name>.backend_depth [gauge]
      - match: "nsq.*.topic.*.message_count"
        name: "nsq_topic_message_count"
        help: Total number of messages for the topic
        match_metric_type: counter
        labels:
          instance: "$1"
          job: "nsq"
          topic: "$2"

      - match: "nsq.*.topic.*.message_bytes"
        name: "nsq_topic_message_bytes"
        help: Total number of bytes of all messages
        match_metric_type: counter
        labels:
          instance: "$1"
          job: "nsq"
          topic: "$2"

      - match: "nsq.*.topic.*.*" #depth, backend_depth and e2e_processing_latency_<percent>
        name: "nsq_topic_${3}"
        match_metric_type: gauge
        labels:
          instance: "$1"
          job: "nsq"
          topic: "$2"
     # mem
     # nsq.<nsq_host>_<nsq_port>.mem.gc_runs
      - match: "nsq.*.mem.gc_runs"
        name: "nsq_mem_gc_runs"
        match_metric_type: counter
        labels:
          instance: "$1"
          job: "nsq"

      - match: "nsq.*.mem.*"
        name: "nsq_mem_${2}"
        match_metric_type: gauge
        labels:
          instance: "$1"
          job: "nsq"
And you are all set!
Viewing NSQ topics and instances
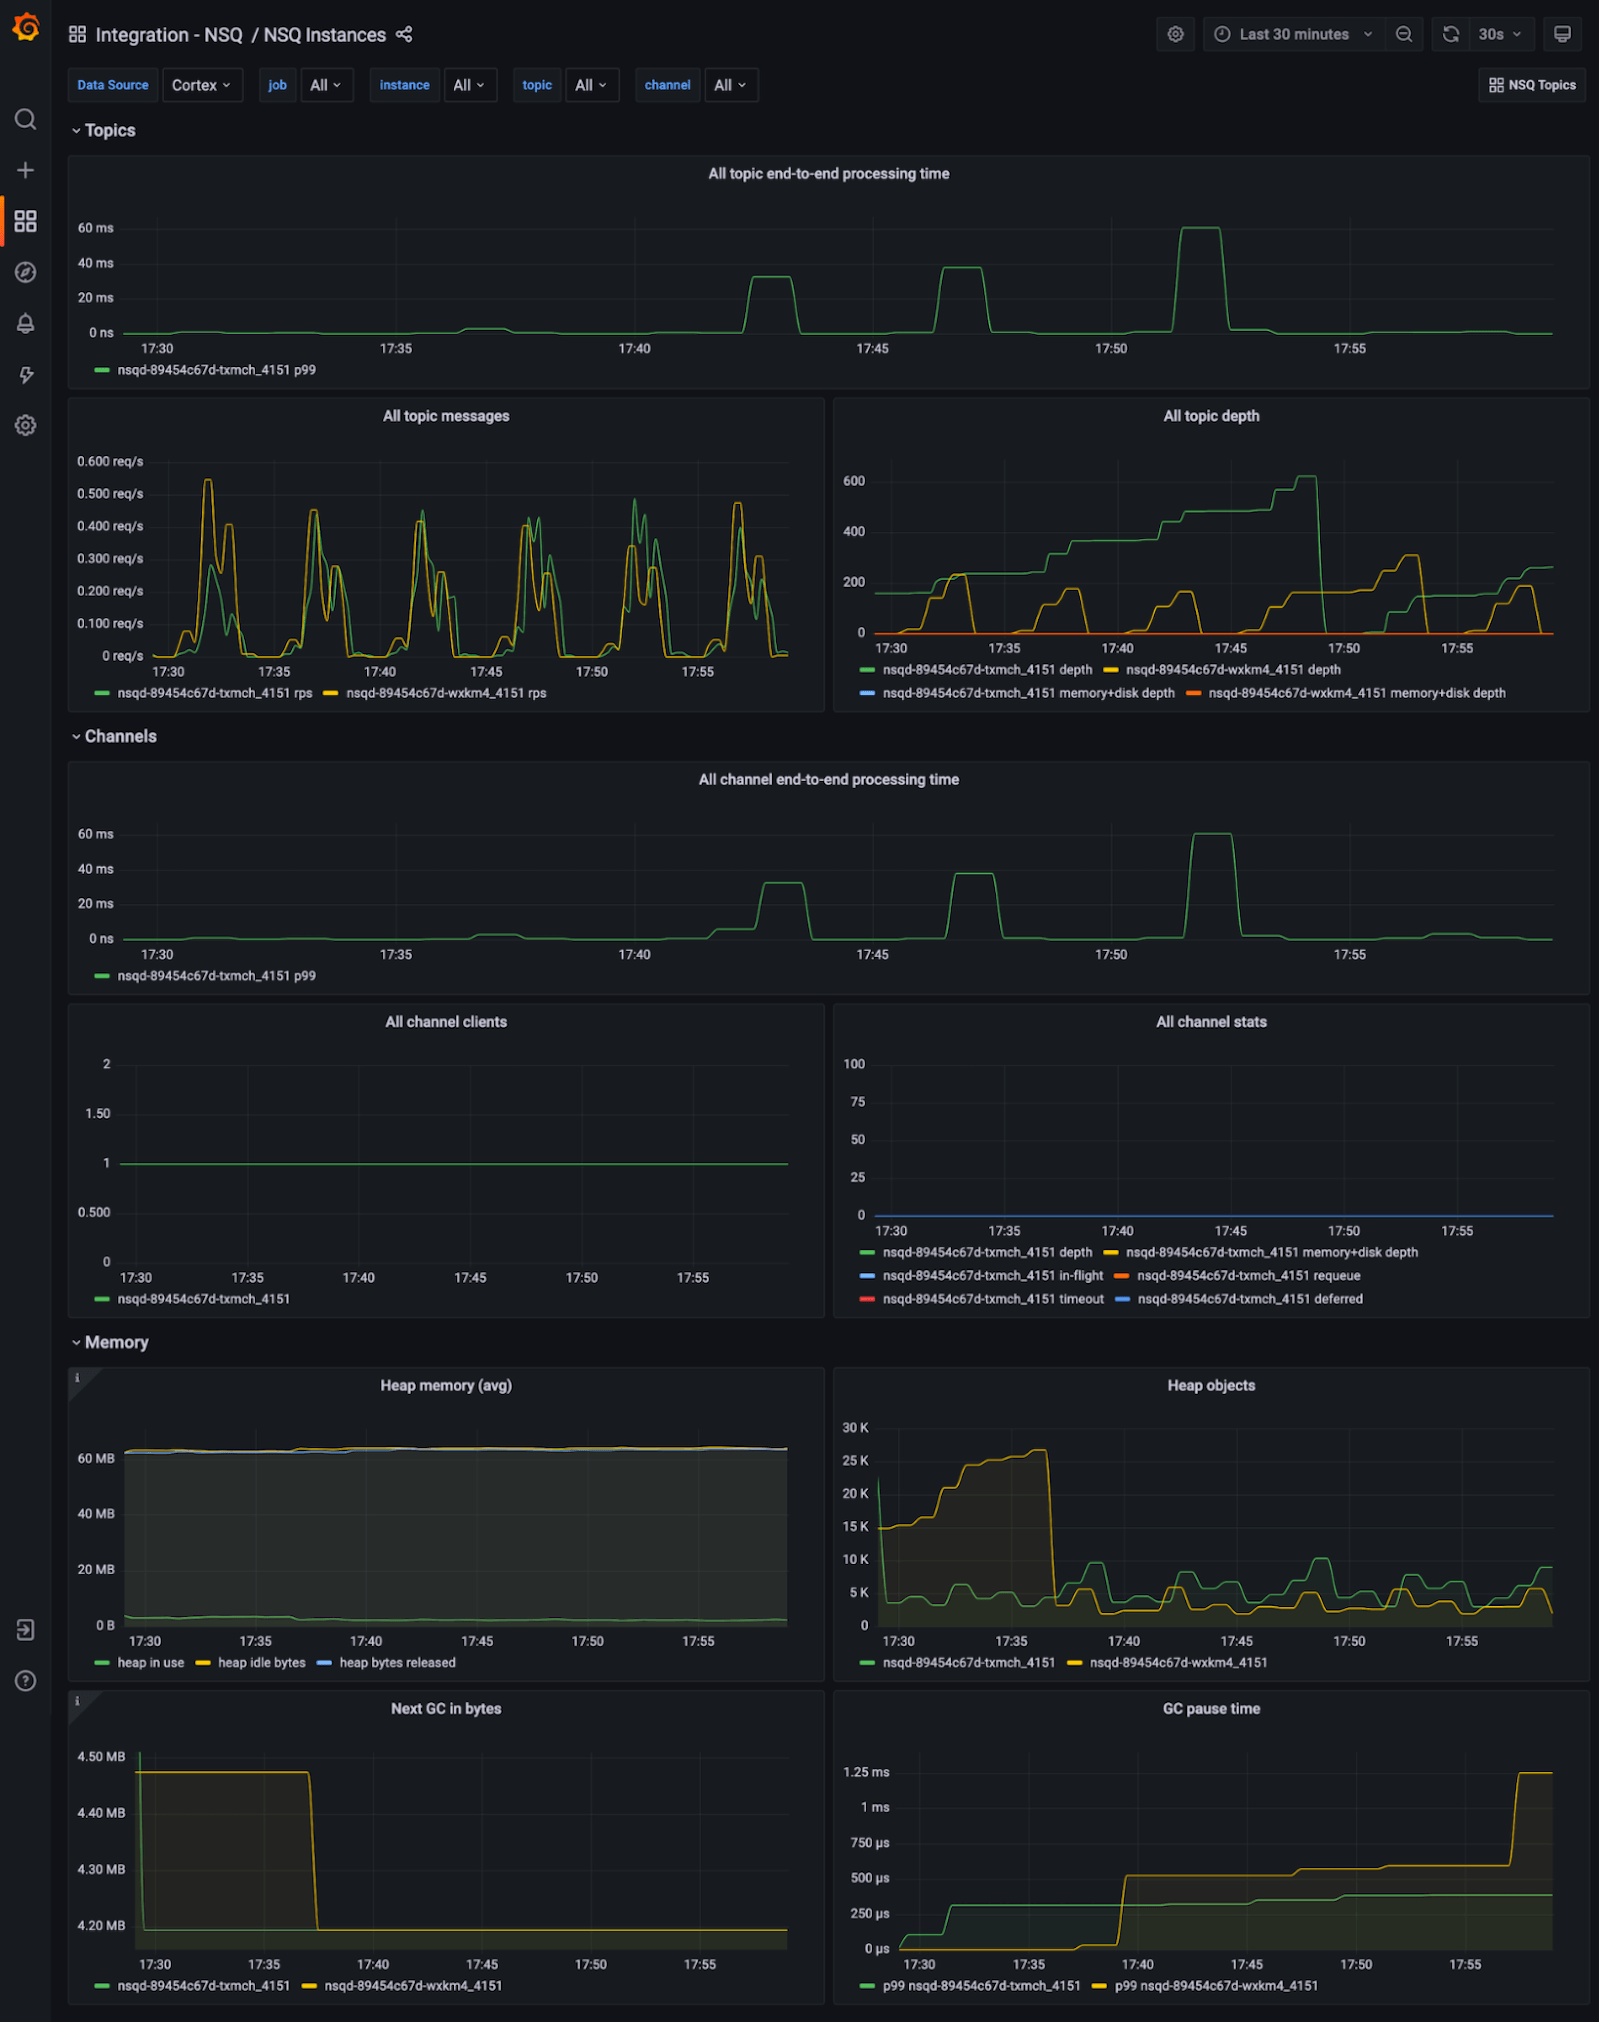
To help you troubleshoot and analyze NSQ clusters, the integration provides two interconnected dashboards.
This one groups metrics by NSQ topic and channels for a logical view:

And this dashboard gives you an infrastructure view, where metrics are grouped by nsqd instances with memory stats available:

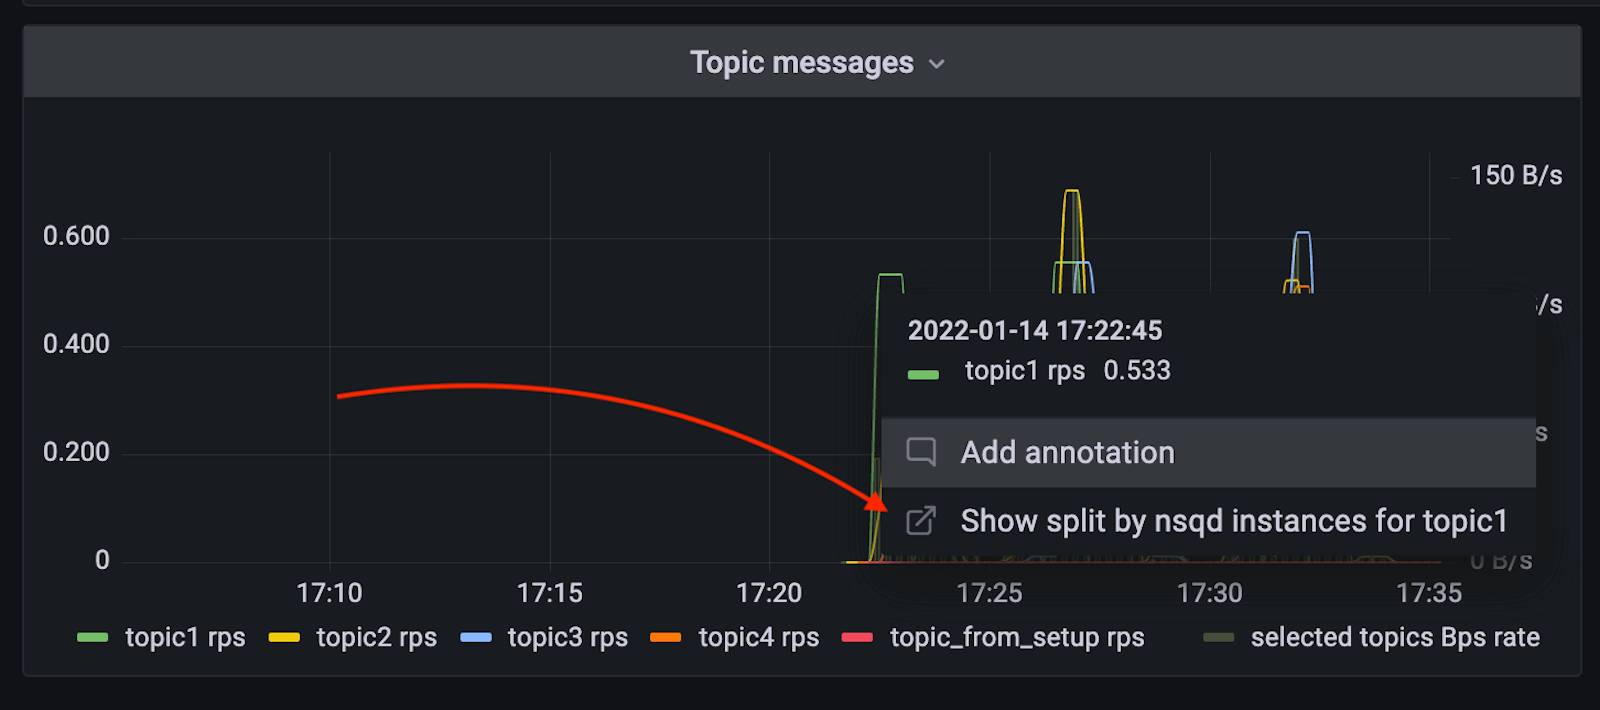
Want to jump from one view to another while doing ad-hoc analysis? Or have you found one congested topic and now want to see which nsqd instance it’s affecting? Just use Dashboards links and Data links to switch between those two without losing the topic you selected.

Along with the dashboards, alerts rules are also part of this integration and can notify you about critical problems. Once the integration is installed, just head to the Alerts section of your Grafana stack.
Try it out!
The integration with NSQ is available now for Grafana Cloud users. If you’re not already using Grafana Cloud, we have a generous free forever tier and plans for every use case. Sign up for free now! It’s the easiest way to get started observing metrics, logs, traces, and dashboards.
For more information on monitoring and alerting on Grafana Cloud and NSQ, check out our docs or join the #integrations channel in the Grafana Labs Community Slack.
Stay tuned for future content on how to best utilize the Grafana Cloud integrations. And tell us what you’d like to see!


