Load testing with CircleCI
By integrating load testing into your CI pipelines, you can catch performance issues earlier and ship reliable applications to production.
In this load testing example, we will look at how to integrate Grafana k6 tests into CircleCI.
Prerequisites
- k6, an open source load testing tool for testing the performance and reliability of websites, APIs, microservices, and system infrastructure.
- CircleCI is a continuous integration and delivery tool to automate your development process.
The examples in this tutorial can be found here. For the best experience, you can clone the repository and execute the tests.
Write your performance test script
For the sake of this tutorial, we will create a simple k6 test for our demo API. Feel free to change this to any of the API endpoints you are looking to test.
The following test will run 50 VUs (virtual users) continuously for one minute. Throughout this duration, each VU will generate one request, sleep for 3 seconds, and then start over.
import { sleep } from 'k6';
import http from 'k6/http';

export const options = {
  duration: '1m',
  vus: 50,
};

export default function () {
  http.get('http://test.k6.io/contacts.php');
  sleep(3);
}
You can run the test locally using the following command. Just make sure to install k6 first.
k6 run loadtests/performance-test.jsThis produces the following output:
          /\      |‾‾|  /‾‾/  /‾/
     /\  /  \     |  |_/  /  / /
    /  \/    \    |      |  /  ‾‾\
   /          \   |  |‾\  \ | (_) |
  / __________ \  |__|  \__\ \___/ .io

 execution: local
     script: loadtests/performance-test.js
     output: -

  scenarios: (100.00%) 1 scenario, 5 max VUs, 1m0s max duration (incl. graceful stop):
           * default: 10 iterations shared among 5 VUs (maxDuration: 30s, gracefulStop: 30s)


running (0m08.3s), 0/5 VUs, 10 complete and 0 interrupted iterations
default ✓ [======================================] 5 VUs  08.3s/30s  10/10 shared iters

     data_received..................: 38 kB  4.5 kB/s
     data_sent......................: 4.5 kB 539 B/s
     http_req_blocked...............: avg=324.38ms min=2µs      med=262.65ms max=778.11ms p(90)=774.24ms p(95)=774.82ms
     http_req_connecting............: avg=128.05ms min=0s       med=126.67ms max=260.87ms p(90)=257.26ms p(95)=260.71ms
     http_req_duration..............: avg=256.13ms min=254.08ms med=255.47ms max=259.89ms p(90)=259ms    p(95)=259.66ms
       { expected_response:true }...: avg=256.13ms min=254.08ms med=255.47ms max=259.89ms p(90)=259ms    p(95)=259.66ms
     http_req_failed................: 0.00%  ✓ 0        ✗ 20
     http_req_receiving.............: avg=63µs     min=23µs     med=51µs     max=127µs    p(90)=106.8µs  p(95)=114.65µs
     http_req_sending...............: avg=34.4µs   min=9µs      med=27µs     max=106µs    p(90)=76.4µs   p(95)=81.3µs
     http_req_tls_handshaking.......: avg=128.65ms min=0s       med=0s       max=523.58ms p(90)=514.07ms p(95)=517.57ms
     http_req_waiting...............: avg=256.03ms min=253.93ms med=255.37ms max=259.8ms  p(90)=258.87ms p(95)=259.59ms
     http_reqs......................: 20     2.401546/s
     iteration_duration.............: avg=4.16s    min=3.51s    med=4.15s    max=4.81s    p(90)=4.81s    p(95)=4.81s
     iterations.....................: 10     1.200773/s
     vus............................: 5      min=5      max=5
     vus_max........................: 5      min=5      max=5
Configure thresholds
The next step is to add your service-level objectives (SLOs) for the performance of your application. SLOs are a vital aspect of ensuring the reliability of your systems and applications. If you do not currently have any defined SLAs or SLOs, now is a good time to start considering your requirements.
You can then configure your SLOs as pass/fail criteria in your test script using thresholds. k6 evaluates these thresholds during the test execution and informs you about its results.
If a threshold in your test fails, k6 will finish with a non-zero exit code, which communicates to the CI tool that the step failed.
Now, we add two thresholds to our previous script to validate that the 95th percentile response time is below 500ms and also that our error rate is less than 1%. After this change, the script will be as in the snippet below:
import { sleep } from 'k6';
import http from 'k6/http';

export const options = {
  duration: '1m',
  vus: 50,
  thresholds: {
    http_req_failed: ['rate<0.01'], // http errors should be less than 1%
    http_req_duration: ['p(95)<500'], // 95 percent of response times must be below 500ms
  },
};

export default function () {
  http.get('http://test.k6.io/contacts.php');
  sleep(3);
}
Thresholds are a powerful feature providing a flexible API to define various types of pass/fail criteria in the same test run. For example:
- The 99th percentile response time must be below 700 ms.
- The 95th percentile response time must be below 400 ms.
- No more than 1% failed requests.
- The content of a response must be correct more than 95% of the time.
- Your condition for pass/fail criteria (SLOs).
CircleCI pipeline configuration
There are two steps to configure a CircleCI pipeline to fetch changes from your repository:
- Create a repository that contains a
.circleci/config.ymlconfiguration with your k6 load test script and related files. - Add the project (repository) to CircleCI so that it fetches the latest changes from your repository and executes your tests.
Setting up the repository
In the root of your project, create a folder named .circleci and inside that folder, create a configuration file named config.yml. This file will trigger the CI to build whenever a push to the remote repository is detected. If you want to know more about it, please visit these links:
Proceed by adding the following YAML code into your config.yml file. This configuration file does the following:
- Uses grafana/k6 orb, which encapsulates all test execution logic.
- Runs k6 with your performance test script passed to the
scriptin the job.
version: 2.1
orbs:
  grafana: grafana/k6@1.1.3
workflows:
  load_test:
    jobs:
     - grafana/k6:
          script: loadtests/performance-test.js
Note: A CircleCI orb is a reusable package of YAML configuration that condenses repeated pieces of config into a single line of code. In our case above, the orb is
grafana/k6@1.1.3and this orb will specify all the test steps that our configuration file above will follow to execute our load test. Use the latest orb version.
Add project and run the test
To enable a CircleCI build for your repository, use the “Add Project” button. While you have everything setup, head over to your dashboard to watch the build that was just triggered by pushing the changes to GitHub. You might see the build at the top of the pipeline page:

On this page, you will have your build running. Just click on the specific build step, i,e., the highlighted grafana/k6, to watch the test run and see the results when it has finished. Below is the build page for a successful build:

Running Grafana Cloud tests
There are two common ways to run k6 tests as part of a CI process:
k6 runto run a test locally on the CI server.k6 cloudto run a test on Grafana Cloud k6 from one or multiple geographic locations.
You might want to trigger cloud tests in these common cases:
- If you want to run a test from one or multiple geographic locations (load zones).
- If you want to run a test with high load that will need more compute resources than provisioned by the CI server.
If any of those reasons fits your needs, then running cloud tests is the way to go for you.
Before we start with the CircleCI configuration, it is good to familiarize ourselves with how cloud execution works, and we recommend you test how to trigger a cloud test from your machine. Check out the guide to running cloud tests from the CLI to learn how to distribute the test load across multiple geographic locations and to get more information about the cloud execution.
We will now show how to trigger cloud tests from CircleCI. If you do not have an account with Grafana Cloud k6 already, register for a trial account. After that, go to the token page and copy your API token.
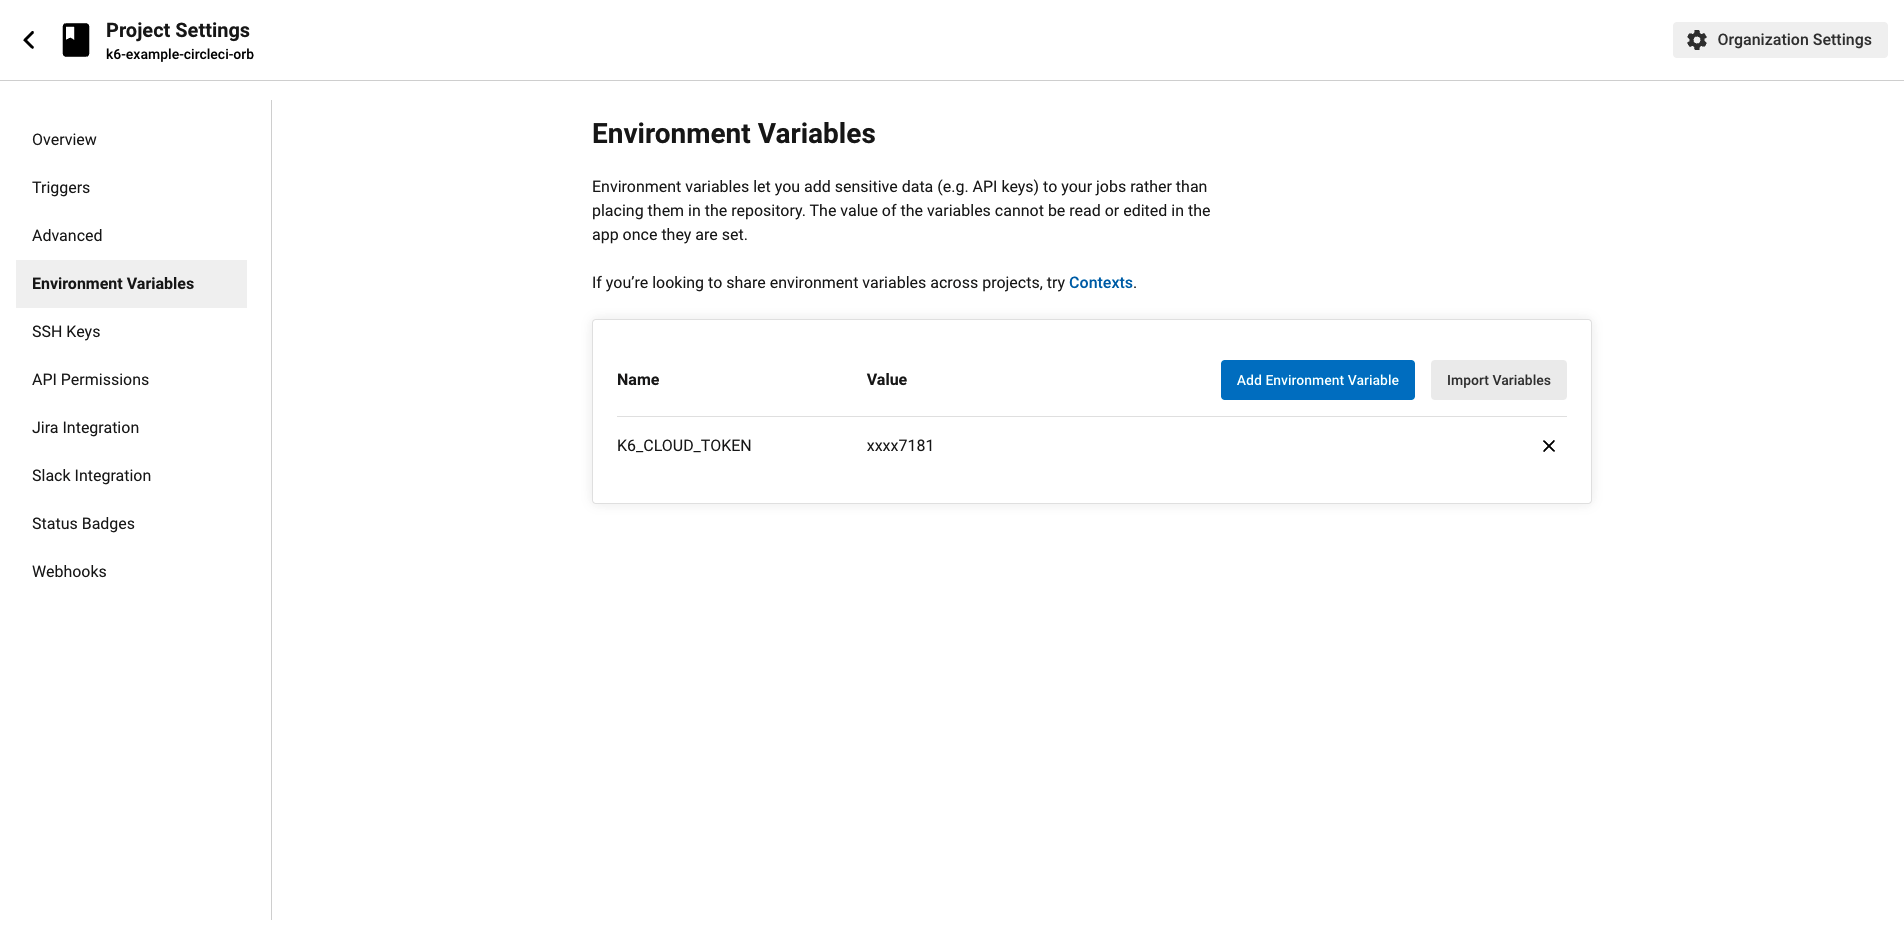
Next, navigate to the project’s settings in CircleCI and select the Environment Variables page. Add a new environment variable:
K6_CLOUD_TOKEN: its value is the API token we got from Grafana Cloud k6.

If you need to run the cloud test in a particular project, you need your project ID to be set as an environment variable or on the k6 script. The project ID is visible under the project name in the project page.
Then, the .circleci/config.yml file should look like the following:
version: 2.1
orbs:
  grafana: grafana/k6@1.1.3
workflows:
  load_test:
    jobs:
     - grafana/k6:
          cloud: true
          script: loadtests/performance-test.js
          arguments: --quiet
Again, due to the power of orbs, since we already have an existing written configuration, all we need to do is to pass in the configuration cloud: true and CircleCI will be able to use our K6_CLOUD_TOKEN that we configured in our environment variables and to send our k6 run output to Grafana Cloud k6.
Note: It is mandatory to set the
K6_CLOUD_TOKENfor the cloud configuration on Circleci to work with the k6 orb. This is because, once we have acloud:trueoption in our configuration, CircleCI expects to also have a valid token that can be used to run our tests on Grafana Cloud k6.
With that done, we can now go ahead and push the changes we’ve made in .circleci/config.yml to our GitHub repository. This subsequently triggers CircleCI to build our new pipeline using the new config file. Just keep in mind that for keeping things tidy, we’ve created a directory named cloud-example which contains the CircleCI config file to run our cloud tests in the cloned repository.

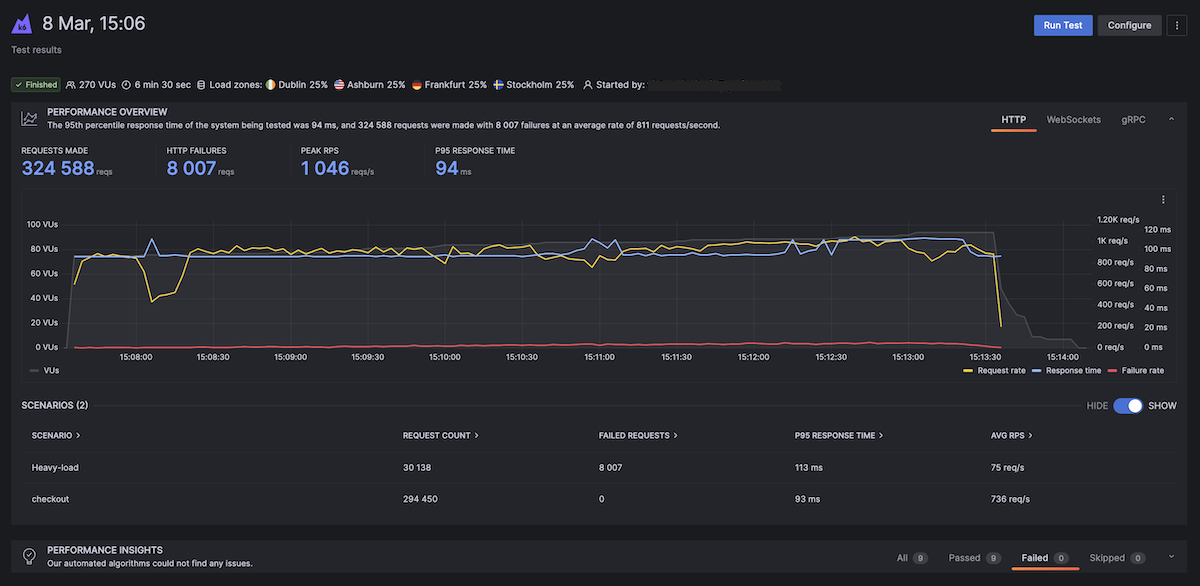
It is essential to know that CircleCI prints the output of the k6 command, and when running cloud tests, k6 prints the URL of the test result in Grafana Cloud k6, which is highlighted in the above screenshot. You could navigate to this URL to see the result of your cloud test.
We recommend that you define your performance thresholds in the k6 tests in a previous step. If you have configured your thresholds properly and your test passes, there should be nothing to worry about. But when the test fails, you want to understand why. In this case, navigate to the URL of the cloud test to analyze the test result. The result of the cloud service will help you quickly find the cause of the failure.

Nightly builds
It’s common to run some performance tests during the night when users do not access the system under test. For example, you might do this to isolate larger tests from other types of tests or to generate a performance report periodically. Below is the first example of configuring a scheduled nightly build that runs at midnight (UTC) everyday.
version: 2.1
orbs:
grafana: grafana/k6@1.1.3
workflows:
 load_test:
  jobs:
    - k6io/test:
        script: loadtests/performance-test.js
 nightly:
   triggers:
     - schedule:
         cron: "0 0 * * *"
         filters:
           branches:
             only:
               - master
   jobs:
     - k6io/test
This example is using the crontab syntax to schedule execution. To learn more, we recommend reading the scheduling a CircleCI workflow guide.
Storing test results as artifacts
Using the JSON output for time series data
We can store the k6 results as artifacts in CircleCI so that we can inspect results later.
This excerpt of the CircleCI config file shows how to do this with the JSON output and the k6 Docker image.
version: 2.1
orbs:
grafana: grafana/k6@1.1.3
workflows:
load_test:
  jobs:
   - grafana/k6:
        script: loadtests/performance-test.js --out json=full.json > /tmp/artifacts
In our snippet above, we have defined the output to the CircleCI artifact with > /tmp/artifacts which CircleCI will interpret it as the volume in the orb for storing artifacts.
The full.json file will provide all the metric points collected by k6. The file size can be huge. If you don’t need to process raw data, you can store the k6 end-of-test summary as a CircleCI artifact.
Using handleSummary callback for test summary
k6 can also report the general overview of the test results (end of the test summary) in a custom file. To achieve this, we will need to export a handleSummary function, as in the code snippet below of our performance-test.js script file:
import { sleep } from 'k6';
import http from 'k6/http';
import { textSummary } from 'https://jslib.k6.io/k6-summary/0.0.1/index.js';

export const options = {
  duration: '.5m',
  vus: 5,
  iterations: 10,
  thresholds: {
    http_req_failed: ['rate<0.01'], // http errors should be less than 1%
    http_req_duration: ['p(95)<500'], // 95 percent of response times must be below 500ms
  },
};

export default function () {
  http.get('http://test.k6.io/contacts.php');
  sleep(3);
}

export function handleSummary(data) {
  console.log('Finished executing performance tests');

  return {
    'stdout': textSummary(data, { indent: ' ', enableColors: true }), // Show the text summary to stdout...
    'summary.json': JSON.stringify(data), // and a JSON with all the details...
  };
}
In the handleSummary callback, we have specified the summary.json file to save the results. To store the summary result as a CircleCI artifact, we use the same running command as our testing command but define an output path where CircleCI will store our output file as shown below:
version: 2.1
orbs:
grafana: grafana/k6@1.1.3
workflows:
load_test:
  jobs:
   - grafana/k6:
        script: loadtests/performance-test.js > /tmp/artifacts
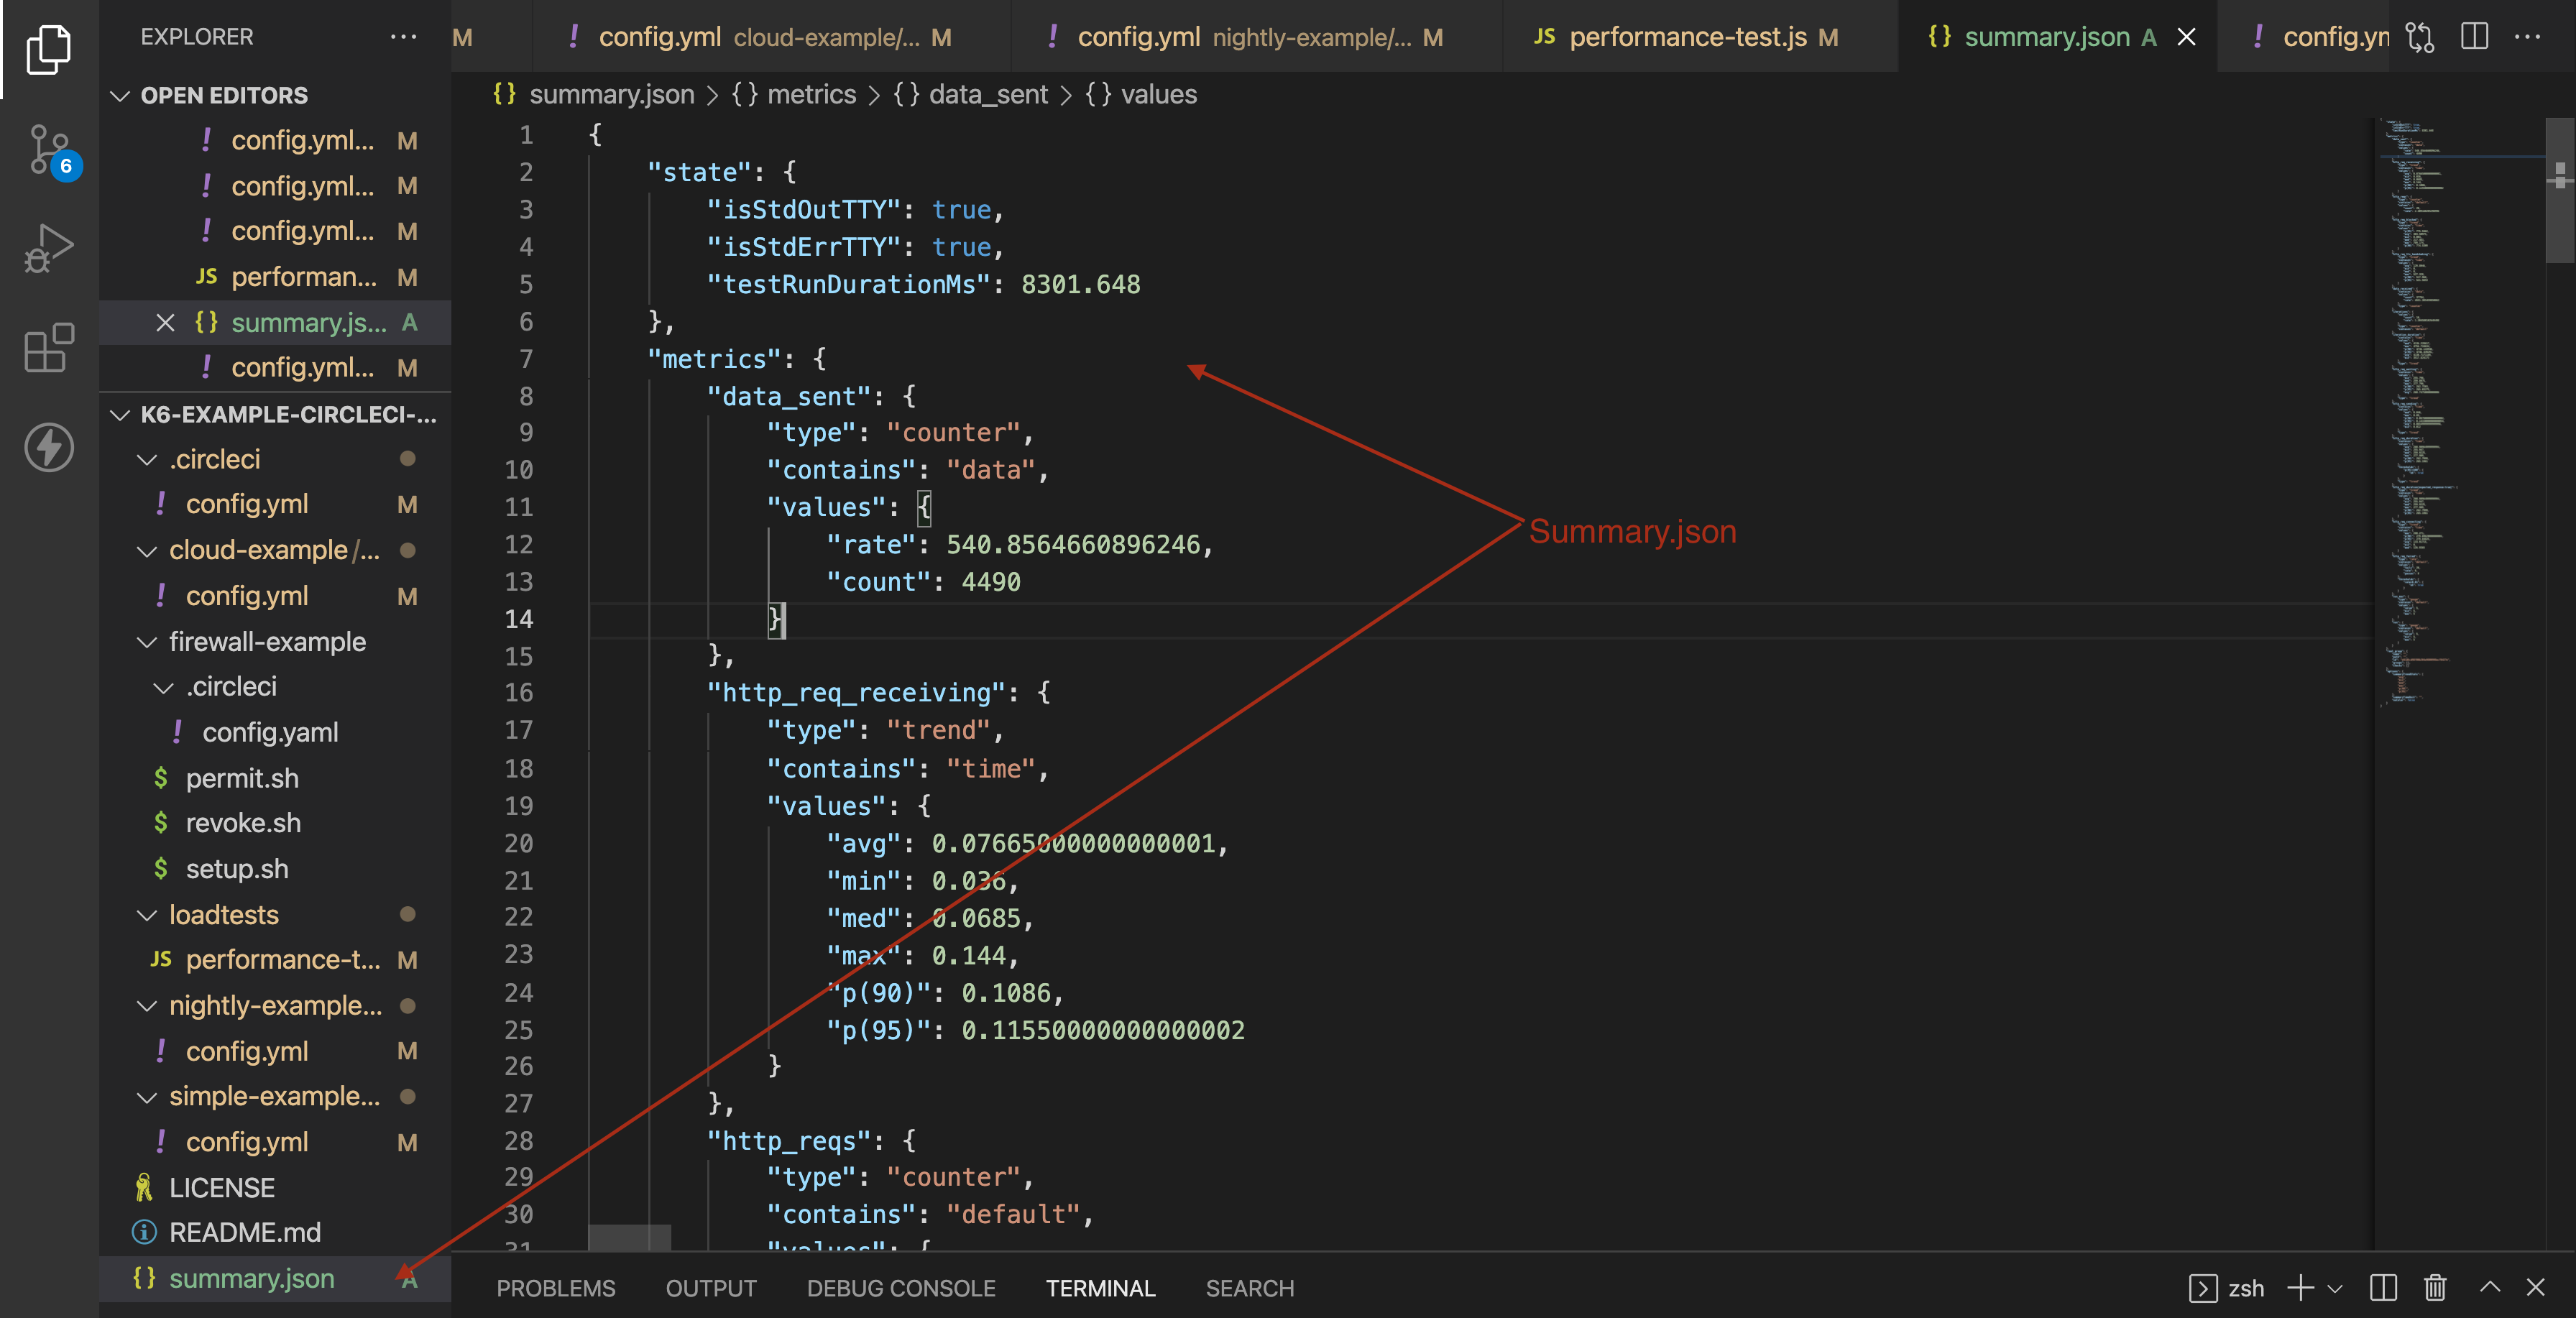
Looking at the execution, we can observe that our console statement appeared as an INFO message. We can also verify that a summary.json file was created after we finished executing our test as shown below. For additional information, you can read about the handleSummary callback function here.
          /\      |‾‾| /‾‾/   /‾‾/
     /\  /  \     |  |/  /   /  /
    /  \/    \    |     (   /   ‾‾\
   /          \   |  |\  \ |  (‾)  |
  / __________ \  |__| \__\ \_____/ .io

  execution: local
     script: loadtests/performance-test.js
     output: -

  scenarios: (100.00%) 1 scenario, 5 max VUs, 1m0s max duration (incl. graceful stop):
           * default: 10 iterations shared among 5 VUs (maxDuration: 30s, gracefulStop: 30s)


running (0m08.3s), 0/5 VUs, 10 complete and 0 interrupted iterations
default ✓ [======================================] 5 VUs  08.3s/30s  10/10 shared iters
INFO[0009] Finished executing performance test           source=console
     data_received..................: 38 kB  4.6 kB/s
     data_sent......................: 4.5 kB 541 B/s
     http_req_blocked...............: avg=303.5ms  min=3µs      med=217.48ms max=789.17ms p(90)=774.53ms p(95)=775.94ms
     http_req_connecting............: avg=133.91ms min=0s       med=126.93ms max=280.27ms p(90)=279.69ms p(95)=279.84ms
   ✓ http_req_duration..............: avg=260.9ms  min=255.94ms med=259.92ms max=277.9ms  p(90)=262.79ms p(95)=265.19ms
       { expected_response:true }...: avg=260.9ms  min=255.94ms med=259.92ms max=277.9ms  p(90)=262.79ms p(95)=265.19ms
   ✓ http_req_failed................: 0.00%  ✓ 0       ✗ 20
     http_req_receiving.............: avg=76.65µs  min=36µs     med=68.5µs   max=144µs    p(90)=108.6µs  p(95)=115.5µs
     http_req_sending...............: avg=85.49µs  min=12µs     med=46µs     max=890µs    p(90)=87.8µs   p(95)=143.3µs
     http_req_tls_handshaking.......: avg=129.8ms  min=0s       med=0s       max=527.32ms p(90)=517.96ms p(95)=521.56ms
     http_req_waiting...............: avg=260.74ms min=255.79ms med=259.8ms  max=277.79ms p(90)=262.72ms p(95)=265.03ms
     http_reqs......................: 20     2.40916/s
     iteration_duration.............: avg=4.13s    min=3.51s    med=4.13s    max=4.75s    p(90)=4.73s    p(95)=4.74s
     iterations.....................: 10     1.20458/s
     vus............................: 5      min=5     max=5
vus_max........................: 5 min=5 max=5% 
On observation, we can verify that the summary.json is an overview of all the data that k6 uses to curate the end of the test summary report, including the metrics gathered, test execution state, and also test configuration.
Running k6 extensions
k6 extensions enable users to extend the usage of k6 with Go-based k6 extensions that can then be imported as js modules. With extensions, not only are we able to build functionality on top of k6, but also create a door for limitless opportunities to extend k6 to custom needs.
For this section, we will set up a Docker environment to run our k6 extension. In our case, we will utilize a simple extension xk6-counter, which we set up on Docker with the following snippet.
FROM golang:1.17-alpine as builder
WORKDIR $GOPATH/src/go.k6.io/k6
ADD . .
RUN apk --no-cache add git
RUN go install go.k6.io/xk6/cmd/xk6@latest
RUN xk6 build --with github.com/mstoykov/xk6-counter=. --output /tmp/k6

FROM alpine:3.14
RUN apk add --no-cache ca-certificates && \
    adduser -D -u 12345 -g 12345 k6
COPY --from=builder /tmp/k6 /usr/bin/k6

USER 12345
WORKDIR /home/k6
ENTRYPOINT ["k6"]
We will also have a file counter.js on the root directory that will demonstrate how we can extend k6 using the extensions.
To execute our tests with the extension, we will create a docker-compose file, as the above will build our image and not execute our tests. For the purposes of this tutorial, we will build our image as xk6-counter:latest. Once this is done, we can use the image in our docker-compose file to run the counter.js file located under the loadtests folder in the root directory as below:
version: '3.4'
services:
 k6:
   build: .
   image: k6-example-circleci-orb
   command: run /loadtests/counter.js
   volumes:
     - ./loadtests:/loadtests
The snippet above can also be found in the cloned repository in the docker-compose.yml file and executed with the following command:
docker-compose run k6This command should then execute the counter.js file, which makes use of the xk6 counter extension. The dockerfile above and the docker-compose file can be utilized to execute other extensions and should only serve as a template.
To execute tests with extensions on CircleCI, we will push our Docker image to Docker Hub then use that image when executing our tests in CircleCI. We can then use the image to execute the tests, as shown below in the snippet:
version: 2
jobs:
  test:
    docker:
      - image: your_org/your_image_name  # You can rebuild this image and push it to your docker hub account
    steps:
      - checkout
      - setup_remote_docker:
          version: 19.03.13
      - run:
        name: Execute tests on the docker image
        command: k6 run loadtests/counter.js
workflows:
  build-master:
    jobs:
      - test
Conclusion
In this tutorial, we have learned how to execute a basic k6 test, how to integrate k6 with CircleCI and execute tests on the CI platform, how to execute cloud tests, and how to execute k6 extensions with xk6. We also learned how we can use other workflows, such as nightly builds and k6 outputs using the summary flag, or the new k6 handleSummary callback option. With all that covered, we hope you enjoyed reading this post as much as we did creating it. We’d be happy to hear your feedback.
Grafana Cloud is the easiest way to get started with Grafana k6 and performance testing. We have a generous forever-free tier and plans for every use case. Sign up for free now!


