New in Grafana 8.4: How to use full-range log volume histograms with Grafana Loki
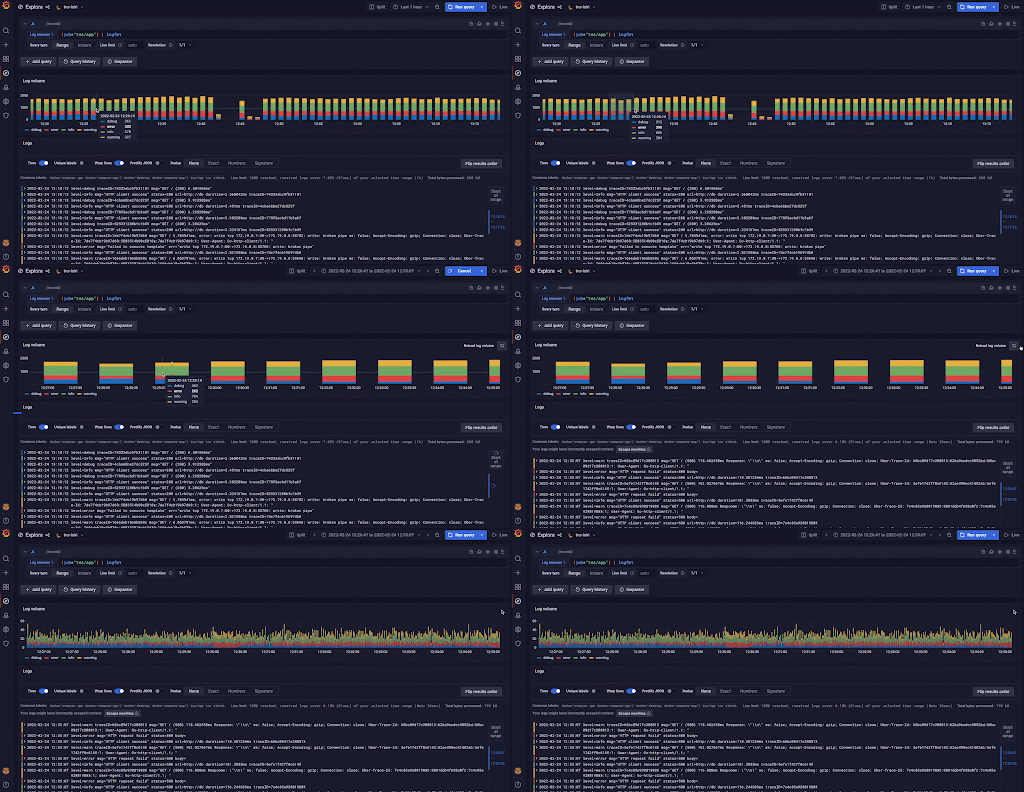
In the freshly released Grafana 8.4, we’ve enabled the full-range log volume histogram for the Grafana Loki data source by default. Previously, the histogram would only show the values over whatever time range the first 1,000 returned lines fell within. Now those using Explore to query Grafana Loki will see a histogram that reflects the distribution of log lines over their selected time range.
If you are eager to learn more about log volume and learn some tips and tricks, we got you covered here!
Note: The full-range log volume histogram for the Loki data source can still be disabled by setting Grafana’s Full RangeLogsVolume feature toggle to false. The only reason we anticipate users will choose to do this is because the full-range histogram puts increased query load on Loki. Feedback from early OSS adopters plus our own internal testing is that the load increase shouldn’t be problematic, but we are retaining the feature toggle as a safety shutoff for now. We intend to remove it in Grafana 8.5.
1. What does the log volume show you?
It shows the distribution of log lines over their selected time range. Under the hood it runs the following query sum by (level) (count_over_time({log query}[log volume interval])). Grafana automatically adjusts the interval based on the selected time span to simple and user-friendly values (e.g., 1 minute, 1 hour, 1 day).
2. Zooming in
Zooming in doesn’t trigger a new query; that way you are not unnecessarily running new queries if you don’t want to. However, if you want to see the distribution of your log lines in more detail, you can always use the “Reload log volume” button and run a new log volume query with an updated resolution that shows you the distribution of your logs in more detail.

3. How to see log volume with levels
If the log level is in your log line, try to use parsers (JSON, logfmt, regex,..) to extract level information into the level label that is used to determine log level. This way, the log volume histogram will show a stacked bar chart representing the various log levels. You can find a list of supported log levels and mapping of log level abbreviation and expressions here. If the label used to denote level has a different name than level you can use label_format function to rename your label to level. For example, if you use the label error_level to indicate level information, you can use the following query to rename it to level and get the stacked bar chart histogram: {error_level="WARN"} | json | label_format level=error_level. Try it out live on our play site!

4. How to handle pipeline processing errors
In LogQL, you can get pipeline processing errors for a variety of reasons. One common case occurs when you use a parser (e.g., | logfmt, | json) and not all your log lines follow the format you’re trying to parse. For example, you’ll get pipeline processing errors if your query includes | json, but scans some log lines that aren’t valid json documents.
Because the log volume histogram runs a metric query under the hood, and metrics queries fail if any pipeline processing errors occur, the log volume histogram will fail to render if there are any pipeline processing errors in your original query.
To work around this, you can skip log lines that throw errors by adding __error__ = "" to your original query. When you do this, the log volume histogram you see will represent the distribution of the non-erroring lines.
Say you ran the query {filename="/var/log/nginx/access.log"} | logfmt but the histogram failed to load because of pipeline processing errors. Maybe, for example, only some of the lines were in logfmt format. By updating your query to
{filename="/var/log/nginx/access.log"} | logfmt | __error__ = "" the log volume histogram will now load. It will show you the distribution of log lines in /var/log/nginx/access.log that the logfmt parser was successfully applied to, ignoring the others.
For more information, see “Pipeline Errors” in the LogQL documentation.
Tell us what you think!
We hope that you’ll find the new full-range log volume histogram useful, and we are looking forward to hearing your feedback on how you use it and how you think we can improve it even more! Find us on the Grafana Labs Community Slack.


