Introducing exemplar support in Grafana Cloud, tightly coupling traces to your metrics
We’ve talked in previous posts about why we think the concept of exemplars are so valuable: They make it easy to jump from metrics into exactly the right traces, eliminating the needle in the haystack problem.
We were enthusiastic enough about the idea that we helped contribute the necessary code changes to bring this functionality to the Prometheus ecosystem. Now we’re excited to announce that we’ve extended that functionality to Grafana Cloud Metrics, our horizontally scalable, long-term Prometheus storage backend in Grafana Cloud.
What’s an exemplar?
Exemplars allow you to pivot from a metric into a trace that “exemplifies” that metric, providing yet another way to move among your various types of telemetry data.
In the screenshot below, you’ll see a Prometheus datasource showing the 99th percentile latency of requests to an application. The exemplars are the dots peppering the line plot.

Studying the plot, I see that my p99 latency is periodically spiking. The natural question I then ask is why? What’s going on with these slow requests?
With exemplars, I can immediately dive into one of these slow requests to start answering my questions. I just hover over a dot I’m interested in — namely one with high latency — and click Query with Tempo. The screen splits and displays the Gantt chart of a representative trace.

How do exemplars work?
Under the hood, exemplars work by attaching trace IDs to metrics. Borrowing from my colleague Richard “RichiH” Hartmann’s prior post, a histogram metric with exemplar annotations might look like this:
# TYPE request_duration_seconds histogram
request_duration_seconds_bucket{le="0.1"} 8 # {trace_id="AAA5S4ois0o"} 0.054
request_duration_seconds_bucket{le="1"} 11 # {trace_id="KOO5S4vxi0o"} 0.67
request_duration_seconds_bucket{le="10"} 17 # {trace_id="oHg5SJYRHA0"} 9.8
The exemplar annotation is everything after the #. In the example above, if you want to see a trace with a request duration of less than or equal to 0.1 seconds, you know you can look at trace_id AAA5S4ois0o , which took 0.054 seconds.
The work to enable histograms in Prometheus focused on creating a way to store and query back these annotations. Extending histogram support to Grafana Cloud Metrics required pulling in the Prometheus changes and making them work there.
How to get started with exemplars
Leveraging the power of exemplars has a few requirements:
- Your applications need to be emitting traces.
- Your applications need to include those trace IDs in their calls to emit metrics.
- You need a place to store your metrics (e.g., Prometheus) and your traces (e.g., Grafana Tempo), and a Grafana instance that is configured to talk to both of them.
If it sounds like a lot, do not fear! Make your way over to the TNS-Demo, which provides an amazing example of how this all works together.
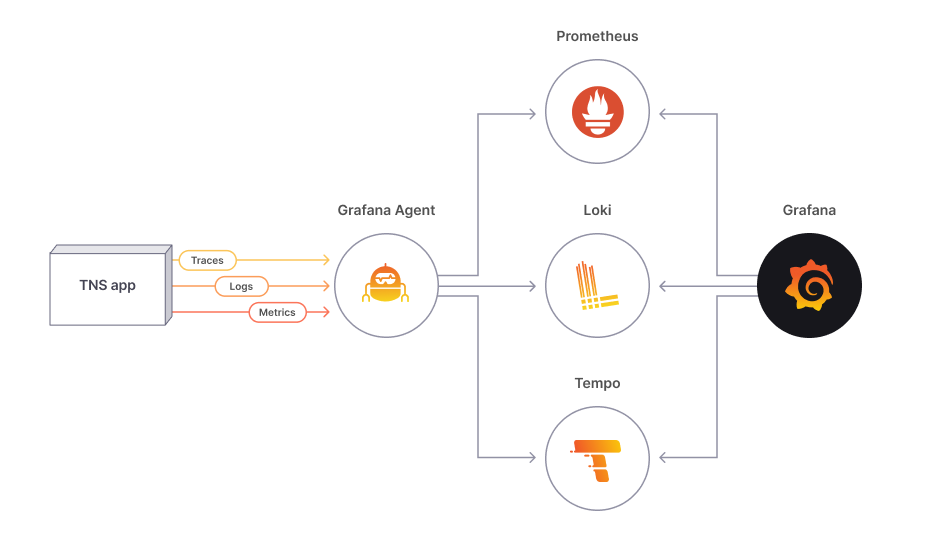
The TNS (“The New Stack”) app is a simple three-tier application that is instrumented to expose metrics (with exemplars), logs (not relevant for the purpose of this post), and traces. The demo deploys a Grafana Agent to collect all that telemetry data and push it to metric, log, and trace backends for storage – namely Prometheus, Grafana Loki, and Grafana Tempo. It also deploys Grafana with pre-built dashboards that have exemplars already layered in.

The diagram above shows a sample observability stack that collects telemetry data from a sample app (TNS app). Prometheus stores metrics, Grafana Loki stores logs, and Grafana Tempo stores traces. Grafana provides a visualization layer to query it all.
(As an aside, while Prometheus is primarily a pull-based architecture, we’re leveraging its ability to receive remote writes with this demo).
Now that we’ve enabled exemplars in Grafana Cloud, it’s easy to tweak this demo to see what exemplars would look like in our fully managed observability stack.

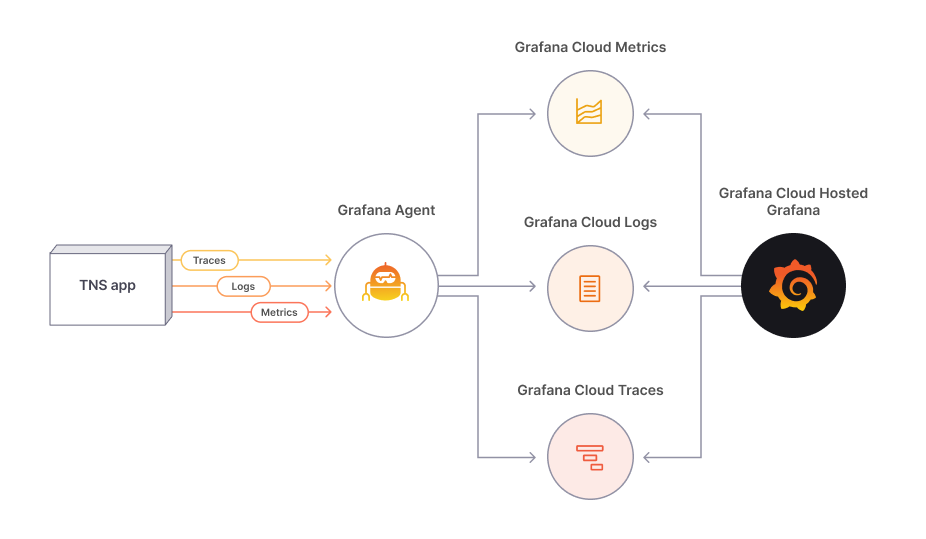
Grafana Cloud users can send telemetry data collected by the Grafana Agent directly to our hosted logs, metrics, and traces services, so they no longer have to maintain OSS Prometheus, Grafana Loki, and Grafana Tempo. The overhead of this transition is minimal since Grafana Cloud is 100% compatible with OSS.
All you have to do is update the remote_write destinations in the demo’s Grafana Agent configuration to point to Grafana Cloud instead of the local Prometheus and Tempo instances, send a short note to support@grafana.com to enable exemplars on your Grafana Cloud account (this is included for all account tiers), and off you go!
metrics:
    configs:
      - name: kubernetes-metrics
        remote_write:
          - send_exemplars: true
            url: https://prometheus-us-central1.grafana.net/api/prom
            basic_auth:
    	      username: <Your Grafana.com Username>
password: <Your Grafana.com API Key>traces:
configs:
remote_write:
- endpoint: tempo-us-central1.grafana.net:443
basic_auth:
username: <Your Grafana.com Username>
password: <Your Grafana.com API Key>How exemplars will work in the Grafana Enterprise Stack
Grafana Enterprise Stack users will see exemplar support in Grafana Enterprise Metrics (GEM) introduced in the next release, and the changes needed will be virtually identical. Simply update the URL and basic auth information for the Grafana Agent’s metrics configuration to point to your GEM cluster and provide it the proper token and tenant name.
Since our stack is fully OSS compatible, the exemplars workflow will work for those using GEM + OSS Tempo, as well as those using GEM + Grafana Enterprise Traces (GET).

The diagram above shows how users running Grafana Enterprise Metrics — our self-hosted solution for users looking for scalable, long-term Prometheus-compatible metrics storage — will be able to store exemplars sent by the Grafana Agent or Prometheus in the next release.
Conclusion
We’re excited to add support for exemplars to Grafana Cloud Metrics because it gives our users a new way to move from metrics to traces. We believe that the better the connections among your metrics, logs, and traces, the easier it is for you to take advantage of the unique strengths each telemetry type has to offer. Thus, it will also be easier for you to find the root cause of incidents and resolve them faster.
Ready to send us your exemplars? Check out the docs for more information on how to get started in Grafana Cloud.
If you’re not already using Grafana Cloud — the easiest way to get started with observability — sign up now for a free 14-day trial of Grafana Cloud Pro, with unlimited metrics, logs, traces, and users, long-term retention, and premium team collaboration features.


