How secure is your Grafana instance? What you need to know
One of Grafana’s most powerful features is the ability to funnel data from hundreds of different data sources (i.e., services or databases) into a single dashboard without migrating the data from where it lives. You can connect and correlate data from Grafana’s curated observability stack for metrics, logs, and traces, or third-party services, such as Splunk, Elasticsearch, Github, Jira, and many more.
But in order to ensure security and privacy while using Grafana as a dashboarding solution or as a single pane of glass for your observability, all of these data sources need to be protected as well. Luckily it’s easy to safeguard your Grafana instances and all its data sources.
Defining security in Grafana
Grafana is a web service. In its simplest form, a web service does something for you. You request information from the service, and the service responds with the information you asked for by querying the backend (i.e., a database or another web service). We all know that data, in general, is precious and needs to be protected; thus, both the database as well as the service need to have some kind of security. But what does “security” actually mean?
What I stumbled across multiple times that helped me understand what security means were the so-called 4 A’s of security — or sometimes 3, or sometimes 5, depending on how much the categories are overlapping. I’m going with 4 A’s and an added E:
- Authentication verifies who you are and thereby proving someone’s identity.
- Authorization will let you know what you’re allowed to do, including if you’re allowed to use the service at all.
- Audit keeps track of it all to answer questions later regarding the former two.
- Administration refers to the configuration and (ease of) access of the former three.
- Encryption can mean a lot of different things. Generally, data can be encrypted, whether it’s stored somewhere, kept in memory, or transmitted between services.
You can easily apply these concepts to any service or database. In this article, I’ll talk about how to apply them to Grafana: which options you have to authenticate, to authorize, how you can audit security events, and what can be encrypted. Wherever possible, I will not reproduce documentation that already exists, but refer to it and explain how things are connected.
Authentication
Grafana supports a huge range of options to authenticate users. They range from “anonymous” mode, which is basically “no authentication” and not recommended for production. The publicly hosted dashboard at “https://play.grafana.com” — a showcase using dummy data to introduce people to various Grafana features — does not use any authentication and is probably the only deployment where it actually makes sense to do anonymous authentication.
On the opposite end of the spectrum, another authentication option is to give all users access as the Grafana admin and potentially not even change the default password (“admin”). This works out of the box, but it’s also not recommended for obvious reasons.
In between, you probably have almost all the options when it comes to authentication. A full list of authentication options that are available is listed in the documentation.
So, which authentication method should you use? The easy answer to that question is whatever your standard is in your organization. If you are generally using an Active Directory and you manage your users and groups using the LDAP protocol, you should configure Grafana to use your LDAP provider. LDAP authentication is one of the authentication methods that is available in the OSS version of Grafana.
If SingleSignOn (SSO) is important to you, you should be looking into token-based authentication methods. Again, start using the Identity Providers (IdP) that are available in your company unless you have the need to use features that are only available for specific IdPs. The SAML protocol and OAuth protocol have different configuration options that you might want to consider in your choice.
If your default company IdP does not have the capabilities you’re looking for, check out the docs or get in touch with one of my colleagues at Grafana Labs to help you choose the authentication method that works for you.

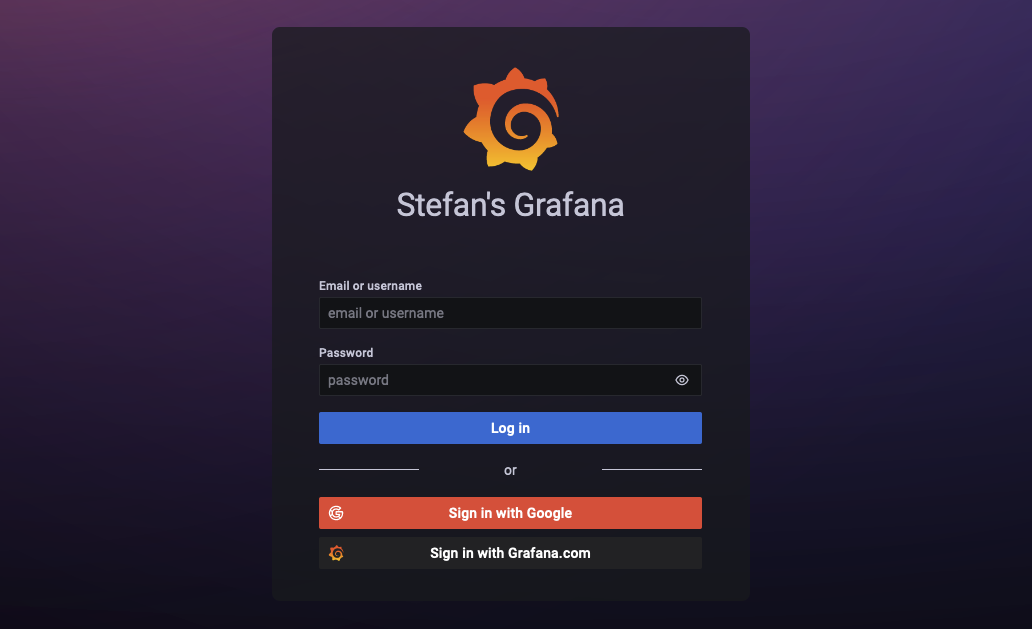
In the login screen above, you can see that multiple options are configured to authenticate yourself upon login: username and password potentially from an LDAP source, a Google OAuth2 provider, and another OAuth option using your Grafana.com account.
Advanced authentication features
Some advanced authentication methods are included in the Grafana Enterprise version. This is specifically true for SAML authentication for self-hosted Grafana environments, as well as the various OAuth options that are only included in the paid options of our Grafana Cloud offering.
Grafana Enterprise allows you to do many other useful things to make the lives of admins in large organizations easier.
- Grafana Enterprise enhances the LDAP integration by allowing you to synchronize users and groups actively in the background as opposed to synchronization upon user login. This makes the system more consistent and secure, because group assignment changes are reflected faster.
- Grafana Enterprise allows you to synchronize groups from your LDAP, OAuth, and SAML IdPs with your Grafana teams. This will make it much easier to manage and configure authorization because each Grafana team corresponds to one or more IdP groups.
Authorization
Grafana allows you to do many things. Among them you can:
- create and edit dashboards
- view dashboards
- create and manage alerts
- view alerts
- add hundreds of different data sources
- access and explore data from these data sources
- create reports
Not everyone should be allowed to do all of these actions. All users are assigned one of four standard roles: the Grafana Admin, Admin, Editor, and Viewer. Each comes with a set of predefined permissions for these actions.
In addition to their standard permissions, access can be configured on a per-resource basis. For example, each user can be given access to view or edit specific dashboards or dashboard directories.
To make managing permissions easier, there are teams. Each user can be assigned to one or multiple teams, and teams can be used to assign permissions on dashboards. With this simple model, you can go a long way. However, if you need further control over who is allowed to do what, you can take a look at the advanced features included in Grafana Enterprise.
Advanced authorization features
In Grafana Enterprise or the paid Grafana Cloud options, you get access to more advanced features to tackle authorization.
- One of the most important features is data source permissions. By default, any role could potentially access all data sources configured in Grafana with the same access level to the backend that is configured in the data source. Furthermore, any role, even the Viewer, could potentially randomly query these data sources. Data source permissions allow you to decide which user or team is able to query which data source and thereby help restrict the number and the groups of users who can access the data.
- Fine-grained access control (FGAC) is currently in beta and rapidly growing in features as well as constantly improving in regards to user experience. It allows you to create new roles and define a certain set of permissions for each of these roles. If the four default roles don’t meet your organization’s needs, you can assign every user individual fixed or custom roles to define exactly what they are allowed to do on a fine-grained basis. Examples from the documentation include giving certain users the ability to create reports or not allowing them to invite other users to use the Grafana instance. Grafana 8.3 added this functionality to the user interface, and Grafana 8.4 adds FGAC functionality to Grafana teams.
- I’ve already mentioned team sync in the authentication section. The value of keeping teams and Identity Provider groups in sync is that any user you add or remove to these external groups inherit the Grafana teams’ permissions and thereby keeps your efforts to manage these teams to a minimum.

In this data source permissions example above, only a user with the name “albert” as well as the users in the team “IT Department” have read access to data from the Google Cloud Monitoring data source.
Audit
Auditing is important for many reasons. On the one hand, there are specific legal requirements for organizations to be able to tell who has accessed which resource in Grafana. On the other hand, from a security perspective, we know from experience that even users with legitimate access can cause incidents, more often than not unintentionally. So if there’s a breach (or really when there’s a breach), we need to be able to tell what happened, who did it, when it happened, and, if possible, why and how it happened. This is important to make sure the incident never happens again.
Grafana Enterprise and the Grafana Cloud Advanced tier come with detailed logs to answer exactly these questions. Furthermore, you can forward these logs to Grafana Loki, which allows you to store them for as long as you require them as per your company’s policies as well as use them to create meaningful security audit dashboards.

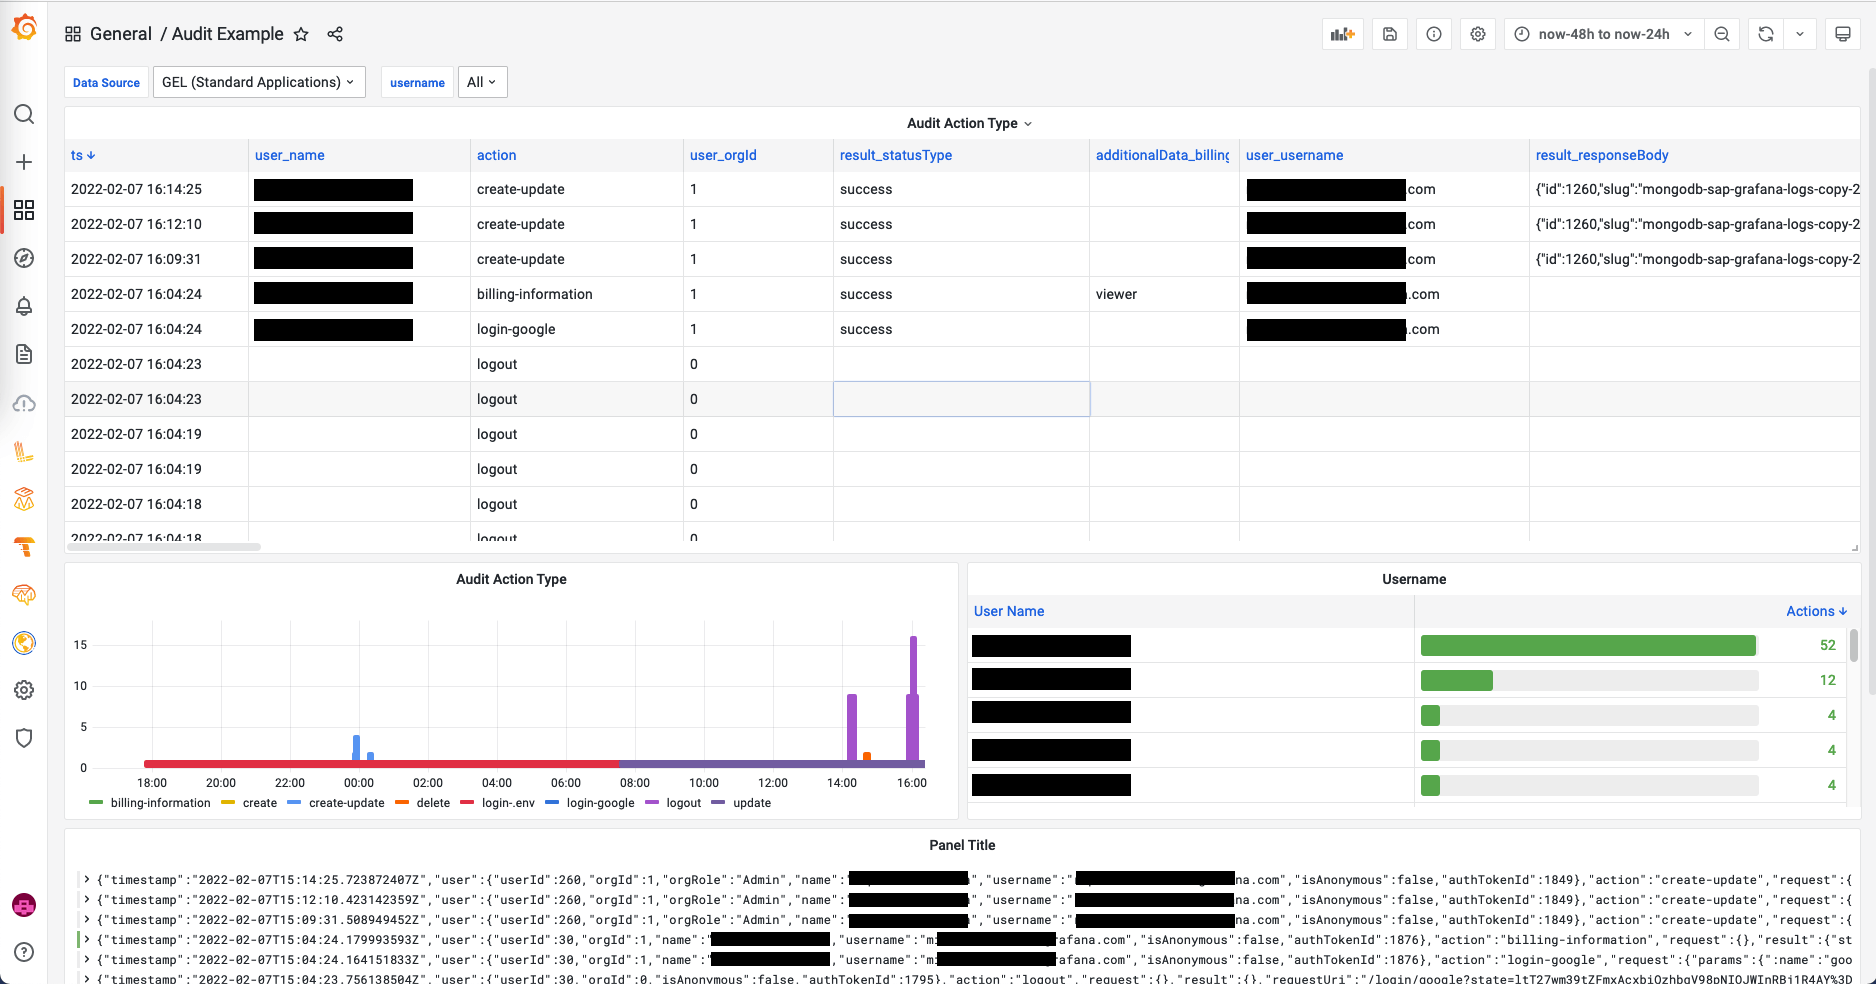
This picture shows an example of an audit dashboard with entries that show that some users were logging in and out, gained access to billing information, or updated data sources.
With this setup, you have endless options and can use the full power of Grafana to manage, aggregate, and visualize its own audit logs.
For example, you could display the number of failed login attempts per user. You could track down who created or deleted certain data sources or who changed the permissions on certain dashboards. A full list of supported actions can be found in the documentation.

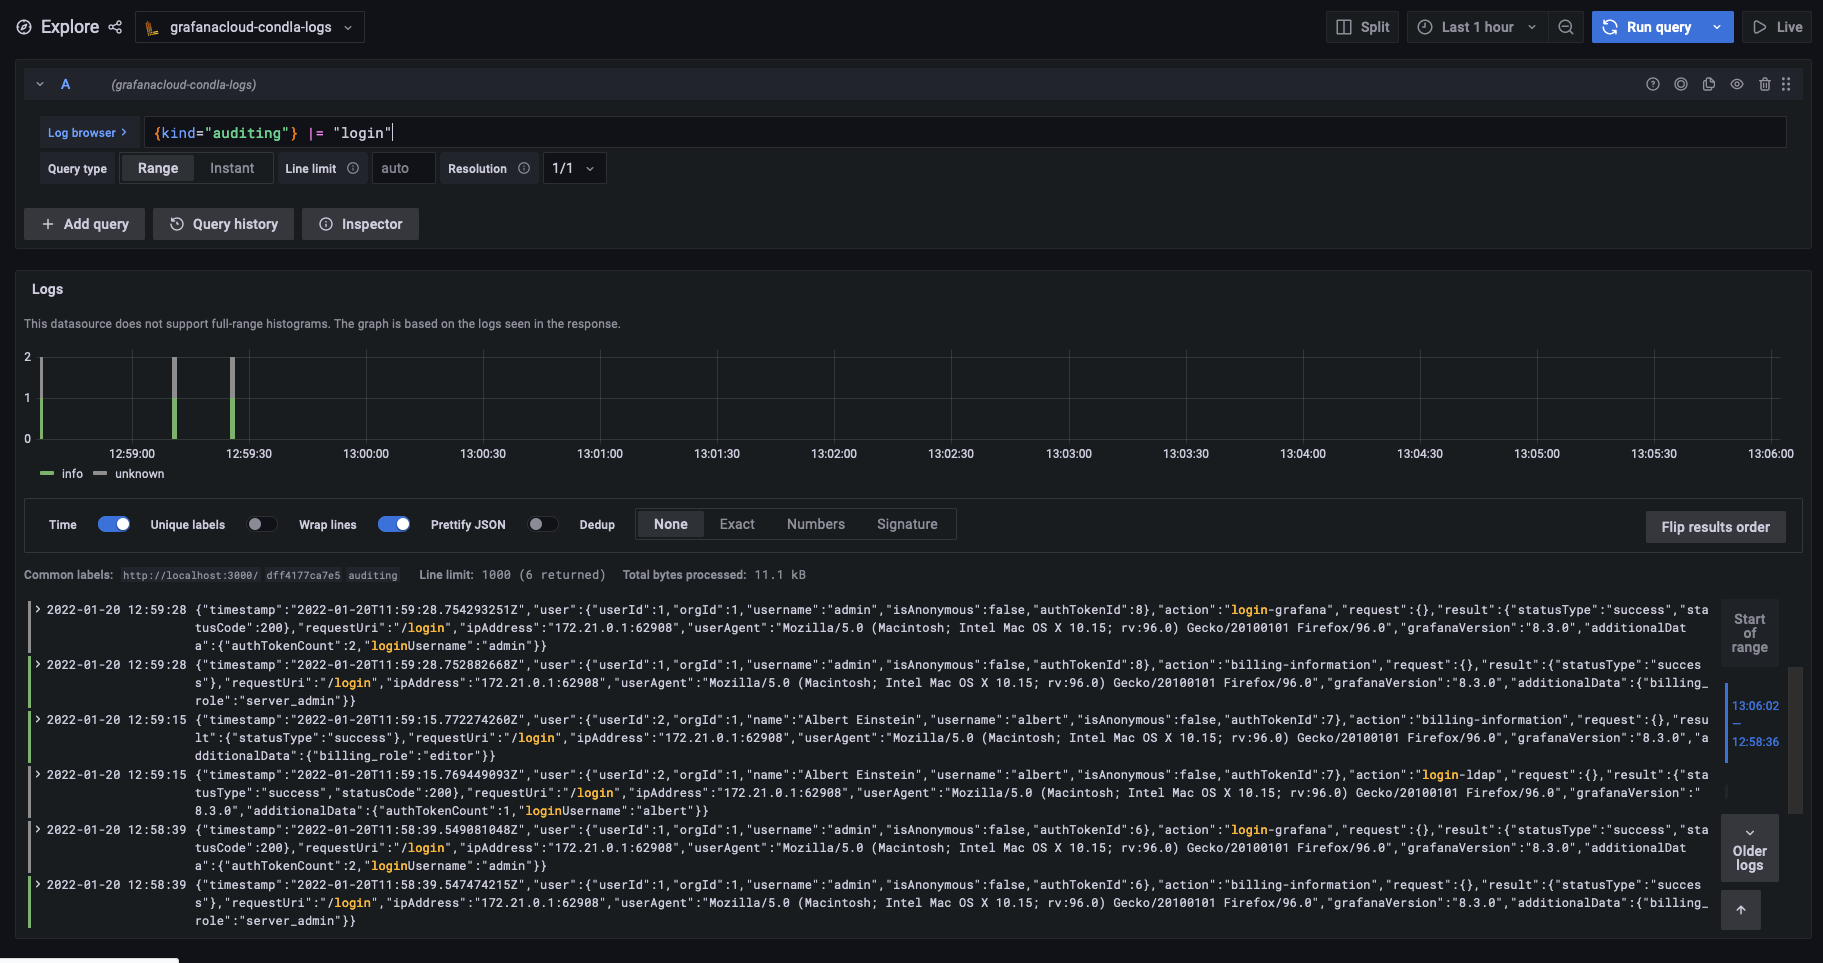
The audit capabilities are well integrated into Grafana itself. Here, you can see a simple Loki query to show the login events to the Grafana instance in the last hour.
Administration
The cool stuff about everything I’ve described so far is that you don’t need to leave the Grafana interface to manage all these aspects. The management of users, teams, external groups, fine-grained access, and custom audit dashboards can be done within the Grafana interface.
Thus, Grafana can be seen as a true single pane of glass, not only with respect to its ability to connect to hundreds of different data sources and visualize them next to each other in one dashboard, but also because of its capability to manage and visualize its own security aspects.
Encryption
Encryption helps prevent third parties from being able to make sense of data that they may have accidentally or intentionally gained access to, even though they shouldn’t have based on the mechanisms we’ve just discussed.
There’s a lot of information that you might want to encrypt:
- The communication between the users and the Grafana instance (protocol: https)
- The communication between Grafana and the supporting databases (“ssl_mode”)
- The communication between Grafana and its data sources. For these, you need to make sure to use valid certificates and configure the serving layers to use them. Please refer to the documentation of the data source to enable encrypted communication.
These types of “wire encryption” are pretty standard processes and easy to configure for Grafana as well as the database instances.
Another thing you want to encrypt are sensitive values, such as usernames and secrets that are stored in the Grafana configuration file. You can do this by leveraging the Hashicorp Vault integration.
For secrets that are stored in the Grafana database, you can use an external Key Management System (KMS) to encrypt them. Until recently, Grafana only supported AWS KMS and Azure Key Vault. With the release of Grafana 8.4, you can also use Google Cloud KMS and Hashicorp Vault for this.
Summary
Grafana makes it easy for you to secure your instance by providing what you need out of the box. You first need to make a decision on the identity provider. Then you need to think about an access model that fits the access patterns of the users, teams, and roles in your organization, and implement it. Ideally, you will configure sending your audit logs to Grafana Cloud Logs (this is the default for Grafana Cloud) and encrypt anything worth encrypting.
Security tends to be a daunting task, and it’s often difficult to see the immediate need to dedicate time and resources to set up the right parameters or infrastructure at the outset. This short overview should equip you with the right knowledge to properly secure your Grafana instance before an incident occurs and help prevent accidents or vulnerabilities from happening.


