Learn how to get started with Grafana Cloud, Grafana OnCall, Grafana Tempo, and the Grafana Stack
Are your metrics, logs, and traces playing hard to get in your current observability setup? Feel like your on-call messages are left on read? Is the heatmap between your data sources fizzling out on your dashboard?
As our valentine to the community, Grafana Labs is hosting free webinars throughout February that will help you fall in love with observability, on-call management, distributed tracing, and more — whether you’ve been in a long-term relationship with your stack or you’ve just dipped your toe in the data visualization pool.
Our engineers and experts will help you navigate the basics and best practices for Grafana Cloud, your fully managed observability stack; Grafana OnCall, an easy-to-use, developer-first on-call management tool; Grafana Tempo for traces; and the Grafana Stack with Grafana, Prometheus, Grafana Loki, and Grafana Tempo.
In the end, your connection to all your monitoring tools will be next level, and your commitment to your observability strategy will be stronger than ever.
Grafana Cloud: Deep dive and demo
Thursday, February 17
9:30 PST, 12:30 EST, 17:30 UTC
Looking to reduce the overhead of installing, maintaining, and scaling your own observability stack? Enter Grafana Cloud, a fully managed, composable observability platform that allows you to leverage the best open source observability software – including Grafana, Prometheus, Grafana Loki, and Grafana Tempo – with none of the hassle.
In “Getting started with your metrics, logs, and traces in Grafana Cloud,” Grafana Labs’ technical pro James Williams will give a live demo of how to ship data from your favorite data sources and instantly visualize everything in Grafana Cloud. You’ll also learn more about synthetic monitoring and how to bring together data from external sources such as Datadog or Dynatrace.

Grafana Tempo: Intro to distributed tracing (EMEA timezone)
Wednesday, February 23
10:00 CET, 09:00 UTC
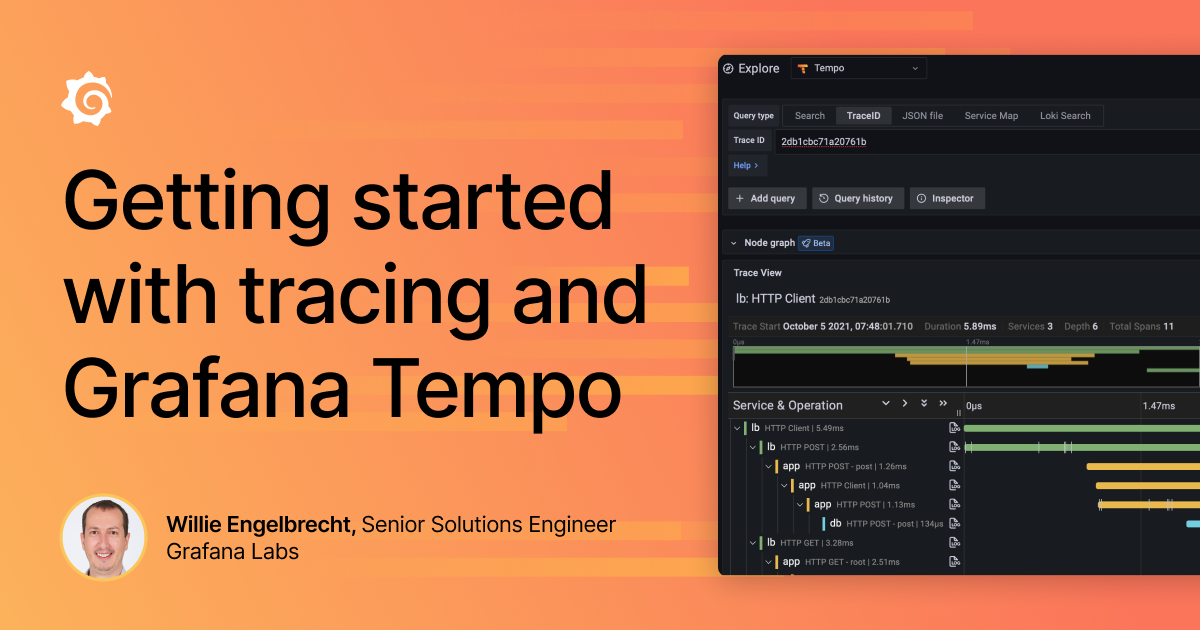
Grafana Tempo is a high-volume distributed tracing backend that provides incredible scale without a difficult-to-manage Elasticsearch or Cassandra cluster. During our “Getting started with tracing and Grafana Tempo” webinar, Grafana Labs’ technical expert Willie Engelbrecht will walk you through the basics of operating Grafana Tempo and explain how Tempo allows for massive scale with minimal costs.
We will then use an instrumented application to demonstrate how to use logs and Prometheus exemplars to find traces effectively in Grafana Tempo. You’ll also get the inside scoop on what’s coming next for Grafana and Prometheus exemplar support.

Introducing Grafana OnCall: Improving on-call management and incident resolution
Wednesday, February 23
9:30 PST, 12:30 EST, 17:30 UTC
Grafana OnCall — which is now generally available with all Grafana Cloud free and paid plans — was built to help DevOps and SRE teams improve their on-call management process and resolve incidents faster. With Grafana OnCall, users can create and manage on-call schedules, automate escalations, and monitor incident response from a central view, right within the Grafana Cloud UI.
In our practical “Getting started with Grafana OnCall” webinar, Grafana Labs’ Senior Engineering Manager Matvey Kukuy will walk you through the initial configuration and show you how to connect Grafana OnCall with sources such as Alertmanager, Zabbix, New Relic, or Datadog. There will also be discussions on how to set up an efficient on-call management process with a closer look at how to fine-tune grouping and alert rendering within the tool to avoid alert storms.

Grafana Stack: How to correlate metrics, logs, and traces
Thursday, February 24
9:30 PST, 12:30 EST, 17:30 UTC
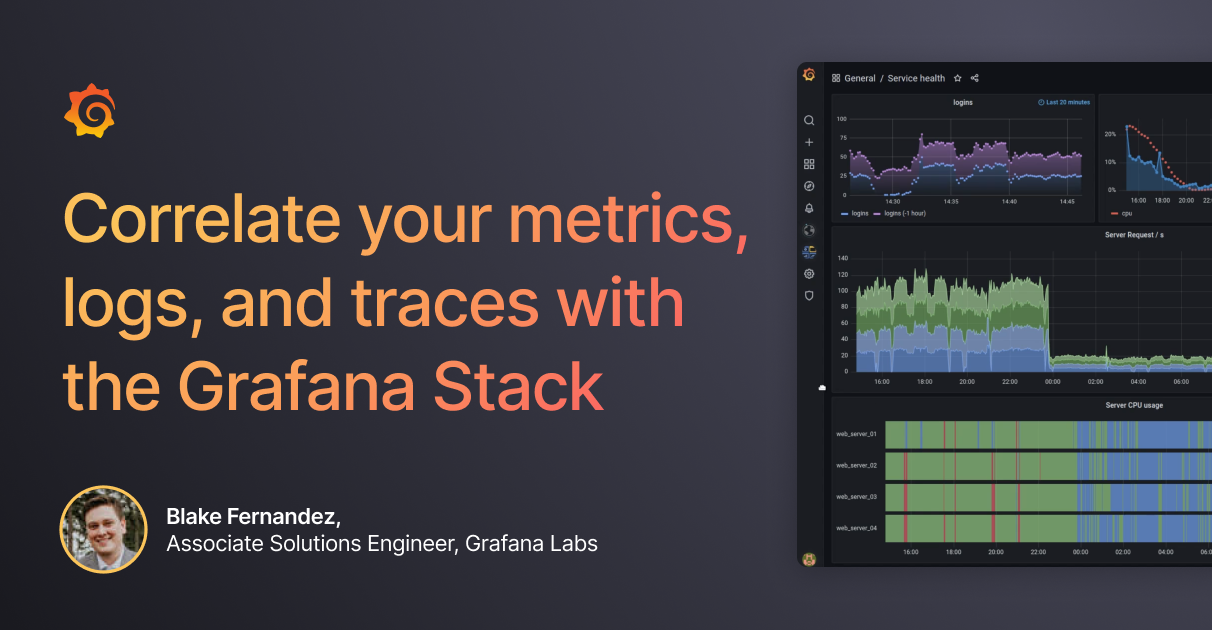
At Grafana Labs, we believe that users should have the freedom to use the tools they know and love. In our “Correlate your metrics, logs, and traces with the Grafana Stack” webinar, Grafana Labs solutions engineer Blake Fernandez will talk about how to collect metrics, logs, and traces from different data sources and visualize all of them together in Grafana, allowing you to reduce MTTR and focus your time and energy on the projects that have the most impact on your business.

Check out all of our webinars and on-demand conference videos for in-depth demos, deep dive discussions, helpful Q&As, and more!


