Real-time drone tracking and management with Grafana
The number of internet-connected assets around us that are powering services and utilities in a wide array of sectors is rising at an exponential rate. As a result, it’s becoming critical for businesses that provide such services and utilities to have an observability stack tailored to the type of physical hardware devices that are generally deployed in swarms. Historically, two major features supporting such applications — real-time sensor data ingestion and manual remote control of hardware — have not been supported natively in Grafana. Those capabilities, however, are absolutely essential for physical observability applications.
Addressing that issue is the goal of the Edge team here at Grafana Labs.
Looking at the world of software observability (which is inspired by the concept of system observability in dynamic mechanical systems), we can easily draw key parallels to hardware observability when it comes to a number of applications: autonomous inspection drones, delivery robots, manufacturing rigs, distributed power plants, and more. The golden triangle of observability for software monitoring — metrics, logs, and traces — roughly translates to real-time sensor data, long-term aggregate data retention, and threshold-based alarms for hardware-based applications. An additional and distinct necessity is supervisory control for the hardware, which has traditionally not been a major part of the observability stack in the world of software monitoring.
One of the projects that our Edge team has been working on is an experimental, simulation-based application of some new and exciting features within Grafana. Our aim is to improve usability for hardware-based observability applications.
In the example below, I’m going to share what we’ve done using real-time monitoring and control of a simulated DJI Mavic 2 Pro drone. Loads of credit goes to my teammate Nathan Marrs for all of his work on this during our company-wide hackathon!
The basics
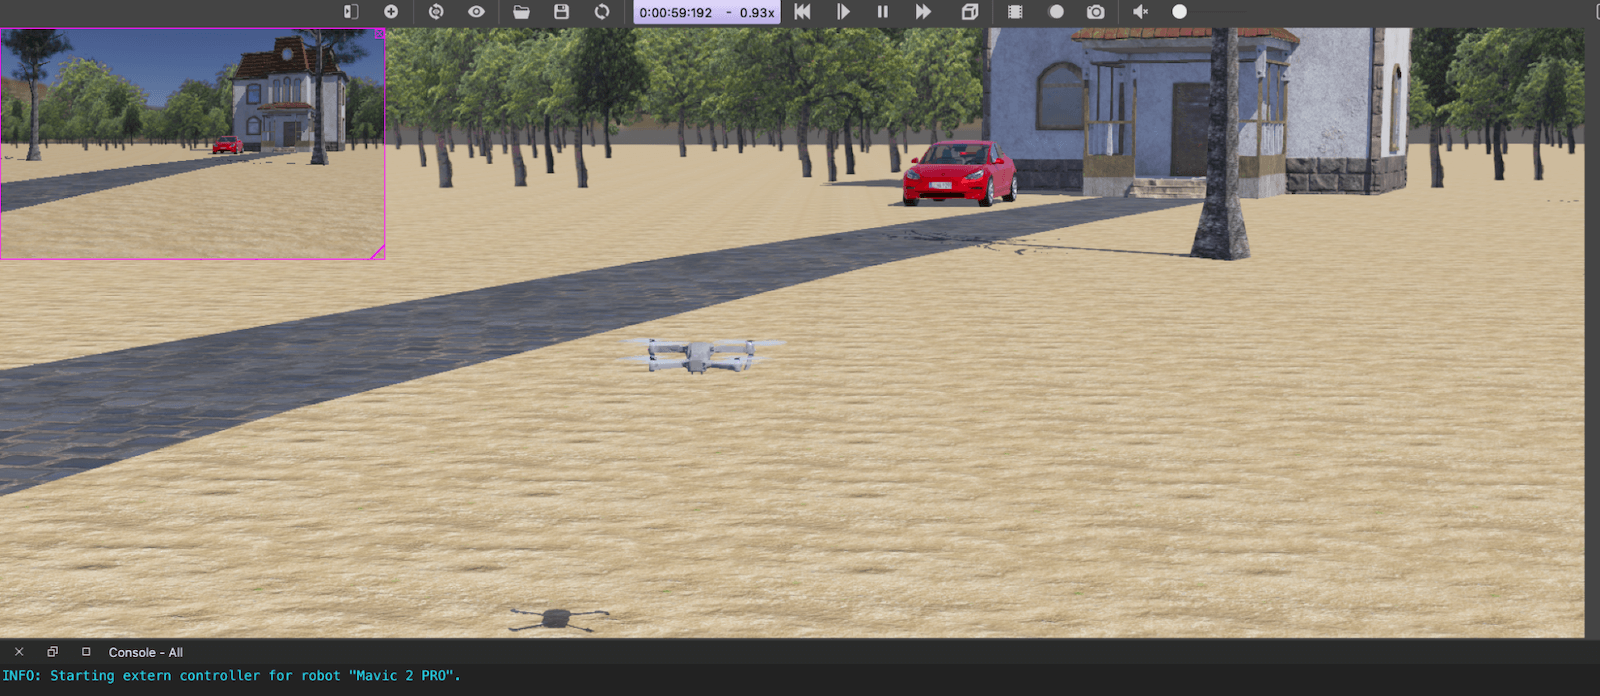
In order to simulate the drone, we used an open-source 3D robot simulator called Webots. We used some of the basic built-in sample models, sensors, and actuators within the software package to construct a simulated world with a drone and some realistic real-world objects. The internal physics engine provided us with a reliable way to test and develop a very basic controller for the drone’s attitude control and live data telemetry.

Real-time simulation of a DJI Mavic 2 Pro Drone
We used Grafana Live to ingest the real-time sensor data from the simulation environment for visualization on a dashboard at about 20Hz. Note that this can be easily bumped up to about 30Hz if need be, depending on the size of the payload. The data contained all the basic telemetry information that is readily available for most consumer and commercial drones, such as accelerometer and gyroscope data, positional data from GPS, rotor velocities, heading information from compass, battery and signal diagnostics, and more.
Monitoring
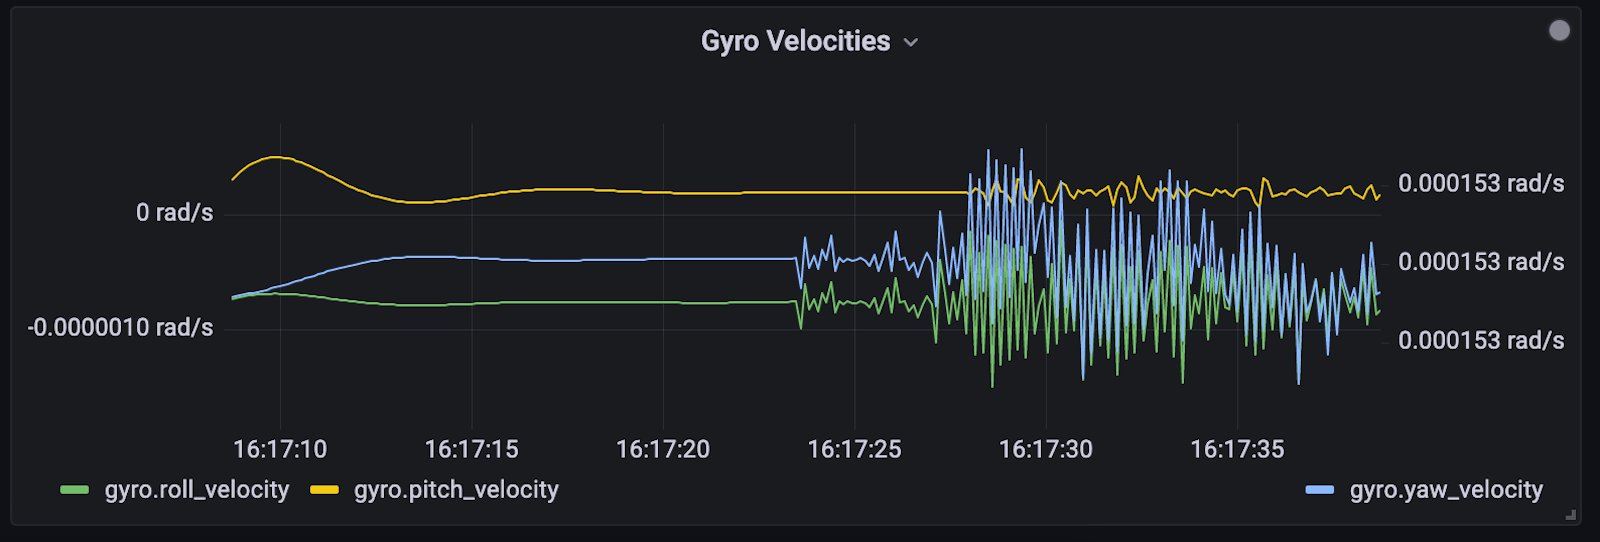
A simple time-series panel was used to visualize the rotational velocity data from the gyroscope on-board.

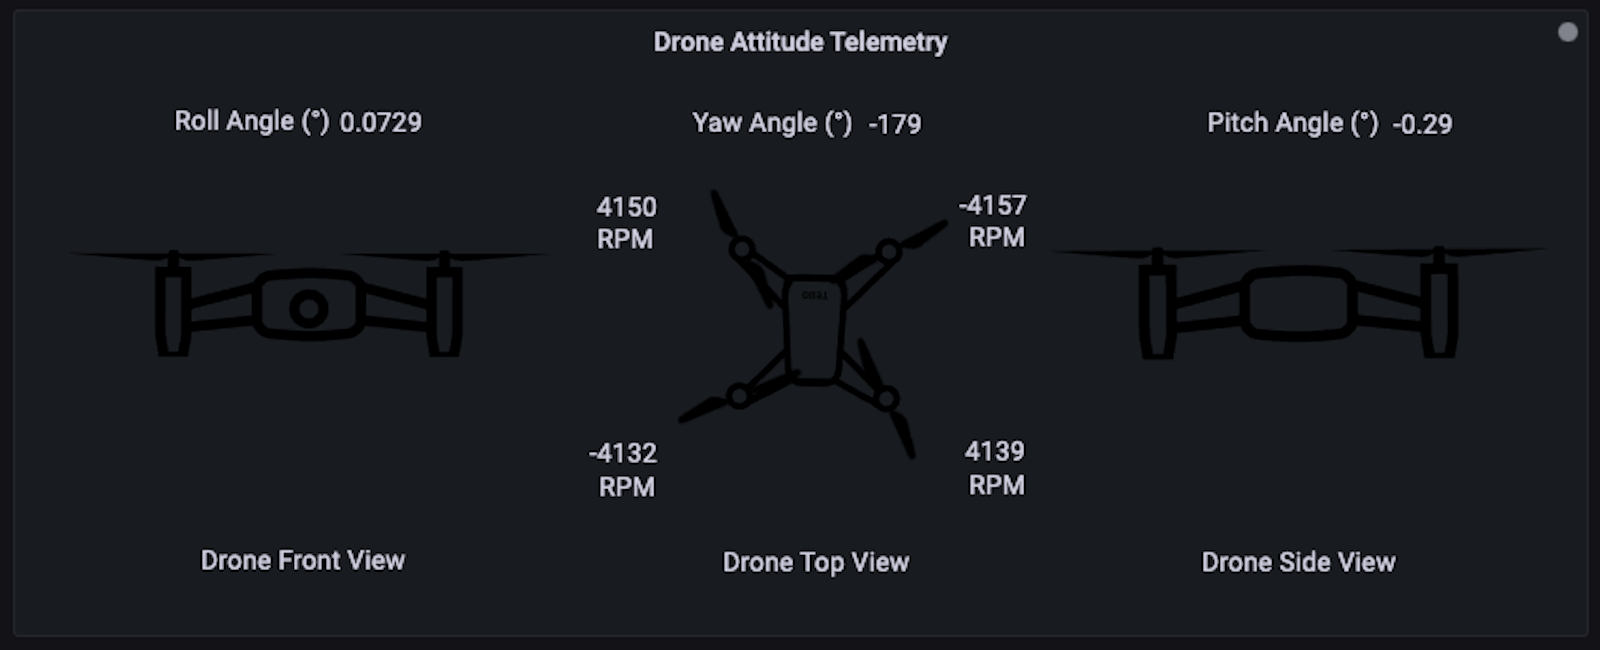
Below, you can see the Canvas panel (under early development!) for the visualization of the real-time attitude telemetry from the drone, with appropriate views of the drone as they relate to the roll, pitch, and yaw of the simulated drone.

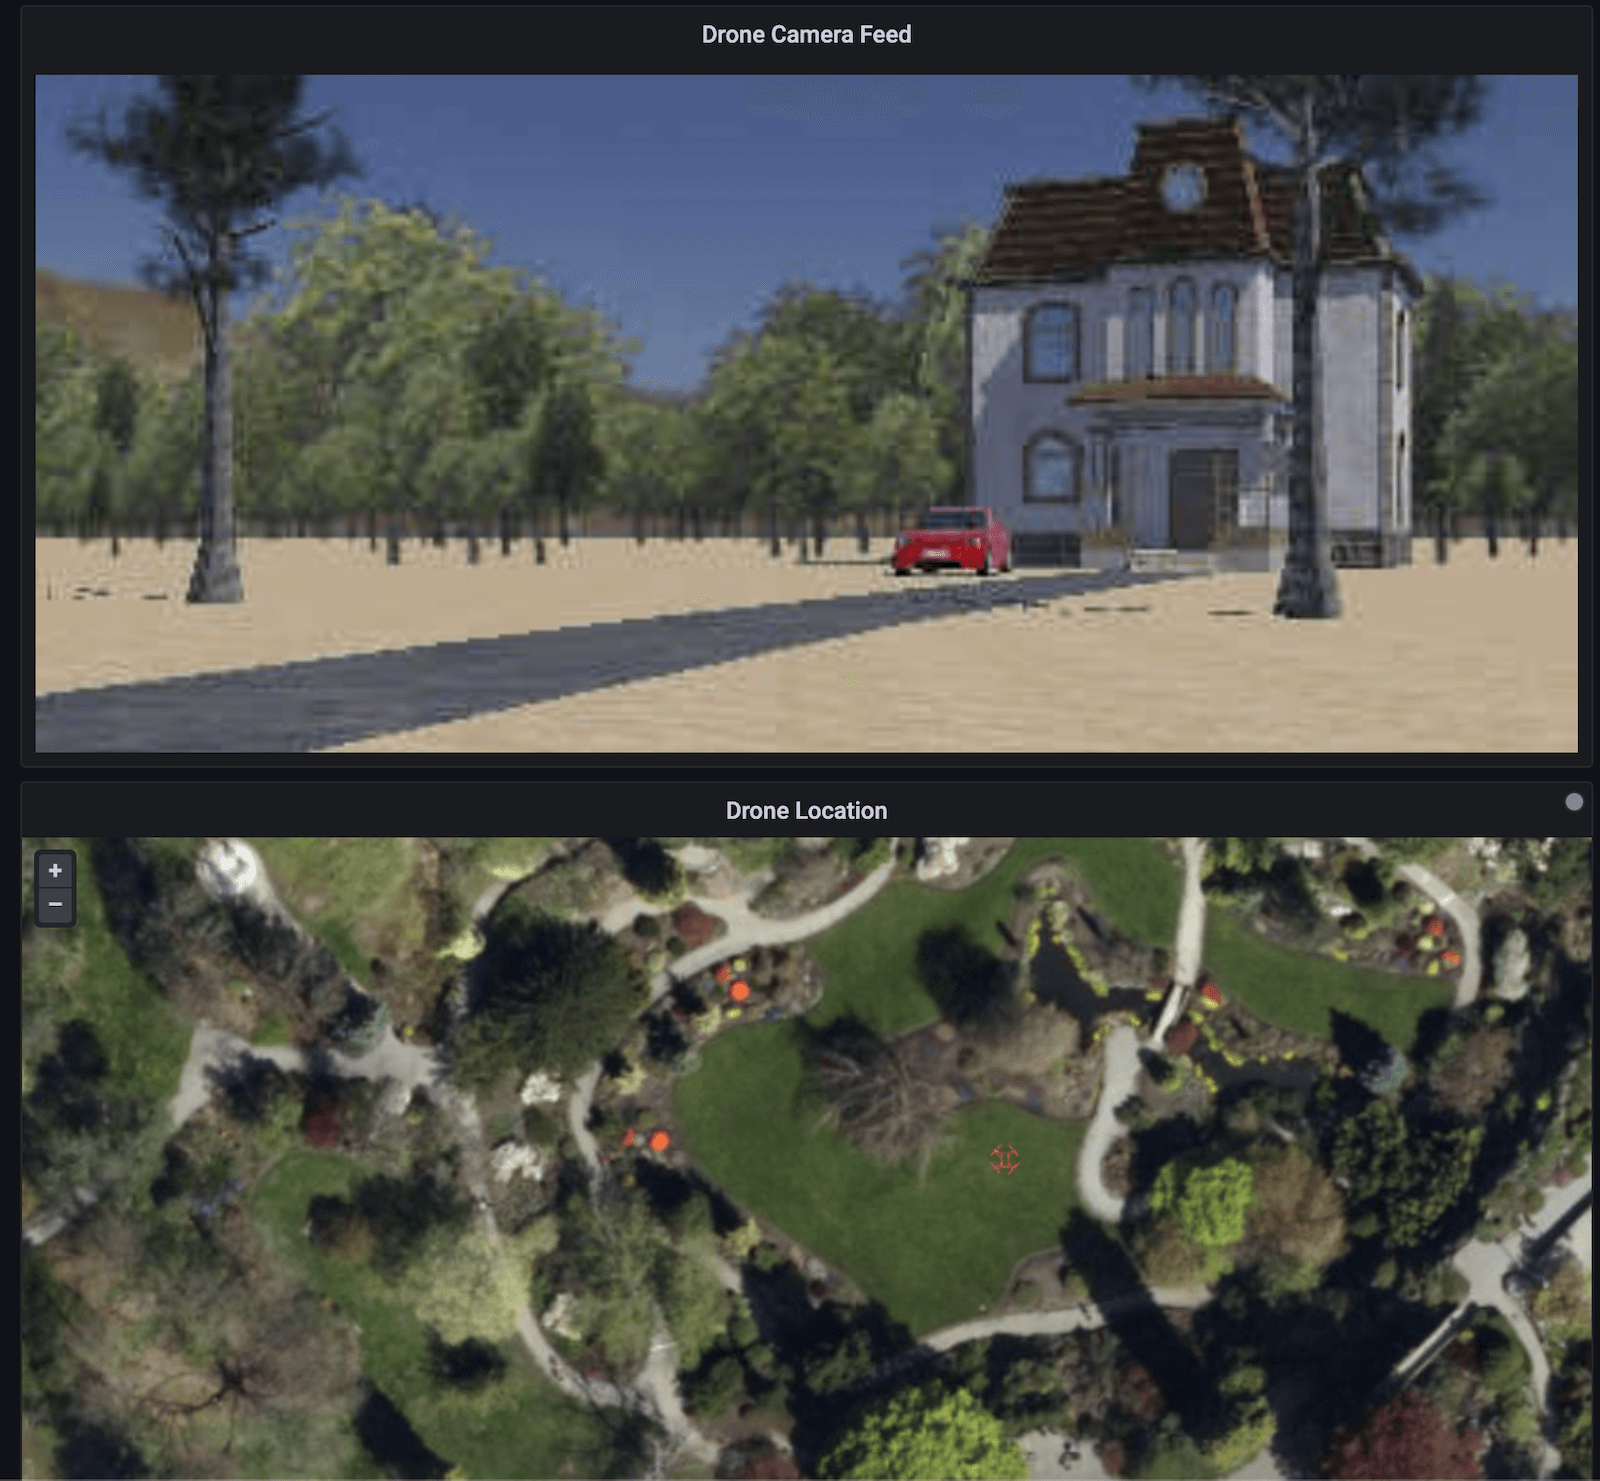
On top of that, we utilized the Text panel in the HTML mode to show the live camera feed from our simulation. The newly released Geomap panel was used to show the real-time drone location.

Live camera and location feed from the simulated drone
We also added remote-write capabilities using buttons on our Canvas panel (below) to control the drone movements. We were also able to trigger other potential pre-programmed actions, such as taking a picture or performing a specific maneuver.


Check out this video to see our remote drone tracking and management dashboard demo, which puts together all the different pieces. This can be easily extended to a swarm of drones (or any other number of robots, industrial equipment, IoT assets etc) using the template-based querying and dashboard system, and the highly-flexible and robust native Live features in Grafana.
There’s supposed to be a video here, but for some reason there isn’t. Either we entered the id wrong (oops!), or Vimeo is down. If it’s the latter, we’d expect they’ll be back up and running soon. In the meantime, check out our blog!
Conclusion
This simple demonstration showcases the power of observability tools within the context of swarm-based asset tracking and management. Sensor-based physical world insights and preventive actions are just a dashboard click away for most automation, IIoT, and robotics applications with such approaches.
With the bulk of related data siloed away in disparate systems starting right at the Edge, it has traditionally been hard to leverage any meaningful observability techniques. But with the advent of Grafana Cloud — coupled with several community and enterprise plugins, plus an ever-evolving list of native Edge-focused Grafana features — this is becoming easier every day.


