Going off-label with Grafana Loki: How to set up a low-cost Twitter analysis
The term “off-label” is used to describe when a product is being used successfully for something other than its intended purpose. It’s a quite common occurrence in the pharmaceutical industry, but it can also happen in the world of software.
Grafana Loki was written as — and is marketed as — a simple, Prometheus-friendly logging backend with a very low total cost of ownership. It’s great at its intended purpose, but its architecture makes it a rich source of off-label usages.
Here’s why: Loki does not index the content of logs. Instead, it only indexes the labels that you attach to logs — just like Prometheus. Because of that, it accepts all log formats. And in fact, what Loki really does is store snippets of plain text and index the accompanying metadata. So with all of that in mind, it’s easy to come to the realization that Grafana Loki doesn’t have to be used for logs at all.
Once it dawned on me that Loki was so flexible, I wanted to find some good data to stream into Loki to prove out this idea. Twitter has been an interesting place for more than a decade now, and people have been analyzing the tweet stream for just as long. The API is straightforward and very customizable.
If you want to analyze tweets over any period of time, then you need to store them in a backend that can be queried. You might also want to be able to track numerical metrics about the tweets, such as how many times a certain word is used. And since the tweets literally never stop, you need to be able to scale. Grafana Loki, of course, can handle all of that with ease.
Getting started
The sample code I used for this project is here. It uses the Twitter API, accessed via a Bearer token, to stream tweets into whatever Loki backend you want (Grafana Cloud Logs, Grafana Enterprise Logs, or open-source Loki).
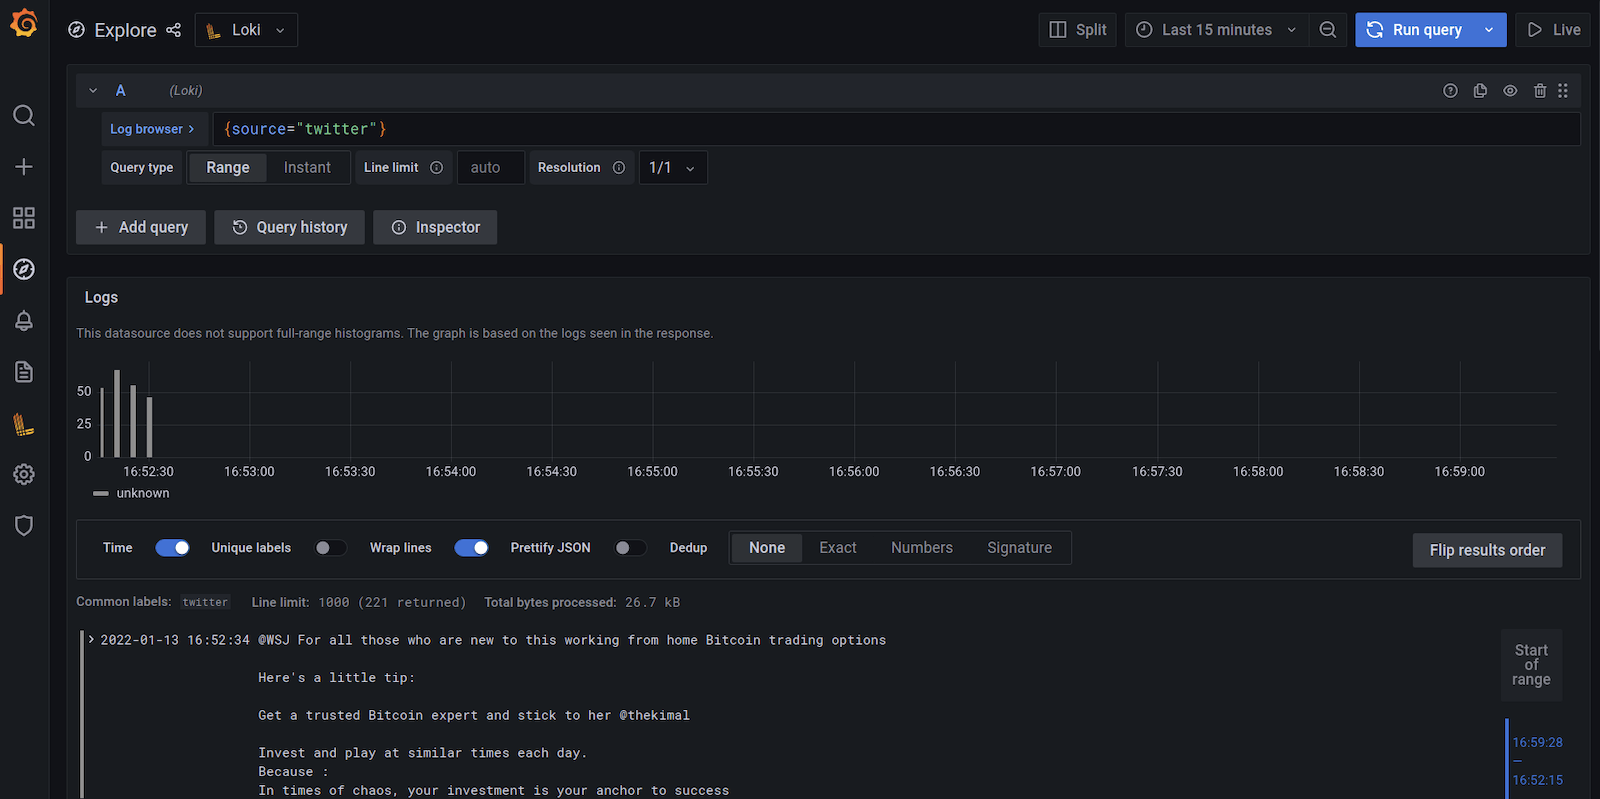
To get started, you just have to open up Grafana and click on the “Explore” icon on the left (it’s the compass). Pick your Loki datasource from the drop-down at the top of the page, and then you can start using LogQL to analyze the tweets.
All LogQL queries are made up of two parts: the log stream selector and the log pipeline. When you push data to Loki, you must also push metadata to describe the data. That metadata is defined as key-value pairs called labels. The Python code used in this post only uses one label, source=twitter. Any querying you do will always use that same label selector:{source="twitter"}

Explore mode with the log stream selector needed to analyze tweets
Next, you need your log pipeline. That defines what you want to search for in your logs. For instance, if you wanted to search all your tweets for “@elonmusk” you would do the following:
{source="twitter"} |= "@elonmusk"
Tip: When using Explore mode in Grafana, hitting “Enter” in the query box adds a newline. You can hit Shift+Enter to trigger the query instead of adding a newline.
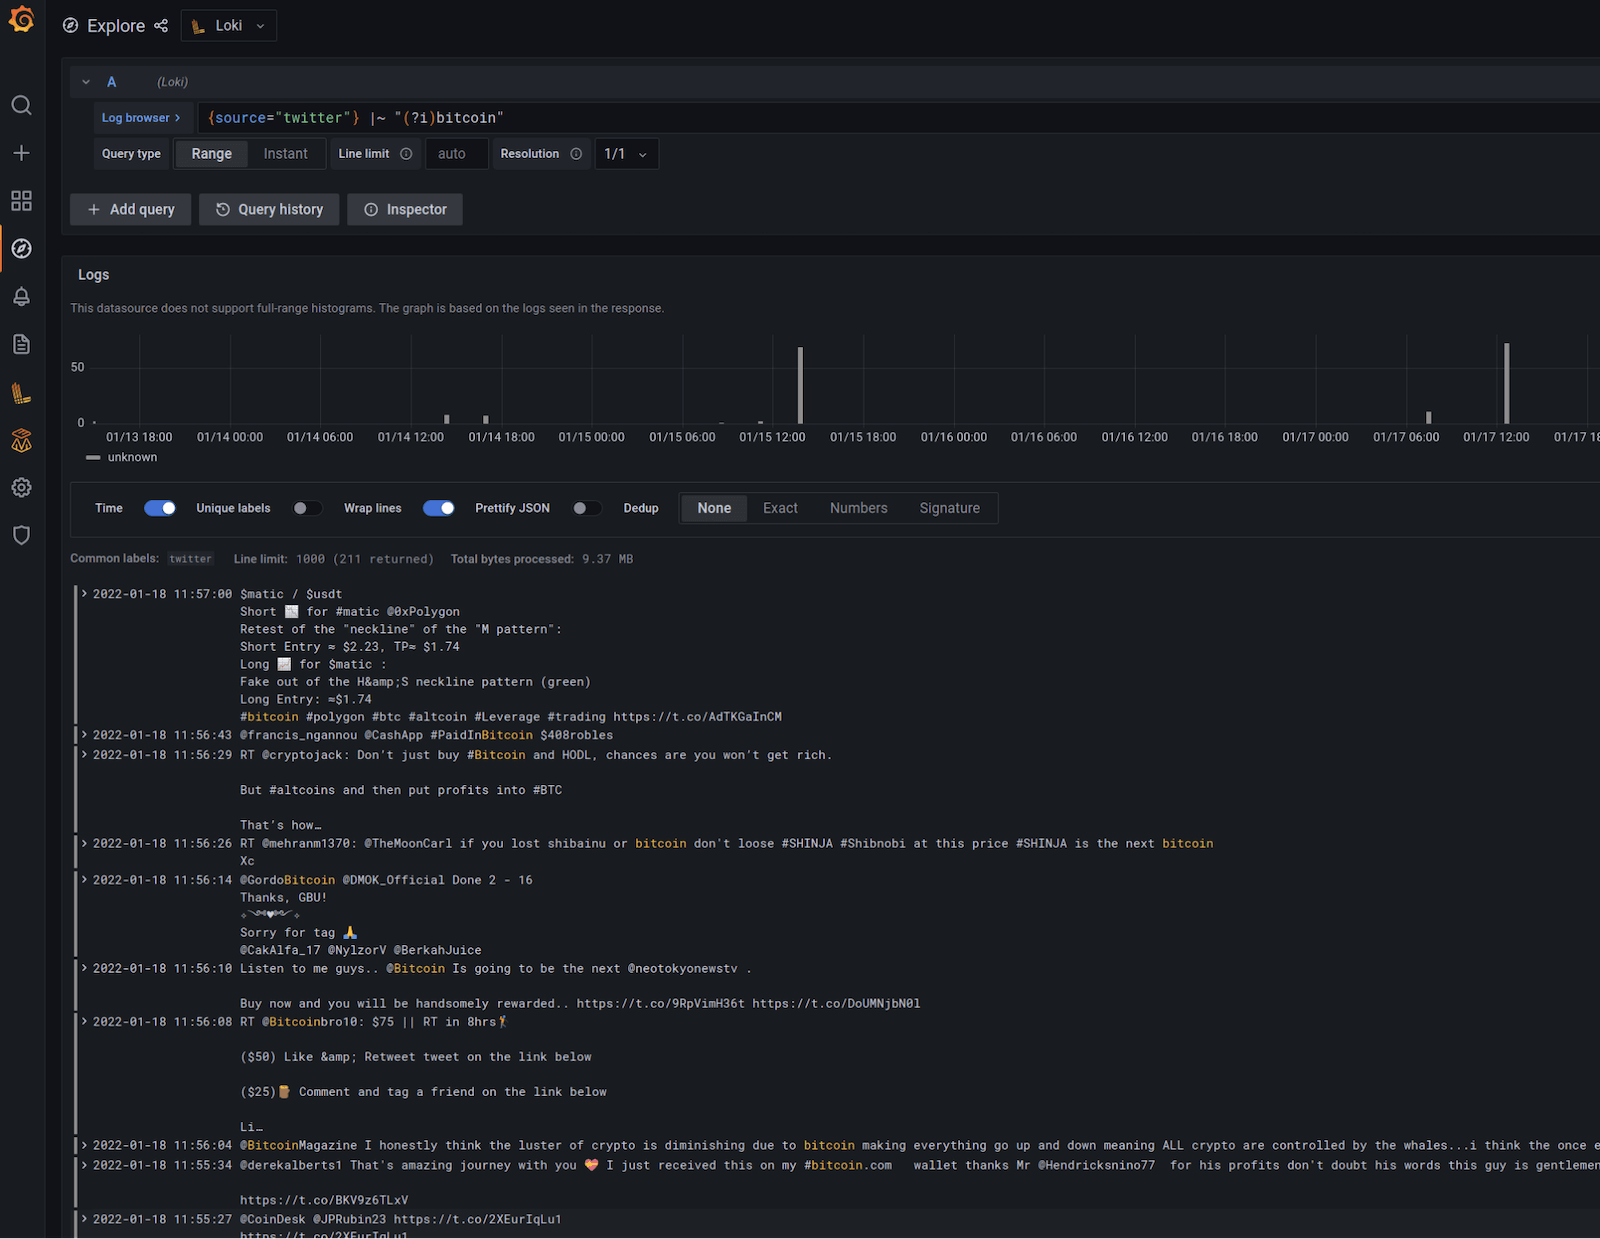
You can also use the full RE2 regex engine (explore the rules here). You can use “flags” for queries that require special rules. The “i” flag makes a query case insensitive. So if you wanted to do a case insensitive search for bitcoin or Bitcoin or BITCOIN, etc, you would use:
{source="twitter"} |~ "(?i)bitcoin"

A case insensitive query for the word “bitcoin”
Grafana Loki allows you to create metrics from your LogQL queries. For instance, instead of just looking for particular content in the tweets, we can count the number of times that particular content shows up.
You can use the count_over_time function to count the number of instances of a word over a certain time period. If you were curious how often people are saying “NFT” in one minute intervals (spoiler: it’s way more often that “bitcoin”), then you could use:
count_over_time(({source="twitter"} |~ "(?i)nft")[1m])

The number of times that the case-insensitive phrase “nft” was found in one-minute intervals
Most of the time it’s more interesting to understand the rate of something happening, as opposed to the absolute number of times something happens. Grafana Loki makes that just as easy. If you wanted the rate of incidence of the phrase “interest rate” over one-hour intervals, you could find out quickly with:
rate({source="twitter"} |~ "(?i)interest rate"[60m])

How often are people saying “interest rate” over 60-minute periods
Endless possibilities
I could spend all day making up LogQL queries to explore the data but I’ll keep this blog post simple.
You could follow this same process with any other source of streaming data: Reddit comments, stocktwits, Mastodon, Salesforce Chatter, JIRA updates, you name it. Anything you can capture in plain text, you can easily store in Loki for analysis. Explore LogQL in the docs here then find out what the world is thinking. Happy querying!
Grafana Cloud is the easiest way to get started with metrics, logs, traces, and dashboards. We have a generous free forever tier and plans for every use case. Sign up for free now!


