
How to improve Go application performance
This post was originally published on pyroscope.io. Grafana Labs acquired Pyrsocope in 2023.
Recently we released a new feature where users can run Pyroscope in pull mode. It allows you to pull profiling data from applications and it has various discovery mechanisms so that you can easily integrate with things like Kubernetes and start profiling all of your pods with minimum set up.
For Pyroscope, here are the difference between push and pull mode:
- Push mode: Sends a
POSTrequest with profiling data from the application to the Pyroscope server and return a simple response. - Pull mode: Pyroscope sends a
GETrequest to targets (identified in config file) and the targets return profiling data in the response.
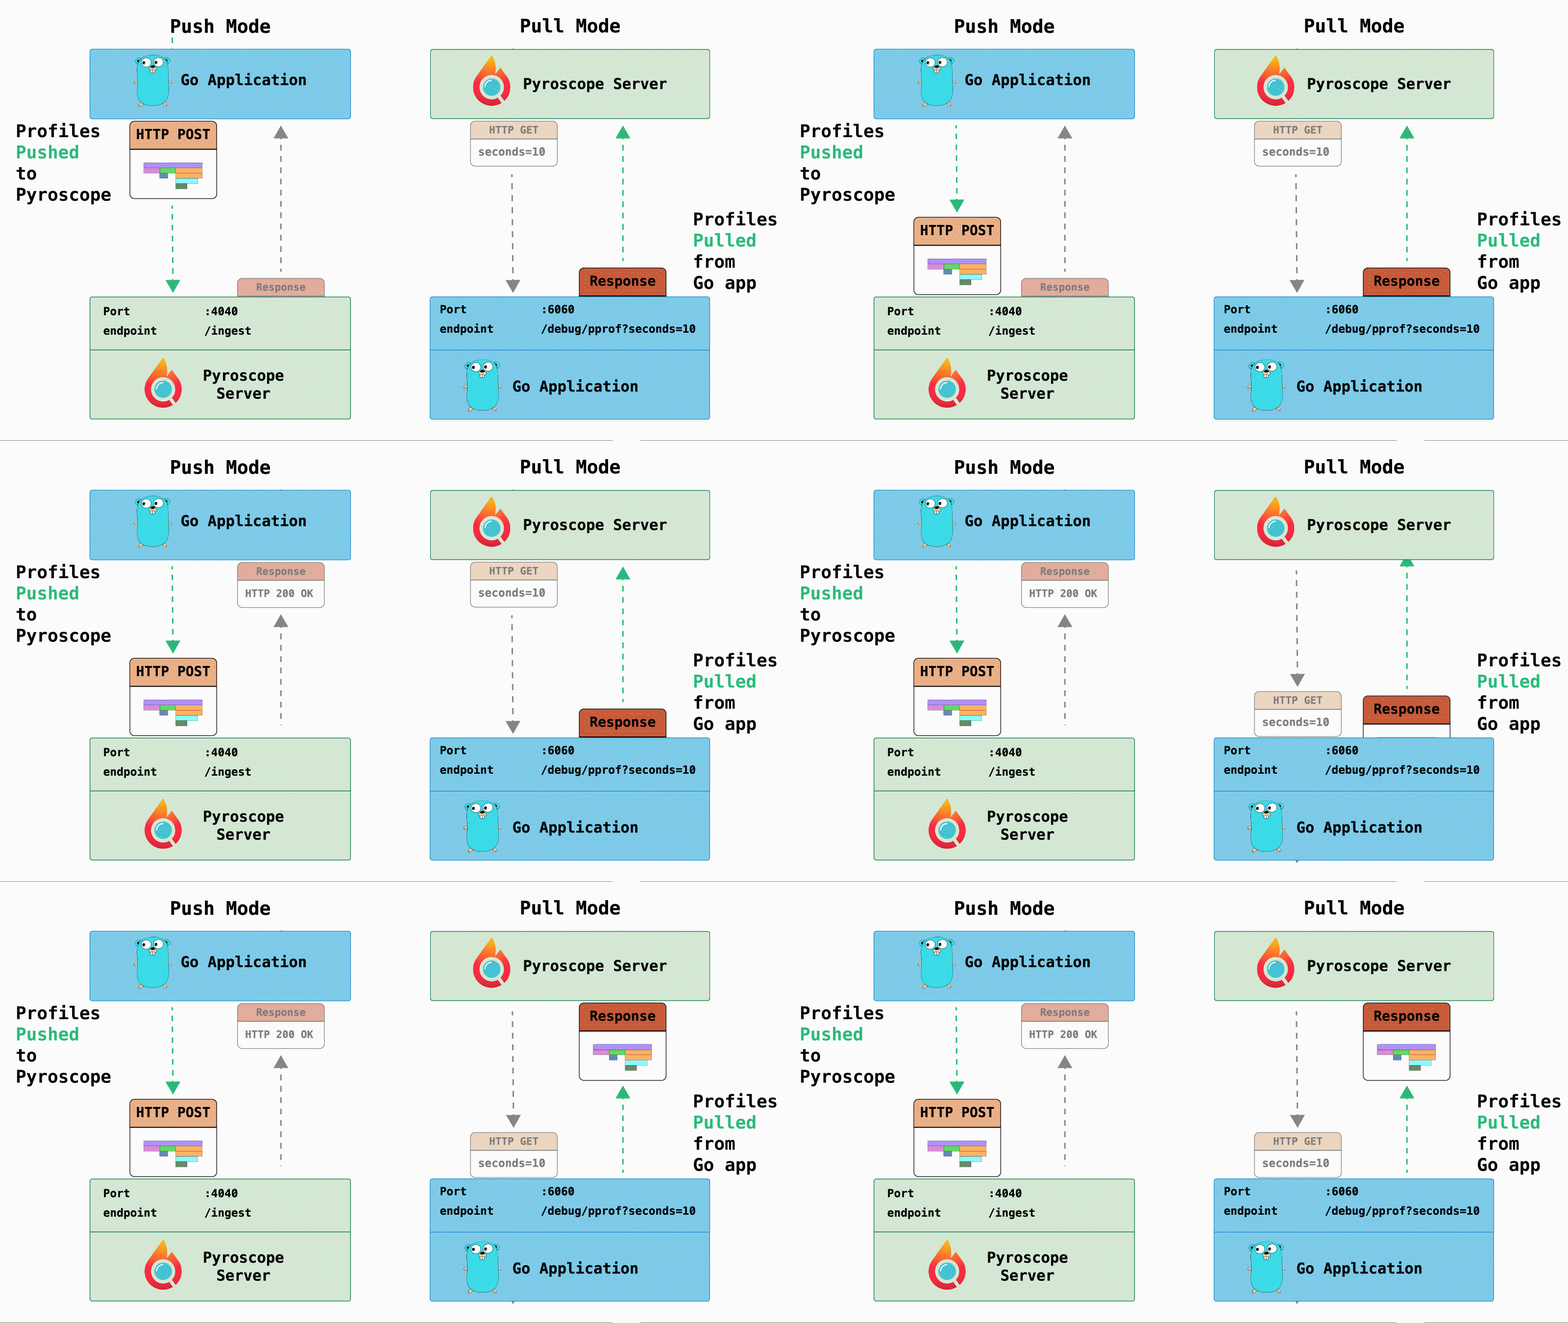
One of the major benefits of pull mode is creating meaningful tags. For example, in Kubernetes workflows you can tag profiles with popular metadata fields:
- pod_name: Name of the pod
- container_name: Name of the container
- namespace: Namespace of the pod
- service_name: Name of the service
Then using Pyroscope’s query language, FlameQL, you can filter profiles by those tags over time to see where the application is spending most of its time.
Early on we had a user who ran Pyroscope in pull mode with about a thousand of profiling targets and about 1 TB of raw profiling data per day, but their Pyroscope server was running into some performance issues.
This was surprising to us because in push mode, we’ve seen Pyroscope handle similar amounts of traffic without issues. Therefore, we suspected that the performance issue had to do with one of the key architectural difference between push mode and pull mode.
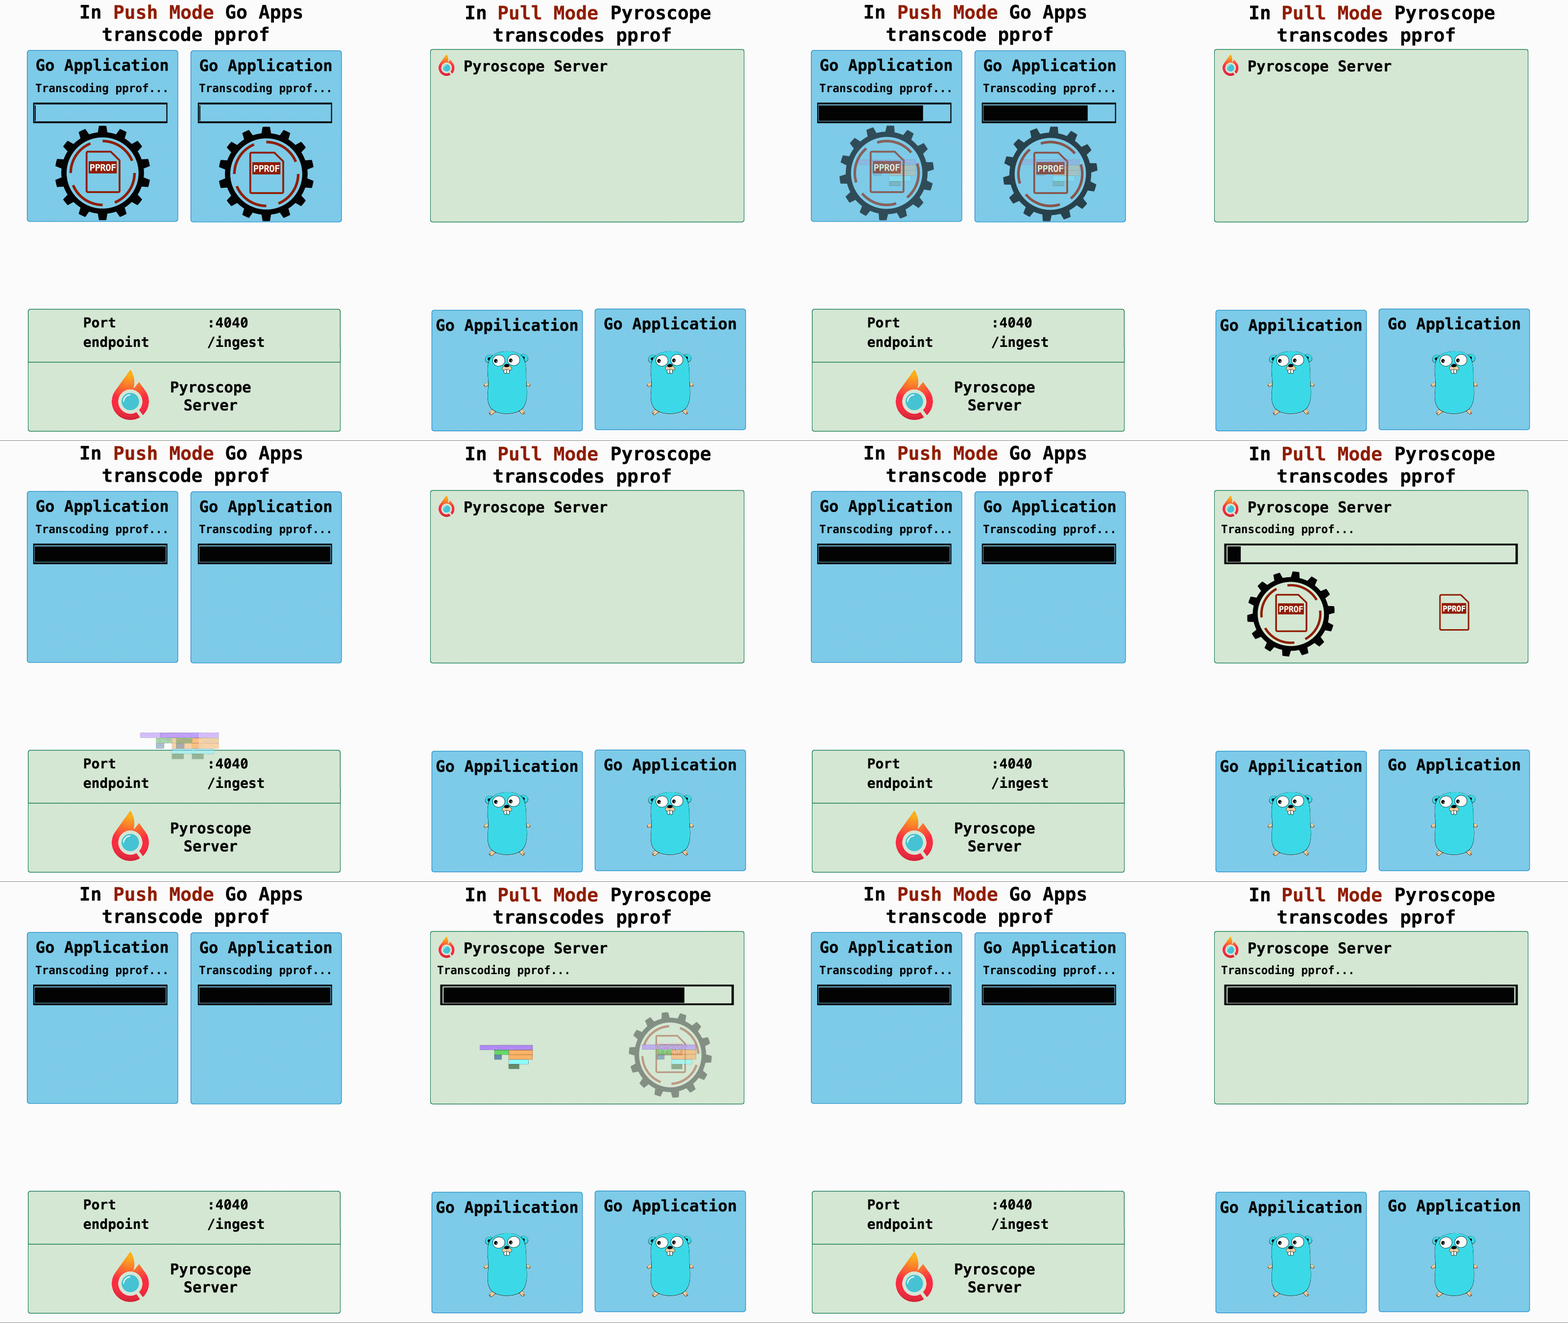
While pprof is a great format for representing profiling data, it’s not the most optimal format when it comes to storing profiling data. So, we transcode pprof into our internal format that we optimized for storage in our custom storage engine.
- Push mode: In push mode pprof transcoding is done on each profiling target so the load was distributed across many targets.
- Pull mode: In pull mode we moved pprof transcoding to the server side so the load was distributed across only one target.
So, we immediately suspected that this performance regression might have something to do with the load increase on the pulling server.
Using profiling to spot performance issues in Go
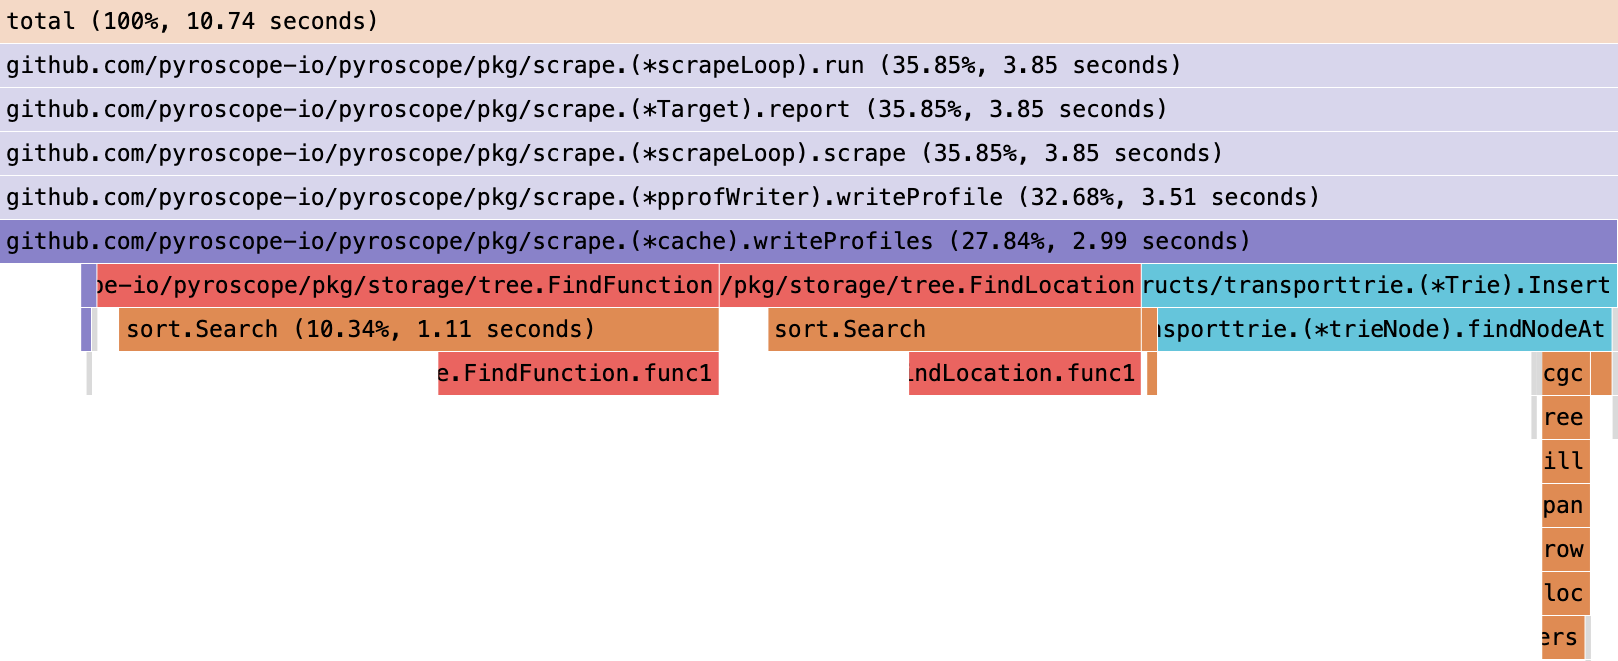
Pyroscope server is written in Golang and it continuously profiles itself. So, when these kinds of issues happen we’re usually able to quickly find them.
On this screenshot you can see that the two functions taking up a lot of time are FindFunction and FindLocation. When Pyroscope transcodes pprof profiles into an internal flame graph format these functions are called as part of that process. However, it seemed suspicious that such simple functions were consuming so much CPU time.
To understand the necessary elements to “find” Location and Function we looked up how pprof objects are structured:
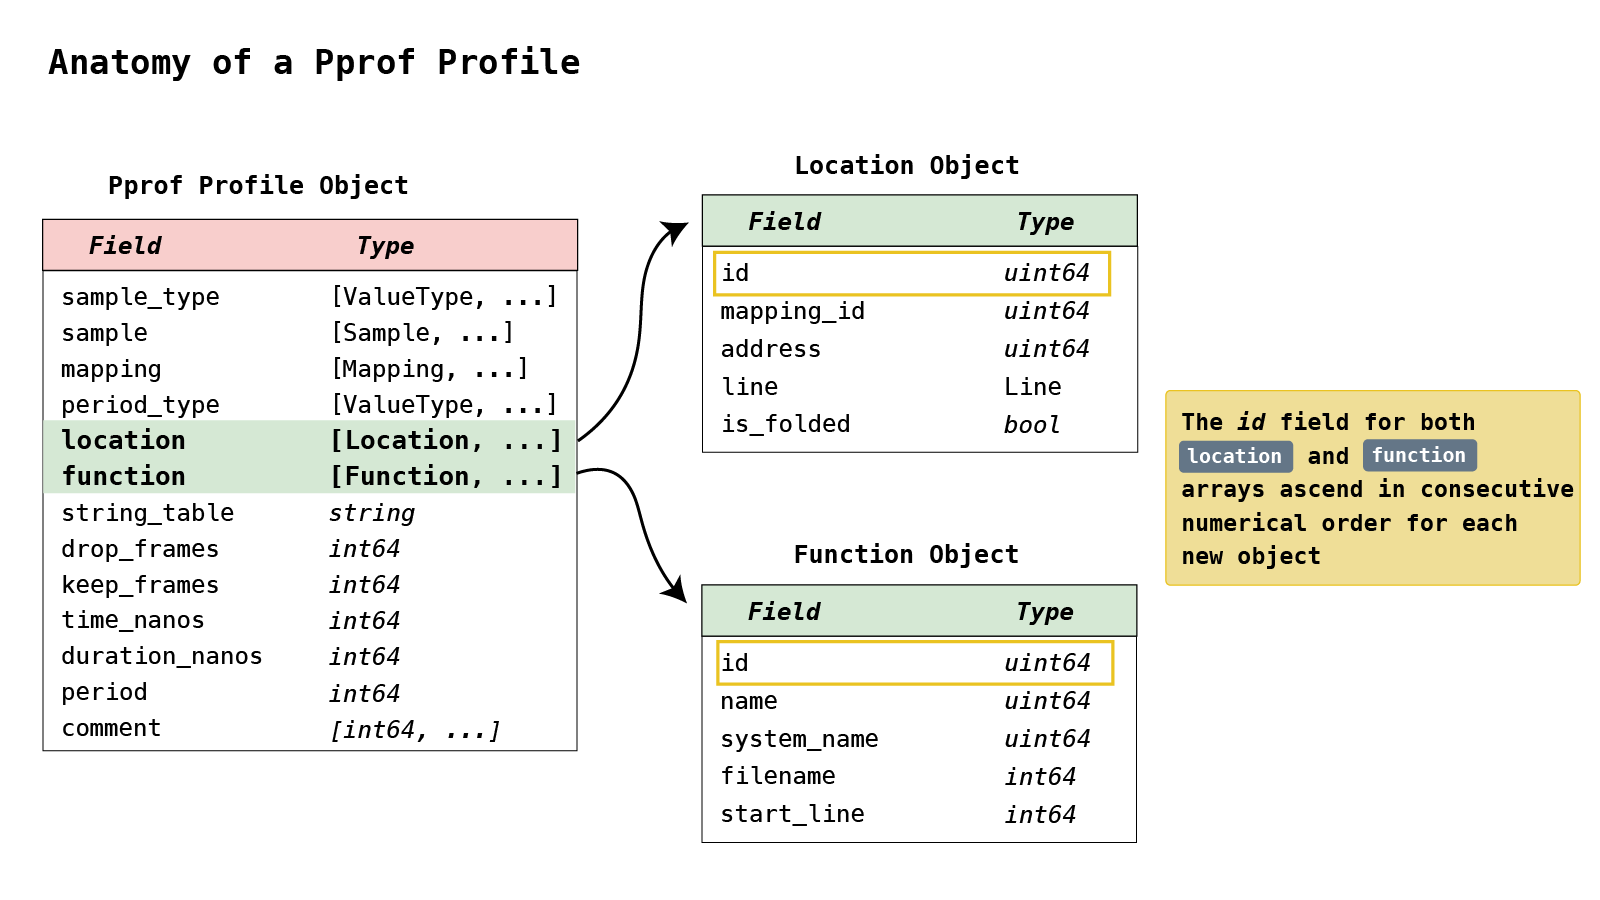
Note that location and function fields are actually arrays, containing the locations and functions respectively. The objects in these arrays are identified by ID.
FindFunction and FindLocation functions are almost identical and they both search through their respective arrays searching for objects by ID.
func FindFunction(x *Profile, fid uint64) (*Function, bool) {    // this sort.Search function is the expensive part    idx := sort.Search(len(x.Function), func(i int) bool {        return x.Function[i].Id >= fid    })
    if idx < len(x.Function) {        if f := x.Function[idx]; f.Id == fid {            return f, true        }    }    return nil, false}
And if you look closer at the functions they seem to be pretty optimized already — they use sort.Search, which is a Golang implementation of binary search algorithm. We initially assumed that binary search would be the fastest here, because it’s typically the fastest way to search for an element in a sorted array.
However, looking at the flame graph, this was the bottleneck that was slowing down the whole system.
Performance Optimization #1: Caching the data in a hash map
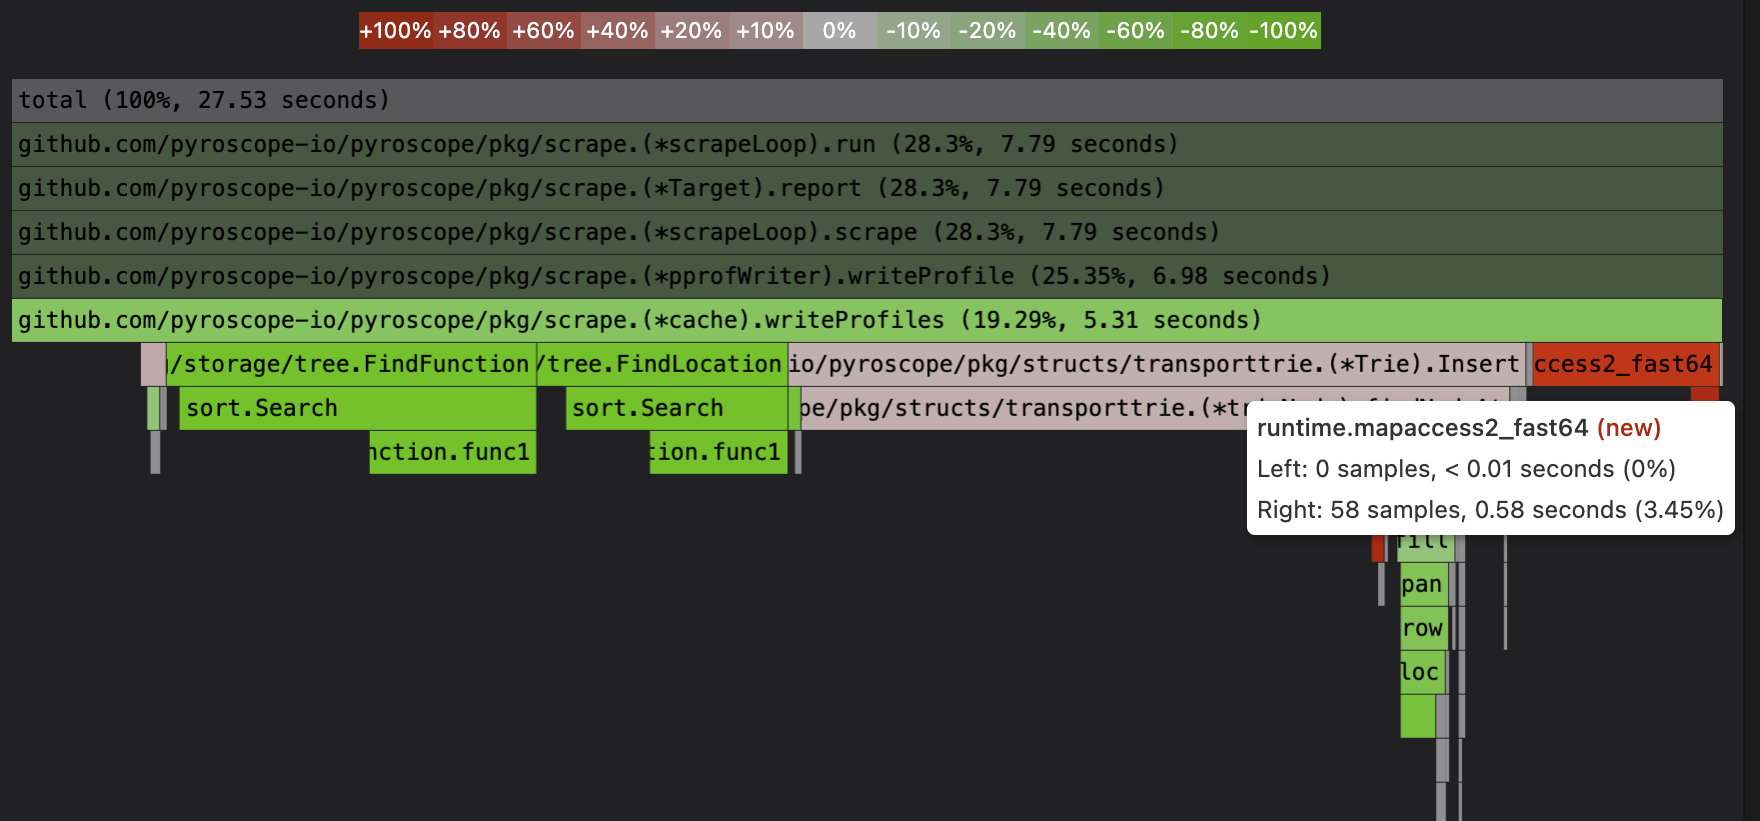
In our first attempt at fixing the issue we tried to use caching. Instead of performing the binary search every time we needed to find a function, we cached the data in a hash map.
That did improve the performance a little bit, but we only traded one relatively expensive operation (binary search: Green) for another one (map look ups: Red) that used slightly less CPU but still were expensive.
Performance Optimization 2: Eliminating the need for binary search
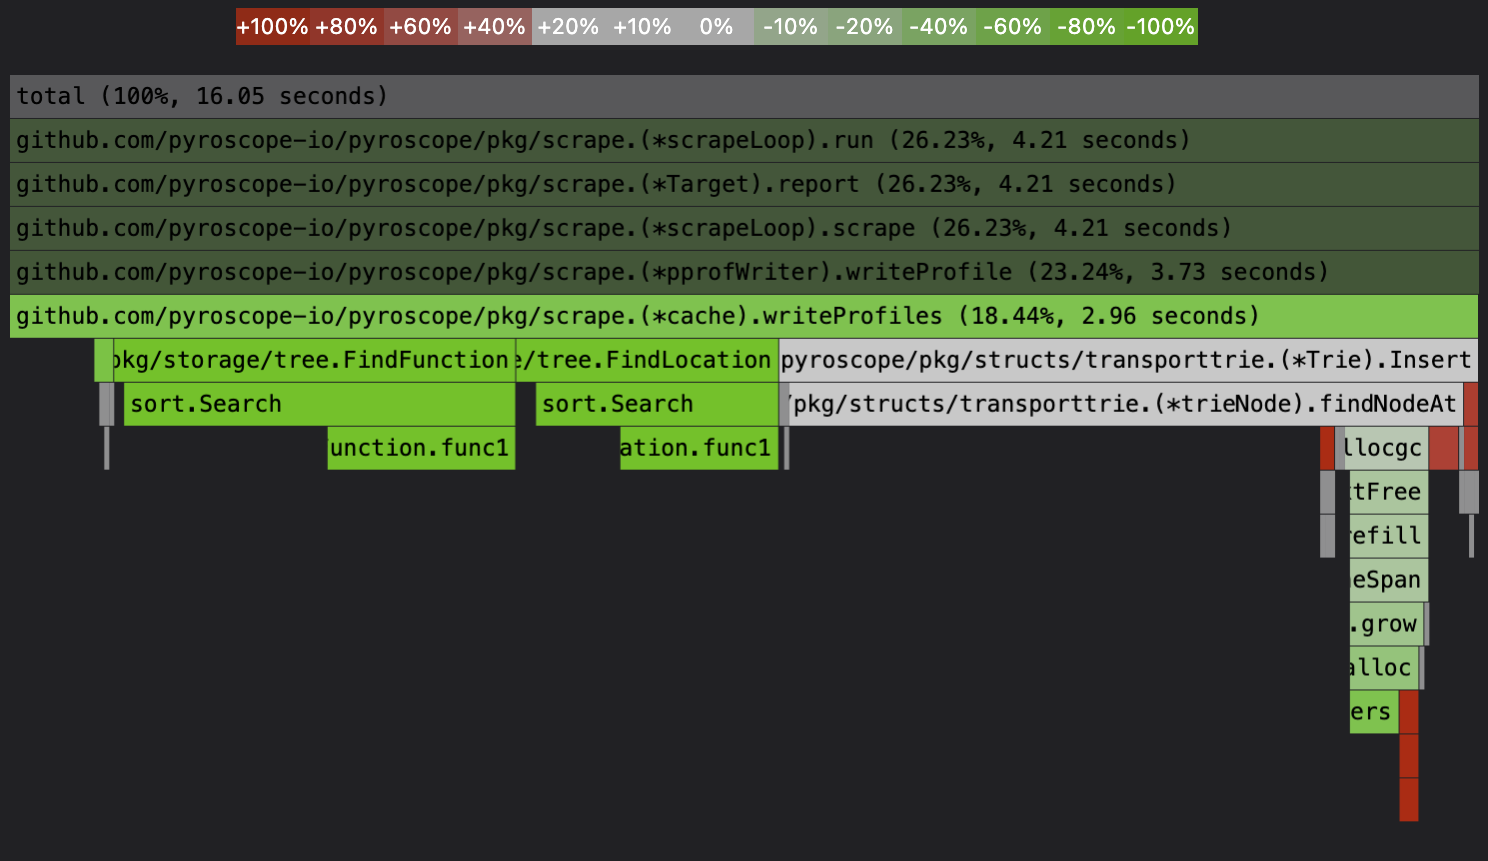
As I mentioned earlier, objects in function and location arrays were sorted by ID. Upon closer inspection, we discovered that not only were the arrays sorted, but the IDs also started at 1 and ascended in consecutive numerical order (1,2,3,4,5). So if you wanted to get an object with ID of 10, you look at the object at position 9.
So, although we initially thought binary search was the fastest way to find functions and locations in their respective arrays, it turned out that we could eliminate the need to search altogether by referencing objects by their ID – 1.
This resulted in complete removal of the performance overhead caused by FindFunction and FindLocation functions.
What happens when you profile a profiler?
In retrospect, we probably should have started with looking at the specifications for a pprof object before assuming that binary search was the best way to find objects. But we wouldn’t have even know to look at the specifications until we started profiling our own code.
It’s just the nature of developing software that as complexity increases over time, more performance issues sneak their way into the codebase.
However, with continuous profiling enabled, it allows you to spot these performance issues in your code and understand which parts of your code are consuming the most resources.
If you’d like to learn more about how to get started with Pyroscope and learn where your code’s bottlenecks are, check out the Pyroscope documentation.


